
Inflation waning while bonds dispute moves in stocks
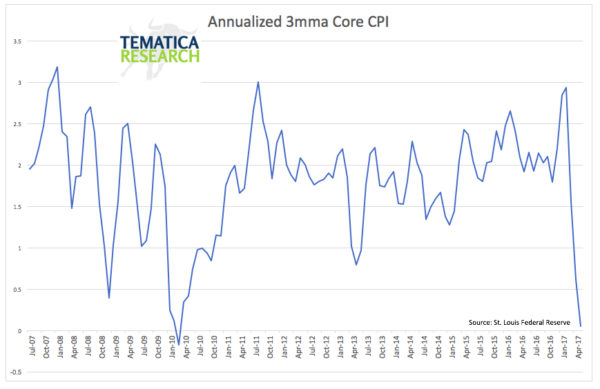
Wednesday the Federal Reserve, as expected, raised rates, but even more importantly they release an outline of their plans to shrink the Fed’s balance sheet, which you can read here. We must also note that raising rates in a period of falling bond yields and where the 3-month change in core CPI is collapsing is unheard of, but then very little of U.S. monetary policy these days in within the bounds of normal.
Here are just a few reality checks to keep in mind.
Stocks are experiencing below average volatility and volume
- On average, the S&P 500 experiences around 50 days where the market moves +/- 1 percent, but so far in 2017 we have experienced only 6 such days.
- The 30-day NYSE average daily volume is down 16 percent from the post-election peak
Concentrated Gains
- According to Barron’s, Facebook (FB), Apple (AAPL), Amazon (AMZN), Microsoft (MSFT) and Alphabet (GOOGL) collectively account for about 56 percent of the $1.16 trillion gain in the NASDAQ 100 market cap since the start of the year and are responsible for around 40 percent of the gain in the S&P 500 year-to-date: recall that back in 2000 Microsoft, Qualcomm (QCOM), Cisco (CSCO), Intel (INTC) and Oracle (ORCL) represented about 50 percent of the NASDAQ 100.
- Collectively the FAANG trade trades at a P/E ratio of 39x, (versus 2017 EPS), which represents a 7-point expansion in 2017 alone.
- 32 percent of actively managed funds are overweight the tech sector
- 71 percent of actively managed funds are overweight FANG
- The returns for the S&P 500 equal weight index is over 3 percent below the S&P 500 market cap weighted index year-to-date
Bonds are not telling a growth story
- US 10-year Treasury yield has fallen from 2.6 percent in March to just over 2.1 percent today.
- US 30-year Treasury yield has dropped from a peak of over 3.2 percent in the first quarter to less than 2.8 percent for the first time since November.
- The Treasury curve, which has been flattening for some time, accelerated this trend this week, with the 10-year to 2-year spread falling below 80 basis points for this first time since last September.

The Bottom Line
- Tops never look like tops until after they are well behind you.
- They typically occur when investors are most confident.
- They always occur before we are ready.