I’m all about that base when it comes to inflation
Last week on our Cocktail Investing podcast, Chris and I spoke about how I’m not so much on board with the rising inflation camp because of the base effect, (Ok, so not quite bass, but close) which has become the phrase of the week in some circles. So what am I looking at that all those who buy into the reflation trade aren’t seeing?
First, let’s look at oil.
By mid-February 2016, the price of oil had fallen nearly 76 percent and was finally finding a bottom around $26 a barrel.
WTI Crude Oil Spot Price data by YCharts
In response, production cuts continued so that by the end of May 2016, rig counts in the U.S. had fallen almost 80 percent from their highs.
US Rig Count data by YCharts
With such a low base, under $30 a barrel, it didn’t take much for the price of oil to experience enormous gains on a percentage basis. By late February of 2017, the price had risen 108 percent from its February 2016 lows.
WTI Crude Oil Spot Price data by YCharts
Oil is a key input to nearly everything, giving it an outsized impact on prices. Thus a 100 percent increase in the price of oil is going to have an effect, but looking over the past 10 years, today’s price is still relatively low.
WTI Crude Oil Spot Price data by YCharts
To get an idea of where oil prices may head in the future, we like to look at what is happening with rig count, as that tells us about future production coming online. Remember that rig counts had dropped nearly 80 percent as the price of oil plummetted to below $30 a barrel.
US Oil Rig Count data by YCharts
Unsurprisingly, as the price of oil rose, companies brought more and more oil rigs online, where today we are up over 108 percent from the May 2016 lows. However, we are still well below where we were in October of 2014 when oil was in the $80 range. Keep in mind though that all that pricing pressure has led to cost reductions, such that many extractors can be profitable at lower prices today than just a few years ago. We’ve been reading reports that many shale oil producers can now be profitable at as low as $30 a barrel.
US Oil Rig Count data by YCharts
More rigs are coming online, and we are just 6 percent below the record high crude inventory levels, which tells me that we are unlikely to see crude prices rise substantially from this point, particularly on a percentage basis, barring any geopolitical shocks. Keep in mind too, that any regulatory rollback by the Trump administration on energy is likely to further reduce the break-even levels and could spur even more domestic production.
It hasn’t been just oil that has seen a dramatic rise in prices since the early parts of 2016.
Copper, Aluminum, Natural Gas, Heating Oil, Lead, Zinc, Silver are all up well into the double-digits on a percent basis from January 2016, after having taken a serious beating early last year. However, it looks as though we may now be starting to see prices level off, which means these inputs would no longer be having an outsized impact on prices due to their exceptionally low price levels back in early 2016.
We’ll be keeping a close eye on these as we head into earnings season and get more insight into what companies are experiencing versus the sentiment that has been blowing the doors off.
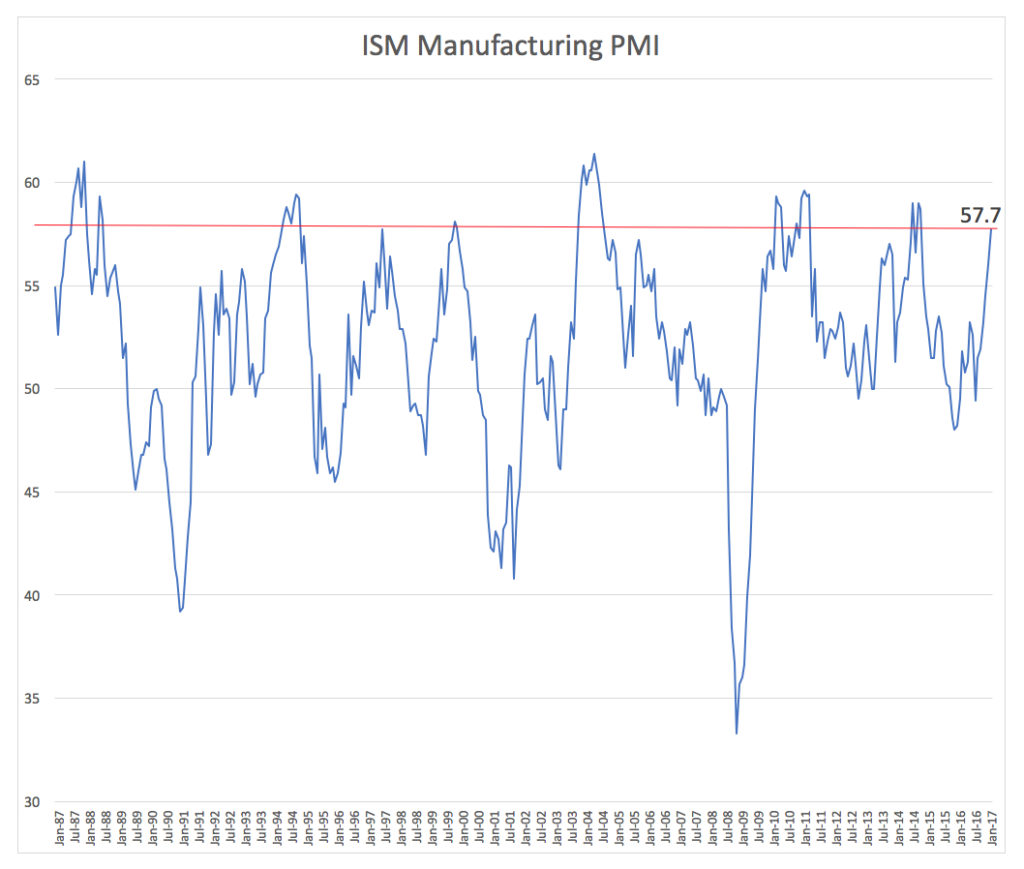
Finally, when it comes to the ISM Manufacturing PMI, if we look back at historical norms, this indicator is likely to start rolling over soon, which will really give the market’s reflation narrative a conniption fit!


