Category Archives: Context and Perspectives

Markets Stalling Despite Central Banks’ Support

Markets Stalling Despite Central Banks’ Support


The early equity market strength in 2019 has many on financial television claiming we are off to the races yet again (shock) but taking a step back and looking at both the internals of the markets and the longer-term economic and geopolitical trends, we see more signs of weakness and rising risks.

  • Sideways Equity Markets Persist as First Quarter GDP Growth Expectations Remain Poor and Yields Fall
  • Brexit Uncertainty Worse Today with Just Two Week Until Brexit Day (March 29th)
  • Further Signs of Both Domestic and Global Slowing
  • Labor Market Concerns
  • The Impact of Record Levels of Corporate Debt


Equity and Fixed Income Markets Diverge

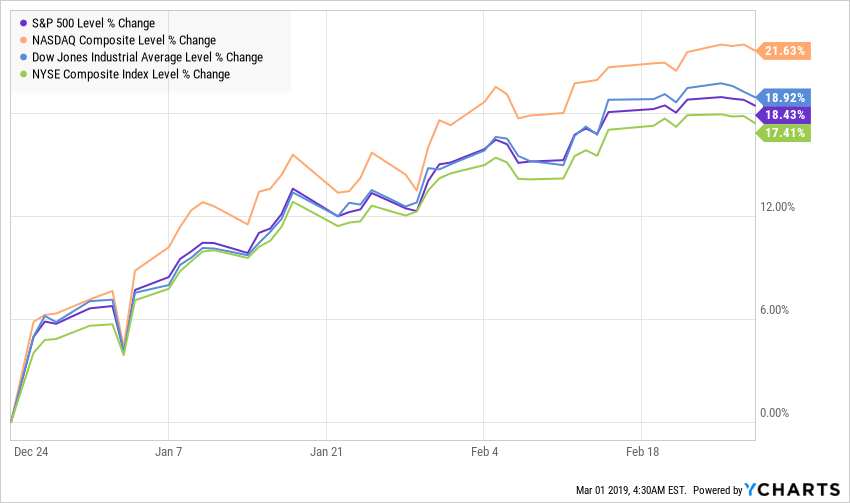
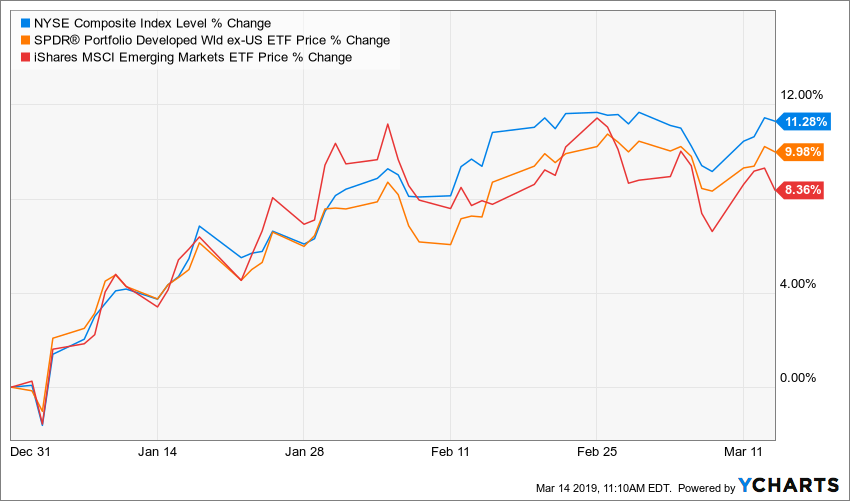
While the early part of 2019 the markets were going like gangbusters after the worst December in decades, the markets have been directionless in recent weeks.

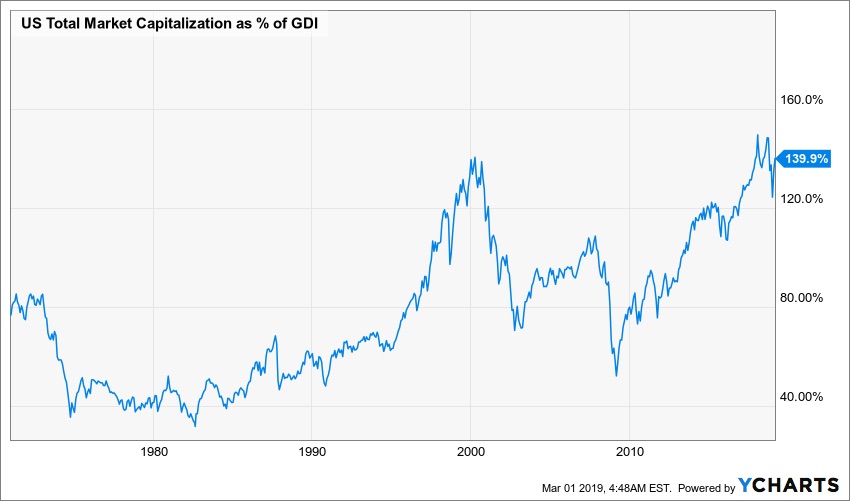
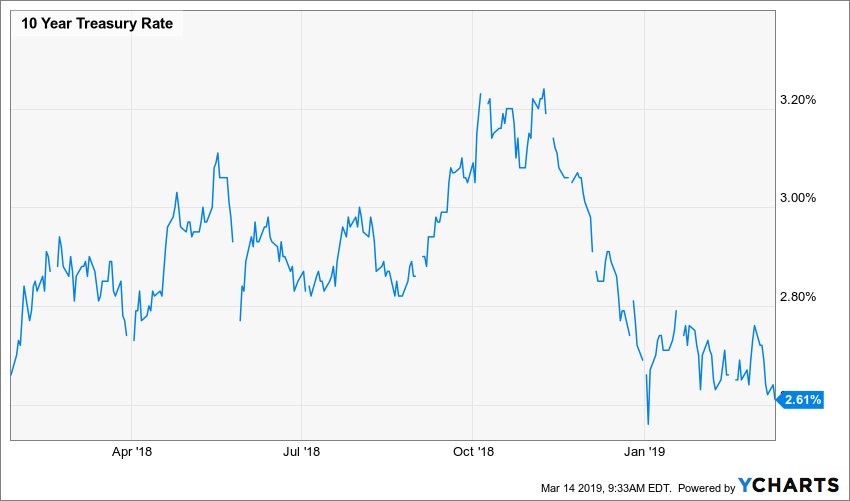
For all the talk of an ongoing bull market that the prior chart would support, the total return for the index is basically flat since late January 2018 – nearly 14 months of nada. Not quite so exciting for the long-term investor when you take a step back even though the ups and downs have offered traders short-term opportunities.

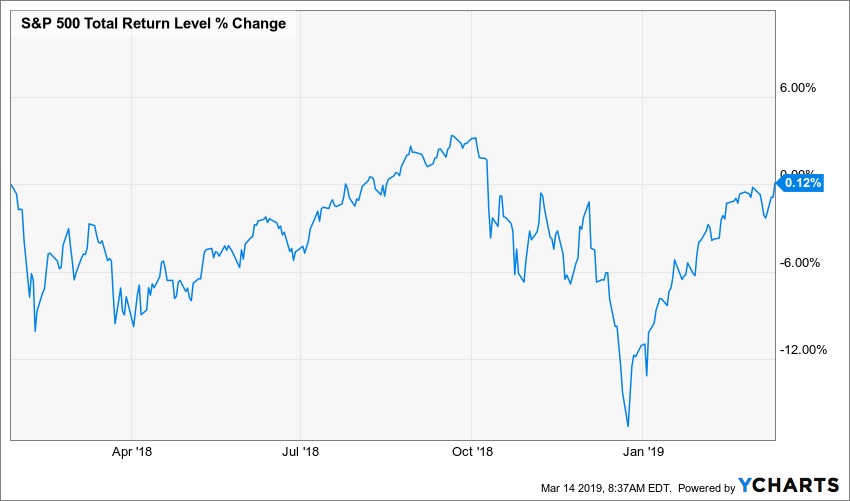
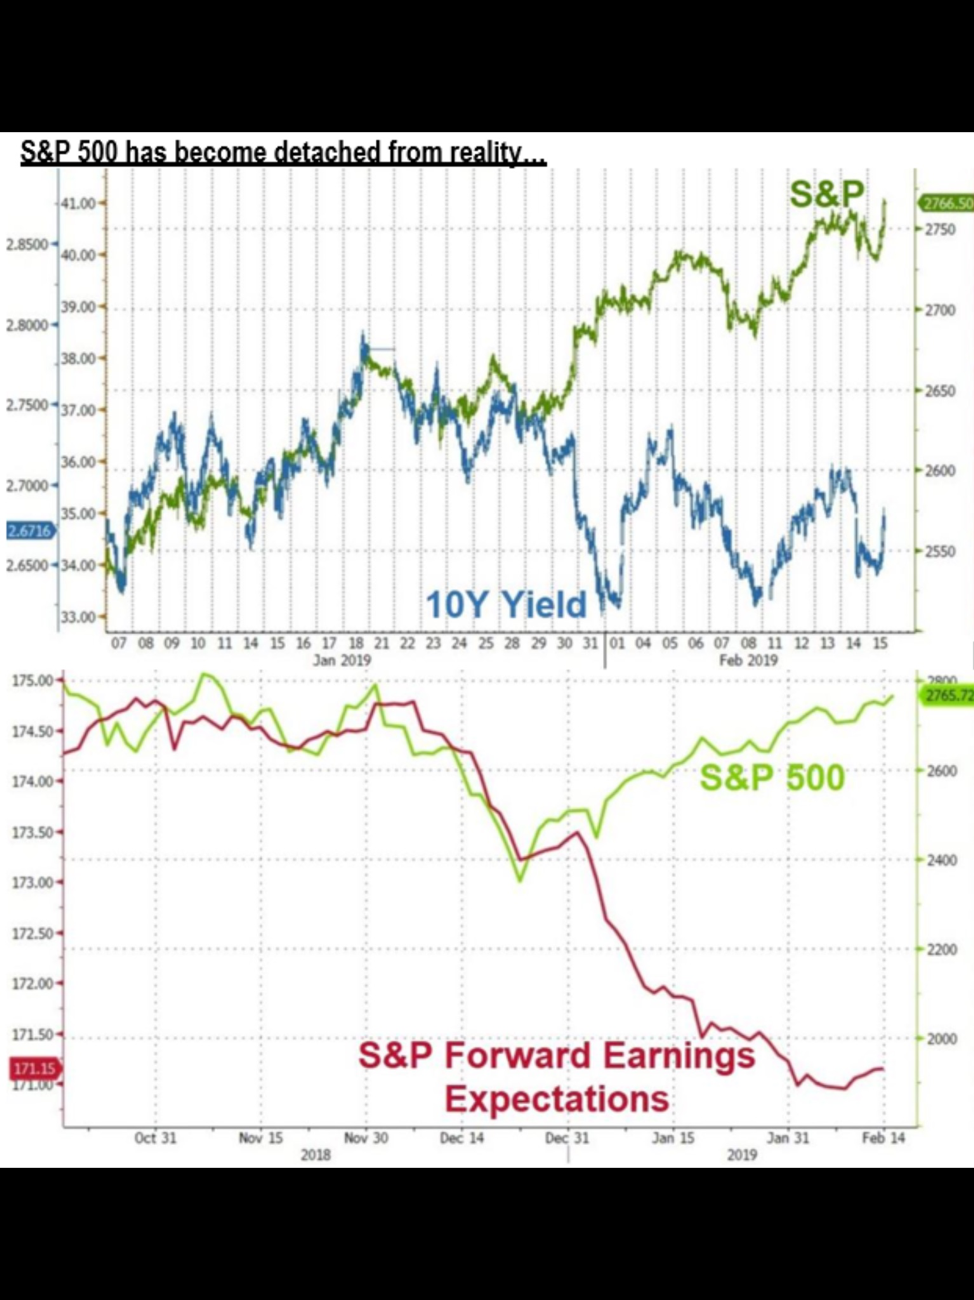
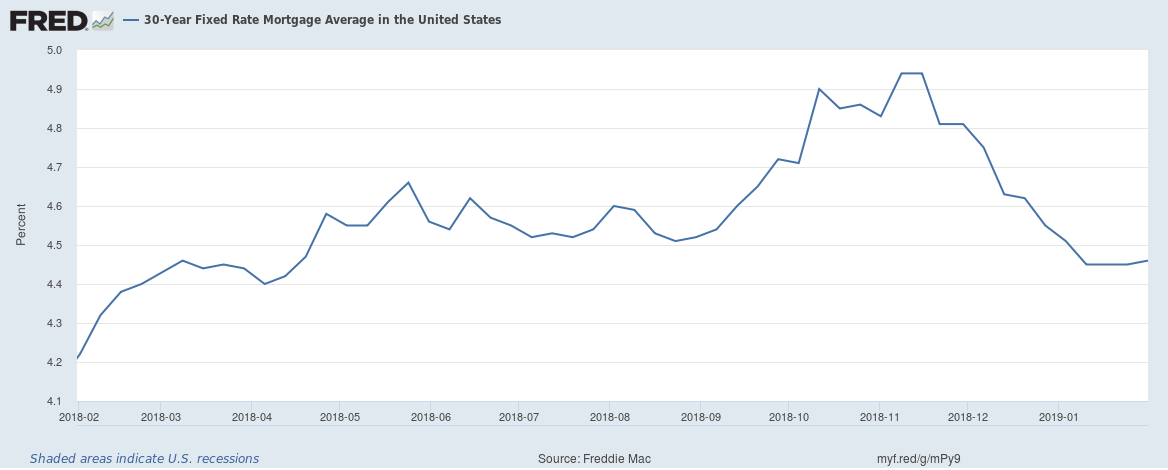
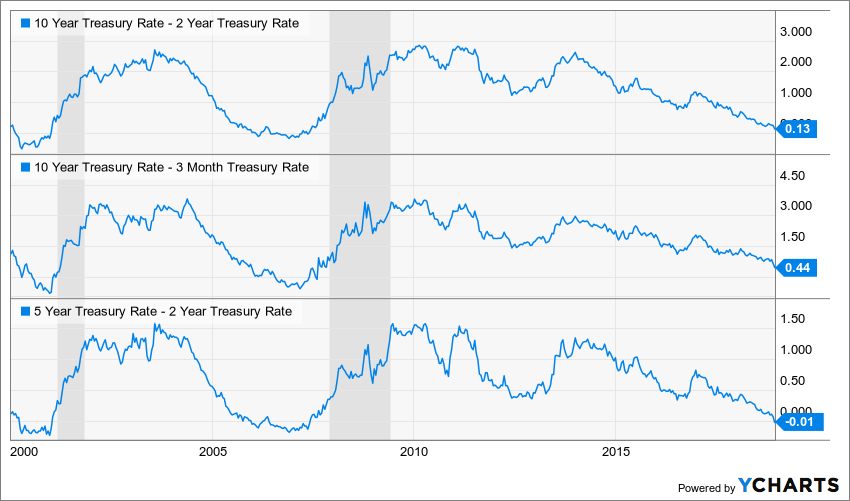
During that same time, the yield on the 10-year US Treasury has fallen, after having risen to over 3.2% last November. Today it sits a mere 10 basis points above the high end of the Federal Reserve’s target Fed Funds rate, which means the bond market is pricing in negligible economic growth. That’s a cue for the Atlanta Fed GDPNow forecast for the current quarter that clocks in at all of 0.4%, well below the 1.4% consensus tallied by The Wall Street Journal. The 10-year Treasury yield is near its 2019 low while the S&P 500 hits a 2019 high – that ought to have your attention.

The biggest driver for equity markets lately has been expectations around the Federal Reserve’s next steps and the push-pull on a US-China trade deal. Rather than being in the midst of a rate hike cycle, as was the case towards the end of last year, the Fed funds futures market is pricing in 25% odds of a rate cut by year’s end versus just 7% odds a month ago. A very different outlook compared to this time last year, and one that suggests the market is increasingly concerned about the speed of the economy and the rising risk of the next recession.

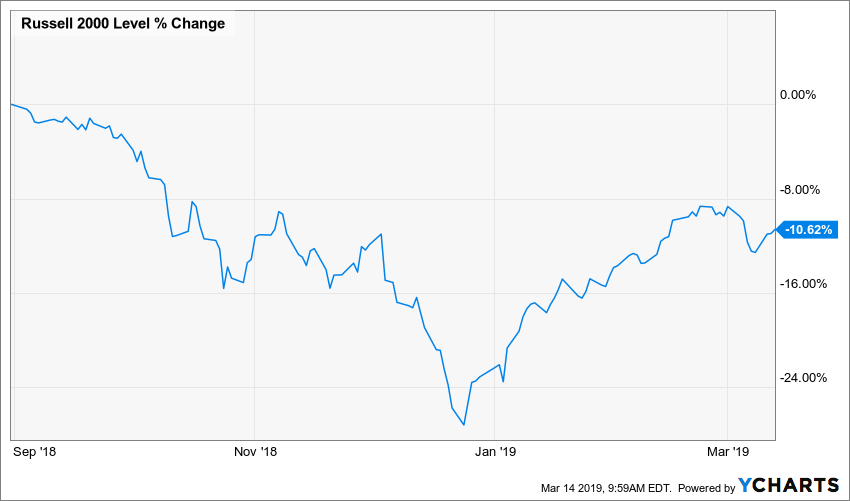
The Russell 2000, a small cap index, whose constituent’s revenues are more domestically driven than the S&P 500 also reflects the markets low expectations for economic growth as the index remains nearly 11% below its August 2018 high and sits about where it was at the end of November of 2017. The message here is don’t be lulled into a false sense of security given the near 15% increase in that index thus far in 2019.

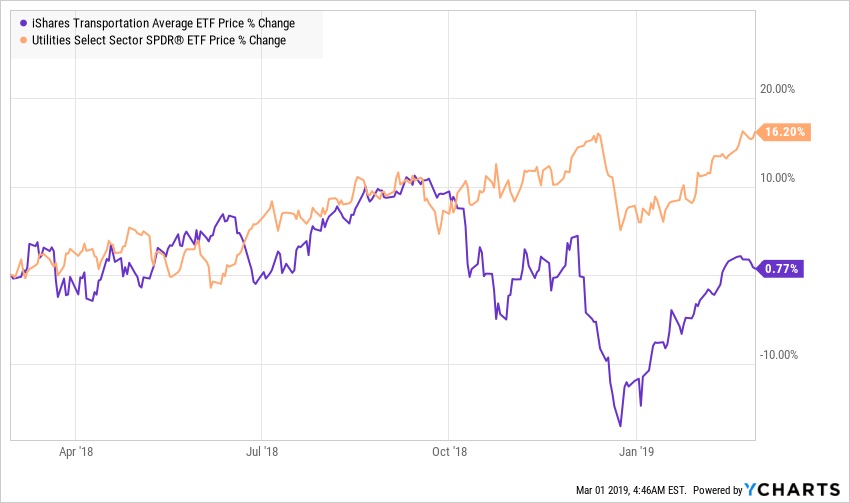
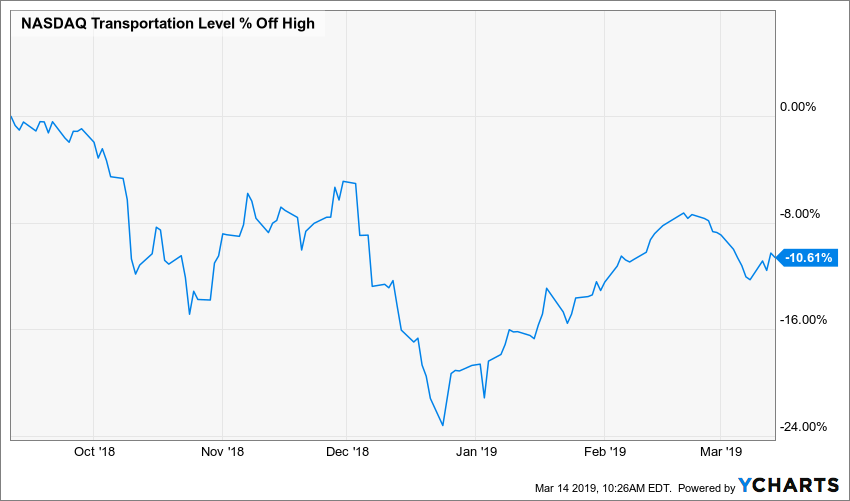
The Nasdaq Transportation Index paints a similar picture.


Bumbling Brexit

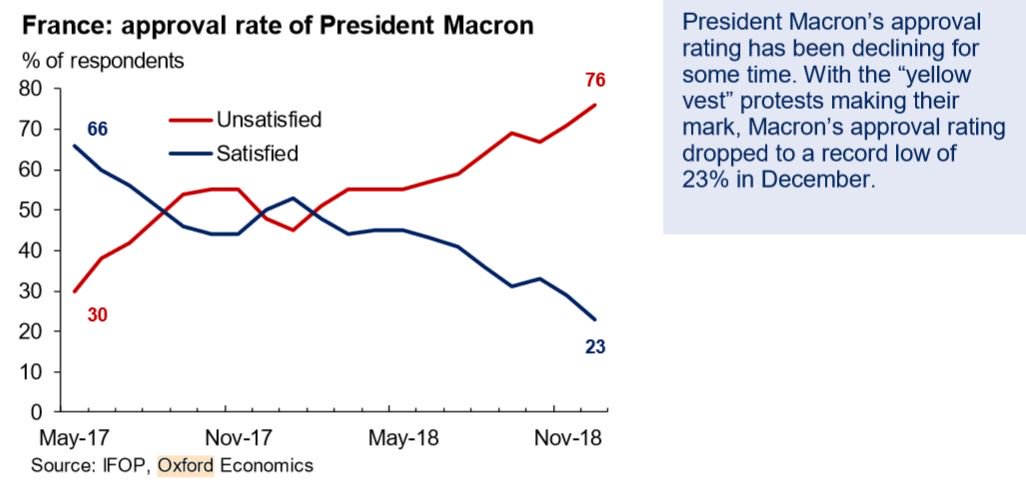
In this time of political polarization across much of the developed world, from riots in Paris to efforts to secede in Spain, I think there is one thing we can all agree upon – the UK’s Prime Minister Theresa May is having a bad year. Much of the developed world is facing a rise of populism, driven by the forces behind our Middle-Class Squeeze investment theme, as the countless promises political leaders have been making for decades are not being fulfilled and people, particularly those mounting financial pressures, are angry. In the UK that manifested itself in a desire for more autonomy with a side helping of anti-immigrant nationalism.

After Mrs. May suffered a record-breaking 230-margin rejection of her Brexit deal in January, she endured yet another defeat this week by a margin of 149 votes in the House of Commons. The uncertainty around Brexit has never been higher.

Confused by it all? You aren’t alone as I’m pretty sure many members of Parliament are as well! Here is the short(ish) version of what it all means.

The deal Mrs. May has worked out with the European Union has been utterly rejected and on March 13th Parliament voted that it will not exit the European Union without an agreement. So, they won’t agree to her deal – the only deal on the table – nor will they leave without some sort of deal. Eh? What this means is that now the UK has to go back to the EU leadership and ask for an extension to Article 50, the formal exit process which set the deadline for March 29.

EU leadership has indicated that they aren’t terribly excited about granting an extension if there is no clear reason to believe that an extension will actually be useful. If the same folks are just going to make the same arguments with the same non-negotiables, then what’s the point? Does your head hurt like mine?

Anything is possible now from a hard-Brexit in which the UK is forced to exit the EU under Article 50 without any deal because the EU won’t grant an extension to an extension that leads to a new referendum that results in the UK remaining in the EU.

The bottom line is that the market has absolutely no idea how to price in anything about this mess. Depending on what happens in the next few days, the markets could get suddenly quite volatile as we get closer to that deadline without any resolution.


Domestic and Global Slowing

Last week the European Central Bank cuts its guess estimate for 2019 GDP growth to 1.1% from 1.7% with ECB President Mario Draghi shifting towards easier monetary policy by reviving the “Targeted Longer-Term Refinancing Operations,” which is a lending program with favorable interest rates that props up the weak and weakening banking system  supports liquidity in the region. In a testament to his own genius, Draghi stated that negative rates “have been very successful for the ECB and were a powerful instrument in fostering a recovery.” For a discussion on just how destructive helpful this policy has been in the region, listen to this Tematica’s Cocktail Investing podcast late last year to hear boots on the ground stories of the havoc stimulus these policies provide.

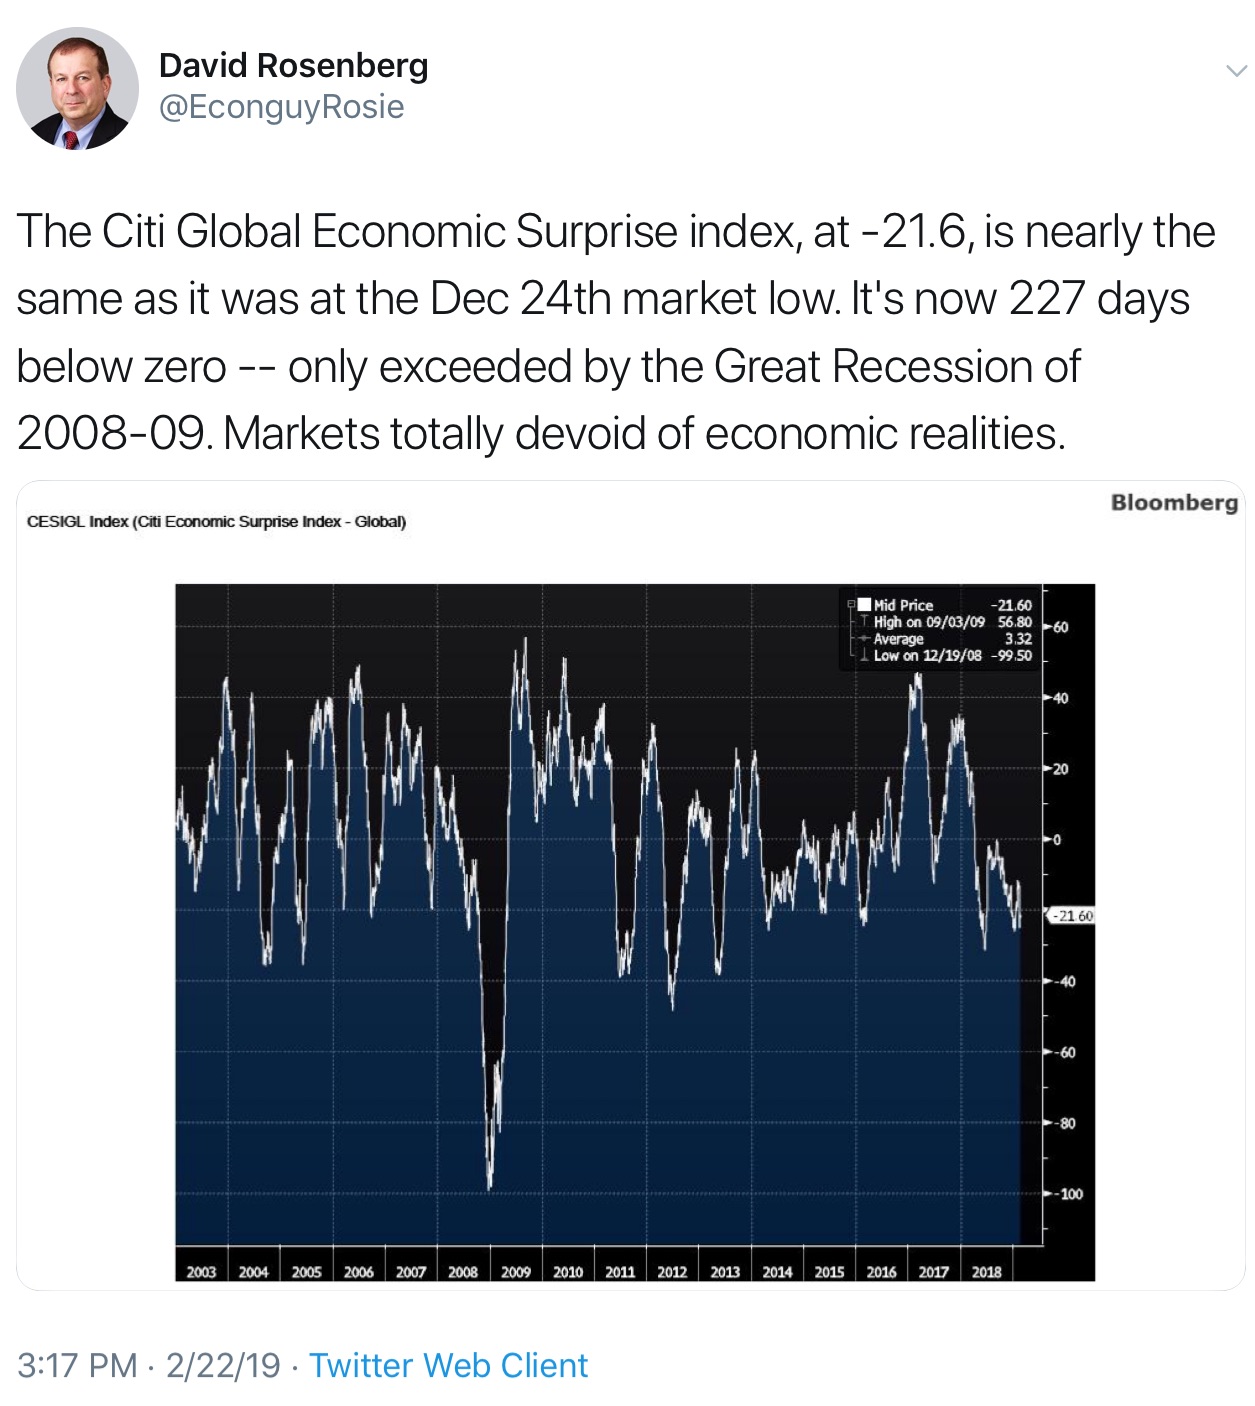
On the plus side, Eurozone Industrial Production surprised to the upside at 1.4% versus 1% with the Citibank Economic Surprise Index for the region showing signs of improvement after having been in negative territory for over two years with the exception of a brief foray above zero in the August/September period in 2018.

Forecasts for US growth in the first quarter from the Atlanta Fed have ranged from 0.2% to 0.5% during the month to sit at 0.4% as of March 13th. The range of estimates from the Blue Chip survey is between slightly over 2% to 0.7%.

The stalling out trade talks with China provide an additional headwind to a domestic economy that is already forced to contend with weakening global growth.

The utter mess of Brexit provides even more headwinds.

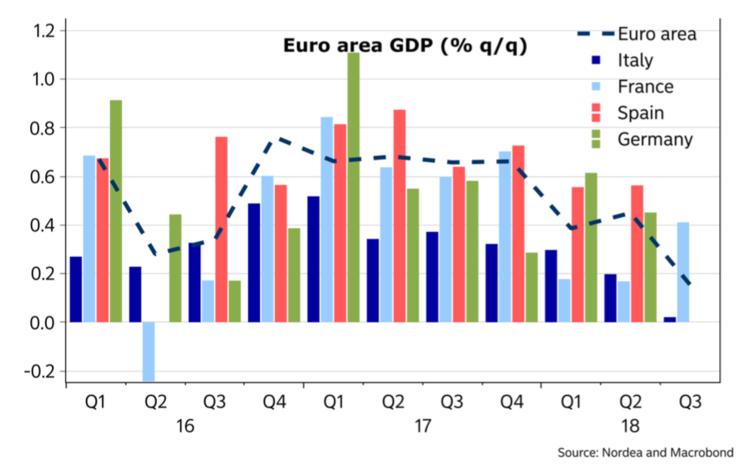
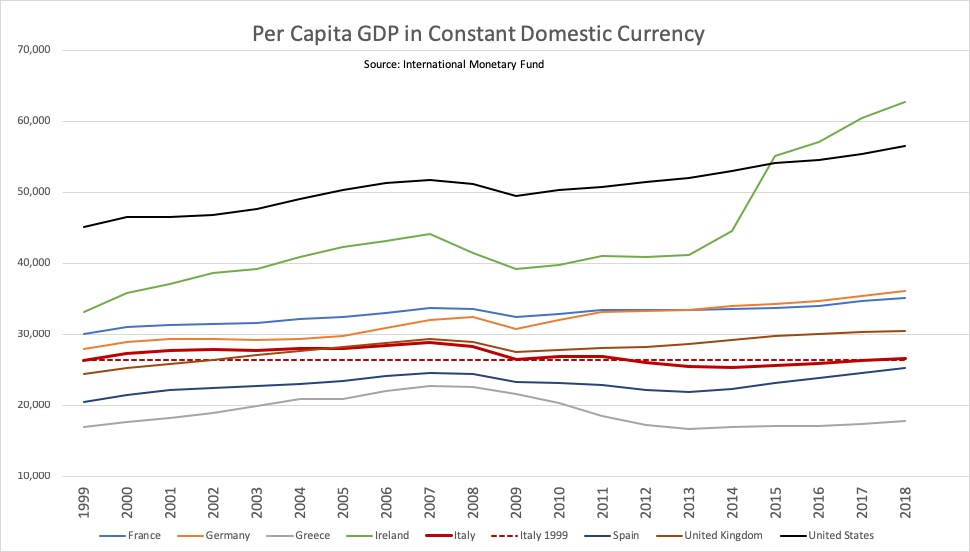
Taking a step back to look at the world’s major economies, if we look at the US, Canada, Brazil, Italy, Germany, the UK, France, India, China, and Japan, 9 out of those 10 were experiencing growth in the last quarter of 2018. The one exception being Italy. The problem is that growth was weaker than the prior year. The only country that saw acceleration was the US, and the tailwinds for that are fading.

A full 8 of the 10 experienced slower real year-over-year GDP last quarter and Italy is in official recession territory. In Canada final domestic demand has fallen for two consecutive quarters – the last time we saw this the Bank of Canada cut rates twice for the year.

How long can the US fight off the slowing of the rest of the world?


Labor Market – Should We Worry?

Payroll reports in February reverse the January contradiction which we discussed in this prior issue of Context and Perspectives. In January the Payroll report was quite strong while the Household Survey was weak – for February the two reversed rolls and we saw some obvious impacts from weather and the end of the government shutdown. Taking a step back we get a broader, longer-term picture of the two. Of the 255k added to the Household survey payrolls in January, 90% held just a high-school education. In February that 255k gain reversed to a 251k loss. On a bright note, those working part-time for economic reasons fell 837k, the single biggest decline in that metric since January 1994 – great! But then on the downside, the 25-54 years-old cohort has seen its payroll ranks decline by 52k in the past four months – not so great.

While the February headline payroll number saw just a gain of 20k versus expectations for 180k – the weakest gain since September 2017 – January’s numbers were revised up from 304k to 311k and December’s were also revised up from 222k to 227k. Those are solid numbers. But then (you knew this was coming, right?) aggregate hours worked decline -0.3% in February to the lowest level in 3 months. Rising hours worked indicate future payroll growth while falling hours, not so much.

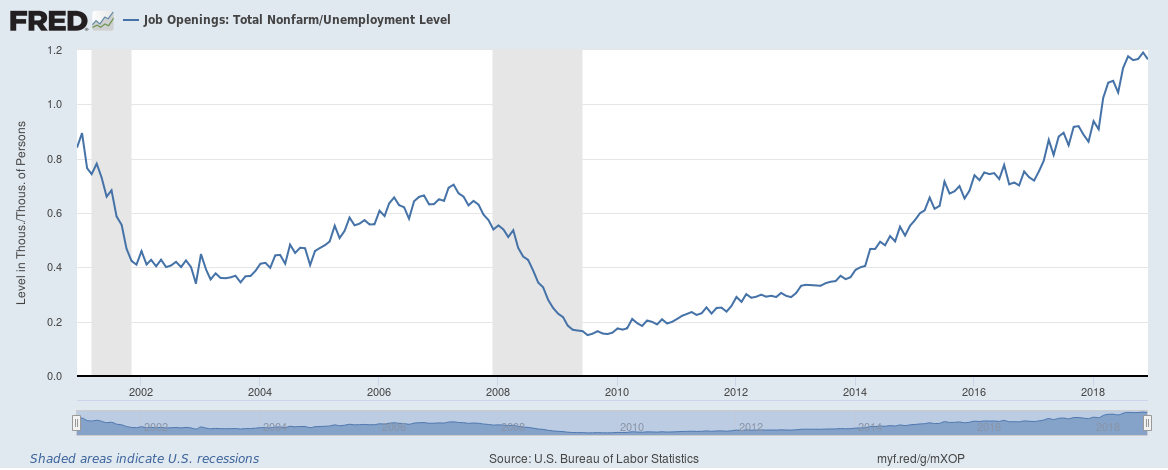
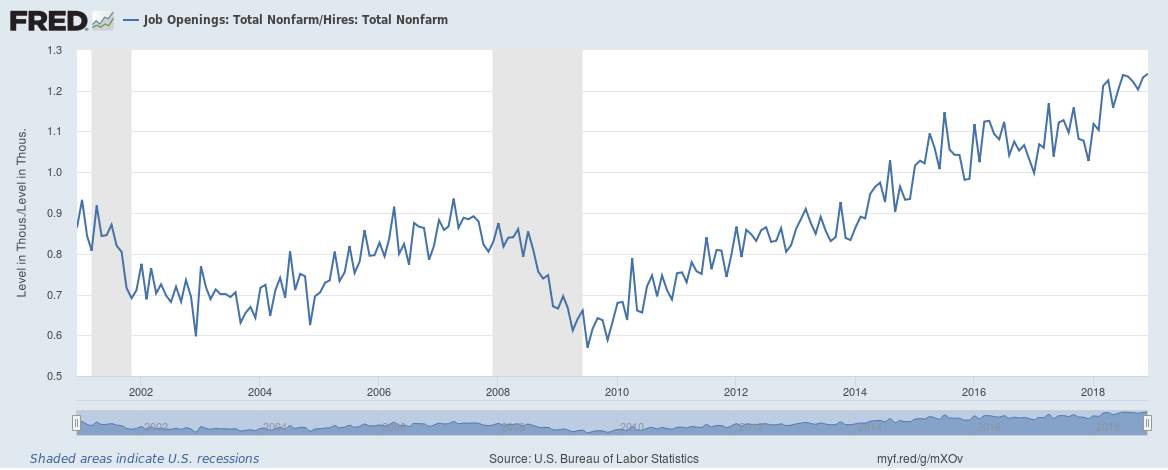
Overall the labor market looks like growth has been or is topping out. Employers are feeling the pressure, which isn’t necessarily a good thing for households as Jonathan Pain points out on Twitter.
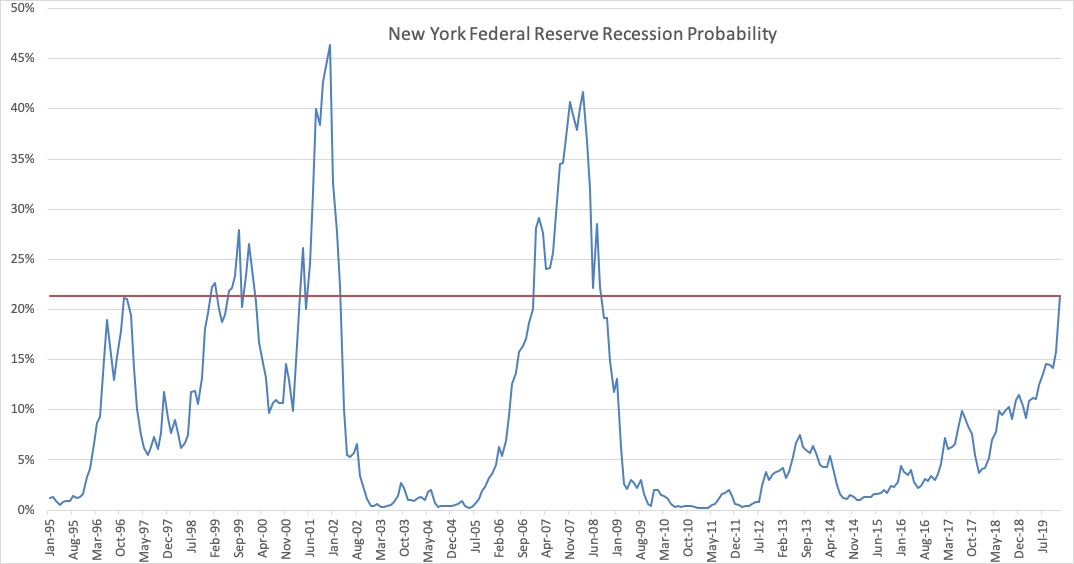
Corporate Margins Under Pressure

Wage growth in February hit 3.4% year-over-year in February, which means pressure on corporate margins, but that isn’t the only thing pressuring margins. A recent OECD report revealed that over $4 trillion in non-financial corporate debt will be rolling over in the next three years out of the total $13 trillion outstanding (31%). Net issuance of non-financial corporate debt fell to the lowest volume since 20008 and the net issuance of non-investment grade turned negative in 2018. The only other time this has happened in the past 20 years was in 2000. The overall share of BBB rated bonds has reached 54%, the highest ever on record going back to 1980.

So, what does that all mean? That at a point of slowing global growth, companies are facing higher labor costs and are having to roll over some 31% of total outstanding debt in the next few years at higher rates – further pressuring margins.


The Bottom Line – Details Matter

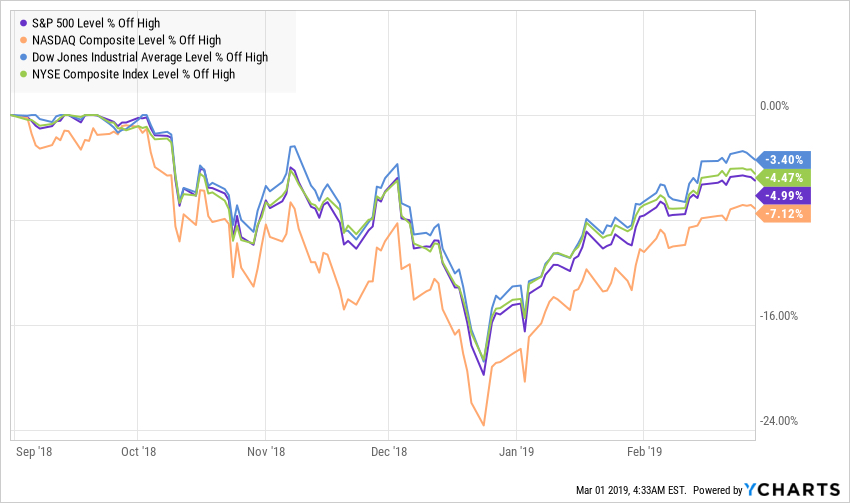
The bottom line is the prevailing narrative is that the recent “soft patch” of economic data is temporary and that what really matters to the economy and the markets is the Federal Reserve. While the S&P 500 has pushed through 2,800 again (just barely) the first time it did so in early 2018 one quarter of the stocks in the index were making new 52-week highs. Today less than 9% are in that territory. Back then the average S&P 500 stock was 5% below its high. Today it is 14% below.

Not convinced? Last week’s Fed Beige Book reported that Broadway ticket prices, one of the most reliable leading indicators, “were down 5-6 percent from a year earlier.” The last time a drop of this magnitude happened was December 2007 when “Average ticket prices for Broadway shows rose less than usual this past December and were down more than 5 percent from a year earlier.”

Still thinking this is a temporary patch of weakness? How about the Federal Reserve’s Lael Brainard speech on March 7th which she concluded with, “The most likely path for the economy appears to have softened against a backdrop of greater downside risks.”

To paraphrase Eric Clapton, not even Lael will ease my worried mind.

Boeing’s 737-Max issues highlight index construction issues

Boeing’s 737-Max issues highlight index construction issues

The latest flight tragedy involving Boeing’s (BA) 737-8 Max plane has reignited air travel safety concerns that could pressure Boeing’s business in the near-term. Demand for its aircraft has been and is expected to continue to be powered by international air travel, particularly out of Asia, which fits very well with our Rise of the New Middle-class investing theme. This means the recent drop in BA shares could present an opportunity for investors but depending on what we learn in the coming days we could see the shares trend lower. The issue plaguing the company and its shares is the crash of two 737-8 MAX planes in a relatively short time causing several countries and regions to ground those planes as the causes of the most recent crash are sought.

This has raised several questions for Boeing – How long will those planes be grounded? What does it mean for future 737 family orders and production levels that drive revenue, profits and earnings? The 737 family is an important one for Boeing, as it accounted for 80% of its aircraft backlog entering 2019 and 58% of its January order book. In the past Boeing has quickly dealt with situations such as these, and it has already announced an extensive change to the flight-control system in the 737 MAX aircraft.

Still, we are in a period of uncertainty for the shares, and uncertainty has never been a friend for the stock market or individual stocks. Now to see what comes next.

On a different note, the Boeing issue highlights a key difference in how the major market indices are constructed. These tend to be bench marks by which we and others judge their performance, but there are several differences and intricacies between them. For example, we know the Dow Jones Industrial Average is limited to just 30 stocks, while the S&P 500 is roughly 500 stocks spread across 11 sectors, yielding a more broad based view of the market. For that reason, the S&P 500 tends to be the benchmark of choice for most investors even though the media still tends to focus on the Down.

No matter how many constituents an index has, who the constituents are, and their weightings make all the difference. As we know, the Nasdaq Composite Index tends to be weighted toward technology stocks, while the Russell 2000 is focused on stocks with smaller market capitalizations. Inside the Dow, the weighting of BA shares is just under 10%, which makes it the largest holding inside the index. The next closest constituent is UnitedHealth Group (UNH) at 6.52%. This means moves higher or lower in Boeing shares can have a pronounced impact on the overall index. We’ve clearly seen that over the last few days as Boeing’s shares have fallen more than 10%  the Dow’s performance has been markedly different than the rest of the market indices as the Dow has less than 1% while the S&P 500 has risen nearly 2.5%

In examining the S&P 500, we see the reason for that different performance. While nearly 10% of the Dow is represented by Boeing shares, exposure inside the S&P 500 is far more limited at 0.9%. Even though that is more than 1/500thof the S&P it is far, far lower than the weighting contained inside the Dow. The point of this is that to truly understand the movements in the major market indices one needs to understand how these market indices are constructed.

One of the key parts of that understanding is knowing what the holdings and their weightings. This same understanding should also be applied to ETFs as well, especially ones that are based on passive indices. While two ETFs may appear to have a similar strategy and practically the same constituents, the weighting mechanisms between an equal weighted, market cap weighted or a capped market weight approach can produce different returns as well as generate different risk parameters.

As far as the constituents themselves, it goes without saying an investor should be more familiar with the constituents. In the case of Boeing, there are a number of ETFs that hold the shares, but one with sizable exposure is the ETFMG Drone Economy Strategy ETF (IFLY). That ETF, which looks to invest in drones, holds 4.96% of its assets in BA shares, it’s second largest holding. That ETF, which looks to invest in drones, holds 4.96% of its assets in BA shares, even though its revenues from drones and other autonomous systems are so small they aren’t even broken out by the company in SEC filings. We can debate the rationale behind Boeing being the second largest holding, but until the current situation at Boeing is resolved, odds are those shares will have a meaningful impact on both the Dow and IFLY shares.

Liquidity Trumps Fundamentals

Liquidity Trumps Fundamentals


The market has been back in risk-on mode but with some strange internals as well as an ongoing disconnect with fundamentals. It has priced in a joyous cornucopia of Goldilocks assumptions:

  • A return to global central bank liquidity and price supports
  • A reversal of China’s deleveraging campaign with an abundance of stimulus measures
  • A peaceful and prosperous end to global trade wars
  • An elegant resolution to Brexit
  • Never mind India and Pakistan


The Party is Back On, But the Music Sounds Off

Heading into the last month of the quarter, let’s review what we’ve seen over the past few months. Just over 50 days ago the Nasdaq was in a bear market, but in the past two months it has shot up over 21% to sit about 7% below the September high and is currently above both its 50-day and 200-day moving averages which is typically viewed as being in a solid uptrend. As of the US market’s close on Thursday the Dow Jones Industrial Average was up nearly 19% from the December low (3.4% below its high), the S&P 500 up nearly 19% (5.0% below its high) and the broader NYSE Composite Index up just under 18% (4.5% below its high).

All the major indices remain below their Fall 2018 highs but are within range. However, upward momentum has stalled recently with the majority of the major US indices relatively flat or down since last Friday. This looks to be the fourth failed attempt by the S&P 500 to break 2,800 in the past four months indicating a significant overhead resistance level.

As we can observe in the chart above, the domestic stock market indices experienced the worst December since 1931 followed by the best January since 1987, leaving many with a general sense of unease. Let me be clear, these moves are not indicative of market normalcy. Something is very different, and it doesn’t feel quite right to me or to Tematica’ Chief Investment Officer Chris Versace. For example, it doesn’t feel like a normal bull market when Utilities have outperformed transports over the past year by over 15%. It doesn’t feel like a normal market when a growing number of companies are slashing their dividends while share prices continue to move upwards.

Then there is the disconnect with earnings and yields. As of the end of last week, 89% of companies in the S&P 500 had reported results for the December quarter with 69% reporting EPS above estimates, below the 5-year average. Analyst expectations for 2019 are for a decline in first quarter earnings of -2.7% with a meager 0.7% increase in the second quarter and just 2.2% growth in the third. For 2019 in full, the S&P 500 group of companies are now only expected to grow their collective EPS by 4.7%, more than 50% below forecasted levels at the start of the December quarter, yet share prices are rising.

We’ll also just have to ignore that the Citi Global Economic Surprise Index is right around where it was at the December market lows and has now been below zero for over 230 days, a record exceeded only during the financial crisis. The nominal manufacturing and non-manufacturing ISM has declined for the past 3 consecutive months and sits 13% below where it was when the 2008 recession began and is 19% below the 2000 recession.

In the battle between fundamentals and central bank liquidity so far, the bankers are winning big.

While this last one is certainly utterly useless as far an indicator of when a market may turn, it does put the current state of the stock market into perspective. The last time the market was in such heady territory the overall, (in the dotcom mania of 1999-2000) returns for the stock market for the following decade were quite grim with positive returns more dependent on specific asset selection than overall market bullishness – one of the reasons we are so focused on powerful long-term investment themes driven by structural changes.

The stock market rally thus far in 2019 hasn’t been just in the US as European stocks are enjoying their best start to a year since 2015, despite slowing economies and the mess of Brexit. The Stoxx Europe 600 has gained over 10% so far this year, gaining nearly as much as the S&P 500. We’ll also just have to ignore that Europe’s largest bank, HSBC, reported results earlier this month that missed analysts’ expectations with the bank’s CEO stating that revenues “collapsed” at the end of the year. There I go again with fundamentals!


Taking a Dip Back in that Central Bank Pool

While the markets have cheered the Fed’s cessation of its rate hike plans, it is worth keeping in mind that the US Federal Reserve has never stopped tightening with a funds rate this low. More than 10 years after the depths of the financial crisis and the economy cannot withstand getting near normal interest rates.

“And so, you know, when I think about the projection, I’m projecting 2 percent growth right now for 2019. That’s a number that is quite a bit slower than last year, which looks like – you know, barring any big surprises in the fourth quarter looks to come in around 3 percent. So that would be a percentage point difference in last year and 2019. That’s a pretty substantial slowdown…..If the economy evolves as I just said I expect it to – 2% growth, 1.9 % inflation, no sense that it’s going up, no sense that we have any acceleration – then I think the case for rate increases is not there. “

– Mary Daly, head of San Francisco Fed in WSJ interview


The markets are embracing the Fed’s far more dovish view on rate hikes that is driven by the Fed’s concern the US economy will return to its significantly weaker growth rate. That doesn’t sound like a great reason to break out the bubbly. We will be watching for signs that the better-than-expected fourth quarter GDP growth of 2.6% gives the Fed reason to believe higher rates are possible knowing that they’d like to get rates up higher to have more arrows in the quiver for the inevitable downturn. Given the data of late, however, the odds at least in the near-term for an additional rate hike seem rather low.

One of the major challenges facing the Fed when it comes to raising rates is part of our Aging of the Population investing theme – the reality that Social Security is expected to run out of money in 12 years, according to the Congressional Budget Office. The problem with raising rates is that the US is running exceptionally large fiscal deficits. Higher rates mean more of the budget goes to interest expense, bringing the problems with Social Security even more quickly.

Central banks around the world continue to feel the need to support asset prices after one of the longest bull markets in history and one of the longest periods in history without a recession, (in part because of the rampant levels of deficit spending and unfunded payables to their nation’s retirees). Call me crazy, but that doesn’t sound fundamentally bullish.

“There might be scope for another TLTRO.”

– European Central Bank Board member (and one of Mario Draghi’s possible successors when the latter’s term runs out on October 31) when discussing the idea of issuing new multi-year cheap loans to banks when the current Targeted Long-Term Refinancing Operation (TLTRO) nears its repayment date in 2020.

Once again investors have been taught that dips are a buying opportunity and implementing portfolio protection can go very wrong. Investors have been getting this lesson pounded into them for over 10 years now with many in the markets never having experienced a sustained market downturn. That is worrisome if you believe at all in reversion to the mean. Equity price growth has grossly outpaced economic growth – how long can that last? In today’s market to not participate is to seriously risk missing out, but just when do we pay the piper and are enough market participants paying attention to the rising risks?

While investors are keeping their eyes on the markets, our Middle-Class Squeeze investment theme continues to illustrate that all is not rosy for many as is evidenced by the rising populism around the world.


China’s Policy Shifts into Reverse

Last year China was working to deleverage its highly leveraged economy, just how highly leveraged is up for debate as its leadership isn’t exactly keen on transparency. China’s leadership is eternally under pressure to keep economic growth robust, making the nation one of the participants in our New Global Middle-Class investment themes.

The deleveraging efforts, the trade war with the US and the overall slowing global economy led to China’s economy growing at the slowest pace in nearly 30 years in 2018. China’s February manufacturing PMI fell to its weakest level since early 2016 and was the third consecutive month of contraction. Export orders are now slowing at the fastest pace since the global financial crisis and imports PMI is at the lowest level in over a decade.

With all that weakness China has reversed course on its deleveraging, but not everyone is on board with efforts that led to record lending of $530 billion in new loans in January alone. We saw a rare public row between the central bank and Premier Li Keqiang with the former stating clearly that it will continue efforts to deleverage while the latter argued that a sharp rise in rates creates new potential risks.

Both China and the US, the two largest economies in the world, have witnessed public rows between national leaders and central banks concerning risks around leverage and economic weakness.

The markets are unsurprisingly placing their bets with rising liquidity as Chinese stocks enjoyed their best day since 2015 earlier this week. The biggest concern regarding financial stability and future economic growth potential is China’s ballooning debt. Its official corporate debt level is among the highest in the world and its public debt is equally astounding.

But then who cares about debt these days…


Trade Wars Running Hot and Cold

On the China trade front, things are looking better as this week US Trade Representative Robert Lighthizer stated that the US is (at least for now) shelving its threat to raise tariffs to 25% on $200 billion of Chinese good. President Trump’s willingness to walk out on talks with North Korea’s Kim Jung Un this week may have been a signal to China that he could also walk out on President Xi if he doesn’t get what he wants. I wouldn’t want to place too many bets on this one working out smoothly from this point onwards. And let’s remember that should we get a trade deal in the coming days or weeks, investors will need to look past the headlines and dig into the details of the agreement to ascertain its true impact.

While the upcoming talks between the US and China are getting most of the headlines, as the Wall Street Journal put it, “America car buyers are facing sticker shock as President Trump weights new tariffs on imported vehicles and auto parts.” Even buyers of domestically produced cars would be affected as between 40% and 50% of the average US-built car uses imported components, according to the Center for Automotive Research. Potentially a second shoe to drop for auto companies following the data concerning falling auto loan demand that I shared just a few weeks ago.

The reality is that thousands and thousands of companies in Europe alone have been bracing themselves, (which means for many cost-cutting programs) for the ongoing impacts of the US-China trade war, fallout from rising populism in the Eu and the mind-boggling mess that Brexit has become. In Germany, long the economic engine of the EU, the government expected GDP growth to slow to just 1% in 2019.


Brexit A Mess of Historical Proportions

When it comes to Brexit, the mess just keeps growing. Long, long, long story short, essentially the divorce technically has a hard and fast move-out date at the end of March yet there has been no agreement on the terms of the divorce. There is talk of another referendum which could possibly reverse the 2016 vote, but that would be so very un-British to go back on a decision like that and Prime Minister Theresa May has said this is a no-go for her. This mess has left companies from the tiny local grocer to the major multi-national without any guidance on how their businesses will be affected in just one month’s time. The impact has the potential to be brutal with estimates that the UK’s economy, with a hard exit, could contract on the order of nearly 10%. This is something without any precedent in modern global politics and is a serious headwind to growth in the region. Perhaps the Brits will be wooed back into the European Union by the Breunion Boys – do yourself a favor and click on that link, you’ll thank me.

While we are on the topic of messes in Europe, an aspect of our Safety and Security investing theme is on display as Facebook (FB) faces yet another privacy investigation, this time 10 investigations lead by Ireland’s privacy regulator concerning potential violations of European Union privacy law.


India and Pakistan Ignite

A tailwind for our Safety and Security investing theme is rising global tensions as economies around the world struggle to maintain growth rates necessary to keep their populations feeling good about the future. When people have little hope for a better economic future, violence tends to follow whether it be against a neighboring nation or other members of their own society.

The US this week urged India and Pakistan to refrain from further military action as international pressure is building to de-escalate the most serious flare-up between the long-standing rivals in decades with fighter jets from both nations being shot down. We have not had such tit-for-tat air strikes between the two nations since 1971. We’ll continue to watch this potential powder keg of a situation, which if it escalates further it could very well move to the forefront of investor concerns.


The Bottom Line

Equity markets have once again diverged materially from fundamentals as the perception of the central bank put from the world’s biggest economies overrides fundamentals. I’ve been admittedly surprised by how long this has been going on and how wide the divergence has become, but we are seeing now seeing substantial overhead resistance level for the S&P 500 at a time when challenging fundamentals are growing.


Signs of Slowing Economy Continue to Mount

Signs of Slowing Economy Continue to Mount


The market is now back in a bullish mood that is driven primarily by the “not gonna happen” news flow hopes. Rate hike? Not gonna happen. Government shutdown repeat? Not gonna happen. China trade war escalation? Not gonna happen. The question is, just how long can the “not gonna happen” hopes keep pumping hot air into a market when we are staring down a likely earnings recession amidst a global economic slowdown?

  • Housing remains a miserable mess – just look on Zillow at the breadth of the price reductions.
  • The employment picture isn’t quite what the headlines would lead one to believe.
  • Consumer confidence looks to have peaked and is falling.
  • Consumer credit trends and retail sales are flashing warning signals.
  • Corporate earnings and loan demand are also flashing warning signs as are shipping rates.
  • Geopolitical risks are profuse and profound ranging from no-deal Brexit fallout to Italy’s ongoing battles in the EU to US-China trade relations to rising military tensions between the US and Russia to relations between Italy and France at lows not seen since WWII.
  • The level of bullish sentiment is no longer a contrarian positive with the AAII poll of individual investors putting the bull camp at 40% versus 32% last week and the highest level in the past three months. Bears are down to an 8-month low of 23% versus 50% back in December. Even the CNN Money Fear & Greed index is back in greed mode after hitting fear one month ago.

Housing Headwind

More than 12 years after the US housing market started an epic crash in 2007, an unprecedented number of homes are still underwater (meaning the outstanding mortgage on the home is at least 25% above the home’s current market value), according to a real-estate market report from ATTOM Data Solutions. This is clearly a consumer headwind that is part of our Middle-Class Squeeze investment theme. The states with the highest share of mortgages include Louisiana (21%), Mississippi (17%), Arkansas (16%) and Iowa (15%). Of the over 7,500 zip codes having a minimum of 2,500 properties examined in the report, 27 had more than half of all properties underwater including zip codes in cities such as Chicago, Cleveland, Trenton, Memphis, Saint Louis, Virginia Beach and Detroit. If you’re a real estate investor, you should be taking note and as is often said with stocks, you should be building your shopping list.


Job Picture Not So Rosy

This week we received the Job Openings and Labor Turnover Summary for December from the Bureau of Labor Statistics (BLS) which revealed a record high 7.335 million job openings. The unemployment rate has risen from the November low of 3.7% to 3.9% in December and 4.0% in January – possibly indicating that we are now on an uptrend. There are now 1.17 job openings for every job seeker, with December slightly below November’s all-time record high of 1.19 job openings.

We are also seeing a record high length of time to hire someone, which is derived by taking the number of job openings and dividing it by the number of hires. Prior to the financial crisis, this metric was always less than one month, but in August 2014 it broke above a month for the first time in recorded history and has been rising ever since then to a new high in December of 1.24 months. We see this as confirming that employers are having an increasingly difficult time finding the right talent for the position.

This would make one think that the consumer is doing great, but as always, digging below the surface reveals a different picture. At the start of February, the January Payroll report got a lot of attention as job growth utterly blew away estimates, coming in at 304,000 new jobs versus expectations for just 170,000. However, the other employment survey from the Bureau of Labor Statistics (BLS), the Household Survey, rather than providing confirming view of the labor market revealed a very different picture, click here to read about how the two differ in the data they track.

The Household Survey found that employment dropped 251,000 in January, the first such decline in five months, some of which can be attributed to the government shutdown. But employment for the prime working-age population declined 46,000 in January after an 11,000 drop in December and 48,000 in November – more of that Middle-Class Squeeze investment theme at work.

The last time we saw employment in this demographic decline for three consecutive months was in October 2009. The number of full-time jobs declined 76,000 while the number of people working part-time for economic reasons rose 10.5% to 5.145 million which is a 16-month high. The number who are working part-time because of “slack work business conditions” rose a whopping 19.4% to 3.45 million which is a 23-month high. For both metrics this was the biggest one-month change since September of 2001 – a month no one can forget – and before that February 1982, both times the economy was in a recession. The Household Survey also revealed that the largest category of hiring was for those with a high-school education or less, which may explain why average hourly earnings rose the smallest amount since October 2017 at just 0.1%.


Consumer Credit Warning Signs

The latest Senior Loan Office Survey found that demand for auto loans, credit card loans, GSE-eligible mortgage loans, qualified jumbo mortgage loans, non-qualified mortgage jumbo loans, non-qualified mortgage non-jumbo mortgage loans, government mortgage loans, and consumer loans ex-credit card and ex-auto all are in contraction mode. In a nutshell – folks are not interested in borrowing any more than they already have. That is not what we typically see during economic expansion. We are also seeing a record high 7 million Americans are 90-days or more behind on their auto loan payments – yet more Middle-Class Squeeze.


Consumer Confidence Falling

With the job market not quite as rosy as the headlines would suggest coupled with the trends in consumer credit, it wasn’t a big surprise to see the Conference Board’s Consumer Confidence index fall to an 18-month low in January, dropping to 120.2 from 126.6 in December versus expectations for 124.0. The January reading also marked the third consecutive decline after hitting an 18-year high of 137.8 in October. Gluskin Sheff’s David Rosenberg summed up the results quite succinctly in his tweet.

Retail Sales Take Biggest Hit Since 2009

US Retail sales saw the biggest one-month drop in December since September 2009 with even ecommerce sales suffering as retail sales fell -1.3% month-over-month and up just 2.1% year-over-year. Retail sales ex-gasoline stations fell -0.9% in December and even the typically strong non-store retailers, which includes mail-order and ecommerce as are part of our Digital Lifestyle investment theme, saw sales decline -3.9%. However online players such as Amazon (AMZN) – a Tematica Research all-star – and eBay (EBAY) still enjoyed strong sales gains through the holiday season.

That’s the sequential comparison. On a year over year basis, retail sales in December 2018 rose 2.1% year over year with stronger gains registered at Clothing & Clothing Accessories Stores (+4.7%), Food Services & Drinking Places (+4.0%), Nonstore retailers (+3.7%) and Auto & other motor vehicles (+3.4%). That’s not to say there weren’t some sore spots in the report – there were, but they are also the ones that have been taking lumps for most of 2018. Sporting goods, hobby, musical instrument, & bookstores fell 13% year over year in December, bringing the December quarter drop to 11% overall. Department Stores also took it on the chin in December as their retail sales fell 2.8% year over year.

While that’s a more favorable view, the reality is December Retail Sales came in weaker than expected. Between the government shutdown, falling equity prices, global trade wars and ballooning debt levels, folks opted to keep their wallets in their pockets this past holiday season. In keeping with our Middle-Class squeeze investing theme, consumers looked to stretch the dollars they had to spend, which helps explains Costco Wholesale’s (COST) eye-popping, by comparison, December 2018 same-store sales of 7.5% in December (7.1% excluding gasoline prices and foreign exchange). Those consumer wallet share gains, which likely continued into January with Costco’s same-store sales of 6.6% (7.3% excluding gasoline prices and foreign exchange), and its expanding warehouse footprint are why Costco is Tematica’s Middle-class Squeeze leader.


Corporate Earnings and Confidence Weakening

The earnings outlook for companies in the S&P 500 continues to deteriorate with expectations down to 1% year-over-year growth for 2019 versus 5% just a few months ago. The last Federal Reserve Beige Book found that 25% of the US is in contraction with the remaining 75% expanding at only a modest to moderate pace. The corporate outlook isn’t all that rosy either as venture capital investors are advising their start-ups to hold onto more cash. For example, Index Ventures is reportedly telling their entrepreneurs they need 18 to 24 months’ of coverage versus 9 to 12 months’ worth a year ago according to an article in the Financial Times.

It isn’t just the big guys that are struggling. Economic confidence for small companies declined during most of 2018 and in January reached its lowest level since President Trump was elected according to a monthly survey for the Wall Street Journal by Vistage Worldwide. The report noted that for the first time since the presidential election, small firms were more pessimistic about their own financial prospects than they were a year earlier, including plans for hiring and investment. In January 2018, 83% of the firms surveyed expected to grow revenues over the coming year versus 66% by January 2019. This decline was affirmed by the ISM non-manufacturing PMI report which found that the share with growth dropped from 94.4% last September to 50% today – the lowest since January 2016. The share contracting rose to 44.4%, the highest level since January 2016.


Corporate Loan Demand Echoing Consumer Weakness

Just as we saw demand for consumer credit declining, so has demand for corporate credit been on the wane. Demand for commercial and industrial loans from large and middle-market firms has been flat or in contraction in 10 of the past 13 quarters. For smaller firms, demand has been flat or in contraction in 9 of the past 13 quarters. Demand for commercial real estate loans for construction and land development has been in contraction since the first quarter of 2017.


No Love in the Eurozone

On Valentine’s Day we learned that economic growth in the eurozone was a meager 0.2% quarter over quarter in the fourth quarter of 2018 – so basically flat. Year-over-year growth stood at just 1.2% for the final quarter of 2018. This came after news that the eurozone economic powerhouse Germany had no growth itself in the fourth quarter after a contraction of -0.2% in the third quarter – narrowly missing a recession. Italy experienced its second consecutive quarter of economic contraction, putting it in a technical recession. All this put further downward pressure on the euro versus the US dollar.

Another major headwind in the Eurozone that has consequences far beyond the region is the lack of any Brexit deal. To put the situation in perspective, nations in the Eurozone have been trading with the United Kingdom for 30 years, resulting in highly integrated economies and corporations. Imagine being a grocery store manager in Edinburgh, Scotland and not knowing how your near-daily imports of fruits and vegetables from France are going to be affected or being a Swede working in London, who owns a home there and having no idea how your residency or work situation may be altered.

Without a long-term free trade agreement between the UK and the EU, new trade barriers will have to be introduced at borders and the prospect of different rules on standards and safety could make it harder and more expensive for companies to import and export. The cost of a no-deal Brexit will also affect consumers. The UK imports 30% of its food from within the EU. While companies can build up inventories in advance, there is a limit to what can be done given the shelf-life of some products and raw materials and limits to storage capacity. On top of that, all the additional storage and inventory represents additional business costs, diverting resources from investment in the company and its employees.

There is also no love lost these days between France and Italy, with relations between the two nations at levels not seen since the end of WWII. Italy’s relationship with the Eurozone, in general, has been challenging as its per capita GDP has grown all of 1% in the nearly two decades since it joined the unified currency while France has enjoyed 17% growth, Spain 23% and Germany 29%. For reference, the United States has seen per capita GDP grow 25% during this time.

Relations between the two traditionally close allies that are France and Italy have been degrading since mid-2018 when Italy’s Deputy Prime Minister Luigi Di Maio and Matteo Salvini of the League part starting firing pot-shots at Macron and France over immigration policies. Macron has occasionally fired back, for example, to criticize Salvini when he refused to allow a boatful of migrants rescued in the Mediterranean to step on Italian soil, forcing them to remain on the boat while it was docked. The group has since been moved out of Italy and Salvini has been sued by the court of Catania (where the ship was docked) for the kidnapping of minors. Good times.

Earlier this month France recalled its ambassador to Italy, something it last did in 1945 after Italy’s Deputy Prime Minister Luigi Di Maio – who is also the head of the anti-establishment 5-Star Movement (Cinque Stelle) – met with members of France’s Gilet Jaune (Yellow Jacket) movement. These are the folks who have been protesting in France and amongst other acts of violence, have set fires in cities all across the nation including Paris. To say they have been vexing France’s President Macron would be a massive understatement.

This tension could not be coming at a worse time when the no-deal Brexit crisis looming.


Global Shipping Confirms Weaker Growth

The Baltic Dry Index (BDI), which tracks the cost of moving bulk commodities and is considered a leading indicator of global trade, is down more than 50% since the start of the year. Shipping brokers in Singapore and London have reported capsized vessels, the largest ships that move bulk commodities like iron ore, coal and aluminum, had been chartered in the spot market for as low as $8,200 a day last week. Break-even costs for carriers can be as high as $15,000 a day, and daily rates in the capesize market hovered above $20,000 last year. That’s a serious drop-off in demand, and the BDI tends to be a leading indicators investors and traders watch closely much the way we also watch rail traffic and truck tonnage data.


The Bottom Line

Signs of slowing continue to mount both domestically and internationally, alongside rising geopolitical risks and excessive bullishness in domestic equity markets. This is a good time for investors to put together a shopping list of those stocks that will enjoy long-term tailwinds despite global economic slowing and add them to your portfolio when they reach an attractive price point as we are likely to see a pullback in the markets soon.


Is Everyone Looking the Wrong Way?

Is Everyone Looking the Wrong Way?


Over the past few months, the investing markets have considered Federal Reserve Chairman Powell enemy number one. Earlier this week the markets once again showed that America’s central bank drives sentiment more than any other factor, forget trade wars, forget earnings, forget political drama, it is the Fed and only the Fed that matters. That may sound somewhat simplistic to all the fundamental analysts and market technicians out there, but let’s face facts – it’s true.

Even the end of the 35-day long government shutdown barely generated a response from the markets.

What did generate interest was the rumor that the Fed may be considering ending its $50 billion-a-month drawdown of its balance sheet.

The afternoon of Wednesday, January 30th, after a much more dovish tone out of Powell, the stock market closed up for the first time after the past eight FOMC meetings – the longest post-FOMC losing streak on record. The prior meeting on December 19th was followed by a gut-wrenching 1,800-point crash in the Dow over the following four sessions. As we were nearing the end of 2018, it looked and smelled like the Fed went too far yet again, as it had done in 10 of the past 13 post-WWII hikes – so much for the narrative of the omniscient central banker. As Mark Twain wrote, “History doesn’t repeat itself, but it does rhyme.”

Investing is all about finding an inflection point, where the market is wrong – pricing an asset too high or too low, believing a policy to be beneficial when it isn’t or vice versa. Given the ubiquitous nature of the belief that the Fed is the central bank that really matters to the market, what if that supposition is wrong?

What if everyone is looking in the wrong direction with the wrong set of expectations? What if everyone ought to be looking in the direction of our New Global Middle Class investing theme? We will start to explore that idea in this week’s piece along with an assessment of the domestic and global economy.

As Chris Versace and I wrote in our book Cocktail Investing, there are three major participants in an economy: consumers, business and government. To understand what is happening in an economy one needs to understand the vector and the velocity associated with each one of these participants.


Households’ Outlook Dims

Our Middle-Class Squeeze investing theme was again front and center this week in the domestic economy. This week we got a rather dour report on how the Household sector of the economy is feeling about the future with the University of Michigan’s monthly index of Consumer Sentiment, which gauges American’s view on their own financial condition as well as the economy in general. In January U.S. Consumer Confidence dropped to 90.7 versus expectations for 96.8, hitting an 18-month low despite initial jobless claims dropping to a 49-year low, likely thanks to the double-whammy of the partial government shutdown and the recent volatility in the financial markets.

The decline was driven primarily by deteriorating expectations about the future, with that portion of the index declining 11% in January after falling 13% in December. On the other end of the spectrum, consumer’s assessment of current conditions is a mere 2% below the August peak which puts the spread between consumer’s outlook for the future and their present situation at nearly the largest since 1967. The only period in which the spread was greater was January through March of 2001 – the recession began in March 2001. Hat tip to David Rosenberg of Gluskin Sheff for the chart below.

We will be watching this metric particularly closely in February as well as the February Manufacturing Index given the recent drop in the 6-month view.

The rather glum outlook continues to be a headwind to the housing sector. House sales, excluding newly built homes, fell by 10% in December compared with the same month in 2017, according to the National Association of Realtors. Interestingly, this sharp fall off occurred despite the late 2018 rollover in mortgage rates, which as any a home buyer knows makes for a lower cost of total home ownership.


Slowing Corporate Sector

We are knee deep in the December 2018 quarter earnings season with around one-third of the S&P 500 companies having reported so far with an aggregate increase of 14.2% in earnings per share on an increase of 5.6% in revenue. While that sounds pretty good at first glance, what concerns us is that the beat ratio so far is the lowest since 2014, despite having the second most aggressive estimate cuts in the months going into this season since the depths of the financial crisis. On top of that, expectations for 2019 are being materially scaled back with expected EPS growth having fallen to just 1.6% year-over-year in the March quarter, driven in large part by weakening revenues for those companies with a lot of international sales exposure. As we’ve heard from a growing number of companies over the last few weeks, they are feeling the pinch of the trade war as well as the strong dollar.

One theme that keeps rearing its head is the impact of weakness in China, which is no small matter given that according to the US Census Bureau, America’s exports to China have doubled over the 10 years through 2017 to reach $130 billion a year. Companies ranging from Caterpillar (CAT) to Apple (AAPL), NVIDIA (NVDA) to Stanley Black & Decker (SWK) and 3M (MMM) have commented on the impact of a Chinese slowdown.

Caterpillar expects its Chinese markets to be flat in 2019. NVIDIA reported weaker Chinese demand for its computer chips and gaming consoles. H.B. Fuller Co (FUL) reported that weaker demand from China will reduce its profits by $20 million this year. PPG Industries (PPG) reported sales of its coatings for cars made in China fell 15% in the December quarter.

Despite these declines, however, luxury goods associated with our Living the Life investing theme continue to boom in China according to LVMH-Moet Hennessy Louis Vuitton (LVMHF). During its earnings conference call, the company shared that “growth in China has accelerated in Q4 compared to the previous quarters and the beginning of this year is the same.” That strength was corroborated by Ferrari (RACE) that reported its sales in China, Hong Kong and Taiwan rose nearly 13% year over year in the December quarter, and forecasted a pickup in its China business during the first half of 2019. Some of this may reflect the non-US nature of those companies, but the more pronounced driver is more than likely demographic in nature as captured by the rising middle class in China and the allure of aspirational goods, but also the rapid rise in wealthy and ultra-wealthy Chinese, a key cohort when it comes to the Living the Life tailwind.


Government

While the partial government shutdown has finally come to an end, at least temporarily, inside the beltway is increasingly looking like a kindergarten class that has missed its afternoon nap. The US federal deficit continues to be quite large compared to post WWII norms.

The sheer size of the federal deficit combined with the Federal Reserve program to reduce its balance sheet means that roughly $1.3 trillion is being pulled away from the private sector. The more money the government needs, which means increased Treasury bond supply, the less money is available to be spent in the private sector – this is referred to as the crowding out effect of large government deficits. The Fed’s actions along with the increase deficit spending are one of the factors behind the recent drop is equity prices as the money has to come from somewhere. Less money in the private sector means demand for private sector assets declines which impacts prices. What about China? Well, it is no longer a buyer of US debt and may well have become a net seller.


Global Economy

In 2017 the world’s leading economies accelerated in sync, boosting equity prices. In 2018 the U.S. economy surged on thanks in part to fiscal stimulus in the form of tax cuts and increased government spending while the rest of the world slowed. In 2019 the world looks to be once again syncing up to slow down. The IMF warned that “the global expansion is weakening and at a rate that is somewhat faster than expected”. The fund revised down its forecasts, particularly for advanced economies with the world’s economy forecast to grow by 3.6% in 2020. Although that is stronger than in some previous years, the IMF thinks “the risks to more significant downward corrections are rising”, in part because of tensions over trade and uncertainty about Brexit.

The Global Zentrum fur Europaische Wirtschaftsforschung (ZEW) Economic Sentiment Index echoes what we’ve seen from the Michigan Consumer Sentiment Index.

Italy has now had two consecutive quarters of contracting GDP, which means that technically Italians are breaking out the Barolo and sadly toasting to their latest recession. Germany, which has been the strongest economy in the Eurozone, saw its economy contract 0.2% in the third quarter of last year, its industrial production decline 1.9% in November, and retail sales crash 4.3% in December, sparking fears that the country is on the brink of a recession as well. Recent federal statistics have Germany’s economy growing by just 1.5% in 2018 versus 2.2% in 2017 with the IMF forecasting just 1.3% in 2019. According to data published by IHS Markit, France’s Composite Output Index that reflects its manufacturing and services economy remained in contraction mode at 47.9 in January, down from 48.7 in December. As a reminder, a reading below 50 indicates a contraction, while one above 50 indicates growth. Against that backdrop, it’s not shocking to read that European Central Bank President Mario Draghi say “The European Central Bank is ready to use all its policy tools to support Europe’s softening economy, including by restarting a recently shelved bond-buying program.” As for the U.K., consumer confidence with respect to the economic outlook fell to a 7-year low in January.


China Slows

China has the second largest economy in the world and will soon replace the US as the world’s largest retail market as it benefits from the tailwinds in our New Global Middle Class investing theme. What happens in China matters to the rest of the world. For example, China has become the largest importer of wood in the world and the largest exporter of things made from wood, ranging from furniture to flooring. While China’s economy will eclipse that of the US, growth doesn’t come in a straight line and we are seeing warning signs:

  • China’s economy has slowed 6.4% in the fourth quarter of 2018, the third consecutive deceleration. Growth slowed to 6.6% in 2018, the slowest growth since 1990 when sanctions were imposed following the Tiananmen Square massacre.
  • Manufacturing PMI in January stood at 49.5 and was 49.4 in December, showing 2 consecutive months of contraction.
  • Property sales, which had been a reliable source of growth which took advantage of borrowing opportunities have been slowing.
  • The growth in retail sales has fallen to its lowest level in more than 15 years.
  • Sales of cars fell last year for the first time in more than two decades.
  • Companies have started cutting back hiring and incomes are growing more slowly, weighing on consumer sentiment. The middle three quintiles of China’s population by income distribution saw earnings increase by only about 2% last year in real terms.
  • Defaults are on the rise. Corporate bond defaults reached 19 billion yuan in the first half of 2018 versus 14 billion in the same period of 2017. Smaller banks in rural areas, which would be the first to feel the pain, are seeing rising levels of bad loans.

As a result, China is letting up on its drive to deleverage its economy and Chinese investment into Europe and America fell by 73% in 2018. China has already pivoted towards more supportive economic policies. It has sped up spending on infrastructure, trimmed income taxes and relaxed some restraints on bank lending. China has a massive population that it needs to keep employed and was the world’s engine during the last financial crisis, providing a floor under demand as much of the rest of the world was crashing.


What If They Are Wrong?

The US today has the highest non-financial private sector debt to GDP ratio in history. Overall the global debt to GDP ratio is the highest we’ve ever seen. Most likely the Fed tightening cycle has come to an end and the next thing we are most likely to see is easing, but this time perhaps that cure is already used up?

We’ve already seen materially diminishing returns from Fed stimulus efforts in the past.

What if this time around the only central bank that truly matters is China’s?

What if China decides to alter its monetary policy, its peg to the dollar, to help its slowing economy thereby creating a cascade across the east as its neighbors scramble to respond?

What if the only bank in the world that can affect asset prices this time, that can actually create inflation is the one for the biggest consumer of raw materials in the world, the one in the East at the People’s Bank of China while everyone is looking the other way?

What if indeed…

How many investors are factoring that into their thinking? Is President Trump contemplating that as US-China trade talks continue? We’ll be watching so stay tuned.


As the Market Bounces Off Oversold Conditions, is this the Start of Another Bull Run?

As the Market Bounces Off Oversold Conditions, is this the Start of Another Bull Run?

Market Reversal

So far in 2019, we are seeing a reversal of the heavily oversold conditions from the end of 2018. Those stocks that were hit the hardest in 2018 are materially outperforming the broader market in 2019. For example, through the close on January 16, 62% of stocks in the Financial sector were above their 50-day moving average, the highest of any sector, versus 44% for the S&P 500 overall. To put that into perspective, Financials have not been the top performer for this metric in 273 trading days, the second-longest such streak since 2001 and only the fourth streak ever of more than 200 trading days. It isn’t just financials as the Energy sector, which was the worst performing sector in 2018, has the third highest percent of stocks above their 50-day in 2019.

While impressive looking, this shift doesn’t necessarily bode well for the Financial sector, nor for the broader market according to data compiled by Bespoke Investment Group.


Stock Performance After Streaks Ended


This recent outperformance by Financials in 2019 is particularly fascinating when I talk to my colleagues at various major financial institutions. Here are a few of the comments I’ve been hearing, paraphrased and without attribution for obvious reasons:

“This deal is way too small for you guys, but I wanted to let you know that our team is working on it.” –  (M&A consultant)

Send it over.We are so late in the cycle that we are looking at damn near anything.” –  (Partner at one of the largest global private equity firms)

“What can we do to better serve your company? We are making a major push this year into better serving companies of this size.” –  (Partner at one of biggest investment banks to a very surprised member of the Board of Directors of a recently IPO’d company whose market cap would have normally left it well below the bank’s radar. After some investigation, many other board members for companies of a similar size in the sector have been getting the same phone calls from this bank.)

The big financial institutions are having to work their way downstream to find things to work on – that’s a major peak cycle indicator and does not bode well for margins. It also doesn’t bode well for the small and medium-sized institutions that will likely need to become more price competitive to win deals in this new more competitive playing field.

We have also seen some wild moves in a few of our favorites such as Thematic Leader Netflix (NFLX), which reported its earnings after the close on January 17th. Netflix sits at the intersection of our Digital Lifestyle and Disruptive Innovators investing themes and has seen its share price fall over 40% from the July 2018 all-time highs to bottom out on December 24th. Since then, as of market’s close on January 17, shares gained nearly 50% – in around all of 100 trading hours! While about 10% of that can be attributed to the recent price increase that will amount to about $2 or so per month for subscribers, there are greater forces at work for a move of such magnitude. No one can argue that either direction was based on fundamentals, but rather a market that is experiencing major changes.

One of the most important leading indicators as we start the Q4 earnings seasons was the miss by FedEx (FDX) and the negative guidance the company provided for the upcoming quarters. FedEx’s competitor United Parcel Service (UPS) is part of our Digital Lifestyle investing theme – how are all those online and mobile purchases going to get to you? Both FedEx and UPS are critical leading indicator because they touch all aspects of the economy and transportation services, in general, have been posting some weak numbers lately in terms of both jobs and latest price data.

In what could be reflective of both our Middle Class Squeeze investing theme, Vail Resorts (MTN) also gave a negative pre-announcement, stating that its pre-holiday period saw much lower volumes than anticipated despite good weather conditions and more open trains. The sour end of the year in the investment markets and the weakness we’ve seen in markets around the world may have led many decided to forgo some fun in the snow. We’ll be keeping a close eye on consumer spending patterns, particularly by income level in the months to come.

Investor Sentiment Slips

According to the American Association of Individual Investors, bearish investor sentiment peaked at 50.3% on December 26, right after the market bottomed. Bullish sentiment over the past month rose from 20.9% to 38.5% but then stalled this week, falling back to 33.5% as the markets reached resistance levels. Bullish sentiment is now back below the historic average but still well above the December lows. Bearish sentiment, on the other hand, is on the rise, up to 36.3% from last week’s 29.4%. This is just further indication that much of what we’ve seen so far in 2019 is a recovery from the earlier oversold conditions.

As we look at the unusual pace at which the major indices lost ground in the latter part of 2018 and the sharp reversal in recent weeks, I can’t help but think of one of the many aspects of our Aging of the Population investment theme. A large portion of the most powerful demographic of asset owners is either in or shortly moving into retirement. Many already had their retirement materially postponed by the losses incurred during the financial crisis. They are now 10+ years older, which means they have less time to recover from any losses and have not forgotten the damage done in the last market correction. I suspect that we are likely to see more unusual market movements in the years to come than we have since the Boomer generation entered into the asset gathering phase of life back in the 60s and 70s. Today this group has a shorter investment horizon and cannot afford the kinds of losses they could 20+ years ago.

The Shutdown and the Fed

Aside from a rebound against the oversold conditions, another dynamic that has the market in a more optimistic mood, at least for the near term, is the narrative that the government shutdown is good news for interest rates as it will likely keep the Federal Reserve on hold. Given that estimates are this shutdown will cost the economy roughly 0.5% of GDP per month, it would be reasonable for the Fed to stay its hand.

Inflation certainly isn’t putting pressure on the Fed. US Producer Prices fell -0.2% last month versus expectations for a -0.1% decline. The bigger surprise came from core ex-food and ex-energy index which fell -0.1% versus expectations for an increase of +0.2%. Keep in mind that core PPI declines less than 15% of the time, so this is meaningful and gives Powell and the rest of the FOMC ample cover to hold off on any hikes at the next meeting.

US import prices fell -1% month-over-month in December after a -1.9% decline in November, putting the year-over-year trend at -0.6%. That’s the first negative year-over-year print since August 2014. Yet another sign that inflation is rolling over.


Economy Flashing Warning Signs

Despite all the hoopla earlier this month over the December’s job’s report, this month’s Job Openings and Labor Turnover Survey (JOLTS) report showed that for the first time since the end of 2017 and just the 6thtime in this business cycle, hirings, job openings and voluntary quits fell while layoffs increased in November.

By digging further into the details of the Household survey as well we see that people holding onto more than one job rose +117k in December, accounting for over 80% of the total employment gain. On top of that, the number of unincorporated self-employed rose +126k. These two are things we normally see when times are tough, not when the economy is firing on all cylinders. Not to be a Negative Nancy or Debbie Downer here, but the prime-working-age (25-54) employment shrunk -11k in December on top of 48k the month before. This was before things started to get really scary for many workers with the government shutdown. Imagine how many more are now looking for a second job to make ends meet while they wait for those inside the beltway to work this mess out.

We also got a materially weak New York Empire Manufacturing survey report this week that saw New Orders decline for the second consecutive month and a sharp drop in the 6-month expectation index. The New York Federal Reserve’s recession risk model is now placing odds of a recession by the end of 2019 at over 21%, having more than doubled since this time last year and having reached the highest level in 10 years. Powell and his team at the Fed have plenty of reasons to hold off on hikes. I wouldn’t be surprised if their next move is actually to cut.


NY Fed Recession Probability


Risks, what risks, we don’t see no stinking risks

US economy isn’t as strong as the headlines would make you think. The political dialogue going back and forth while on the one hand entertaining in a reality TV I-cannot-believe-he/she-just-said-that kind of way isn’t so funny when we look at the severity of problems that need to be addressed – excessive debt loads, a bankrupt social security program, a mess of a healthcare sector – just to name a few. The market today isn’t pricing much of this in, and based on the year to date move in the major market indices, particularly not the potential economic damage the government shutdown if the situation worsens.

If we look outside the US, the market’s indifference is impressive. UK Prime Minister Theresa May’s Brexit plan suffered a blistering defeat in Parliament, the largest such defeat on record for over 100 years, leaving the entire Brexit question more uncertain than ever and it is scheduled to occur just over two months away. In the two days post the Brexit vote back in 2016 the Dow lost 870 points and the CBOE Volatility Index (VIX) rose 49%. This time around the equity markets were utterly disinterested and the VIX actually fell 3.5% – go figure. A messy Brexit has the potential to have a material impact on global trade and yet we basically just got a yawn from the stock market.

Over in Europe flat is the new up with Germany’s GDP expected to come in every so slightly positive and this is a nation that accounts for around one-third of all output in the euro area – with China a major customer. Overall, Eurozone imports and exports fell -2% in November.

The other major exporter, Japan, just saw its machinery orders fall -18.3% in December after falling -17% in November. Japan already had a negative GDP quarter in Q3 and the latest data we’ve seen on income and spending aren’t giving us much to be positive about for the nation.

The Trade War continues with some lip service on either side occasionally giving the markets brief moments to cheer on some potential (rather than actual) signs of progress. The overall global slowing coupled with the trade wars is having an effect. China’s exports for December were far worse than expected, -4.4% from year-ago levels vs expectations for +2%. Last week Reuters reported that China has lowered its GDP target for 2019 to a range of 6% to 6.5%, which is well below the 6.6% reported output gain widely expected last year which itself is the weakest figure since 1990. Retail sales growth has fallen to a 15-year low as auto sales contracted 4.1% in 2018, the first annual decline in 28 years. With a massive level of leverage in its economy, banking assets of $39.1 trillion as of Sept. 30, and nearly half of the $80.7 trillion 2017 world GDP, (according to the World Bank) waning economic growth could be a very big problem and not just for China. We’ll be watching this as it develops given our Rise of the New Middle-class and Living the Life investing themes.

The bottom line is we’ve been seeing the markets bounce off seriously oversold conditions after a breathtakingly rapid descent. The fundamentals both domestically and internationally are not giving us reason to think that this bounce is the start of another major bull run. With all the uncertainty out there, despite the market’s recent “feel good” attitude, we expect to see rising volatility in the months to come as these problems are not going to be easily sorted out.


Debt Bombs Ticking Across the Globe

Debt Bombs Ticking Across the Globe


There are times when writing from the macro perspective can be challenging, particularly when macro takes a backseat as it is prone to do during parts of the business cycle. This year macro is back with a bang.

JPMorgan recently assessed the chance of a recession in 2019 has risen to 35%from just 16% in March based on macro data alone. The markets realize that the underlying dynamics have changed and are grappling with what to expect next:

  • As we mentioned last time, in 2017 only 1 of the 70 asset classes Deutsche Bank tracks closed in negative territory despite many being inversely correlated – clearly a market behaving oddly. As of mid-November, 90% were in the red for 2018 as the overexuberance of 2017 is forced to pay the piper.
  • In 2017 44 of the 47 country stocks in the global MSCI index closed up for the year. As of the December 11thclosing, only 3 are in the green.
  • The suppressed volatility in 2017 has led to hyper in 2018 as the S&P 500 has lost 3% or more in three market sessions this year with not one gain of 3% or more, a dynamic which last happened in 1936. The Dow Jones Industrial Average has experienced four days of 3%+ losses and no daily gains of that magnitude, a dynamic which last happened in 1897. (Hat tip to David Rosenberg of Gluskin Sheff)

Market dynamics are reflecting the increase in macro/political volatility across much of the world, but the headlines have yet to catch up with the primary drivers underlying the deep changes. In our previous Context & Perspectives piece, I discussed how we are seeing a profound decline in the level of liquidity at a time when debt levels are back to record highs. This week is a highlight reel of warning signs in the context those record levels of debt.

  • US employment
  • US Treasury balance sheet and yield curve inversion
  • Oval Office produces day time TV level drama
  • US China Trade War
  • UK Brexit Drama Spikes
  • Paris on Fire
  • Italy sees an opportunity


USA Employment Picture

Last Friday’s Nonfarm payrolls were significantly below expectations at +155k versus expectations closer to +200k on top of downward revisions of 12k to the prior two months. That’s not great, but amidst all the hype around this being a phenomenally strong economy, the workweek shrunk to a 14-month low of 34.4 hours from 34.5 in October. That translated effectively into 370k jobs lost, which means that the real picture for employment was a net loss of -215k (+155k new payroll -370k from shortened work week). The -0.2% decline in aggregate hours worked, the second decline in the past three months, means that unless there was a big jump in productivity, output, aka real economic activity, contracted for the month.

We also saw a decline in earnings with average weekly income falling -0.1% given the decline in the average workweek and an increase of hourly earnings of +0.2% versus +0.3% expected. This is the first decline in weekly earnings in 2018 and may call into question the expectations around Christmas shopping.

The recent University of Michigan Consumer Sentiment survey found that an increasing number of respondents are expecting unemployment to be higher in the next twelve months than lower and a recent Gallup poll found that Americans plan to spend less on holiday gifts today than they expected back in October and less than they expected to spend in 2017. The $91 decline in expected spending since October is, “one of the steeper mid-season declines, exceeded only by a $185 drop that occurred in 2008, as the Wall Street financial crisis was unfolding, and a $102 drop in 2009 during the 2007-2009 recession.” The environment is changing.

Putting it all together, last month saw a contraction in the workweek, in the index of aggregate hours worked and in average weekly earnings – not exactly a story of a robust economy despite the headline 3.1% year-over-year rise in average hourly earnings, the strongest read since 2009. Digging into the details can give a different picture.

Earlier this week the JOLTS (Job Openings and Labor Turnover Survey) saw the number of job openings increase in October to 7.08m from September’s 6.96m, but still below the August peak of 7.29m. The number of voluntary quits declined to a 4-month low. This was likely thanks to, per data from the Atlanta Fed Wage tracker, ‘job switchers’ and ‘job stayers’ enjoying the same wage gains for the first time in three years. This is an indicator of rising wage pressures which puts pressure on margins at a time when as the FT put it, “Cracks in the corporate debt market begin to show.”

October also saw a greater-than-expected increase in consumer credit to $25.4b versus the $15b driven largely by student debt and auto loans – debt, debt and more debt.

Over the past few weeks your Tematica Research team has called out some Thematic Signals here, here and here that illustrate between the impact our Aging of the Population and the Middle Class Squeeze investing themes, many American consumers continue to struggle.


US Treasury Balance Sheet and Yield Curve Inversions

This week’s CPI report was in line with expectations at 2.2% year-over-year and showed inflation that is high enough for the Federal Reserve to proceed with another rate hike this month, but the bond yield landscape is changing. On December 3rd, the 3-year Treasury note yield exceeded that of the 5-year for the first time since 2007, which is known as a yield curve inversion. As of December 12th, the 5-year yield sat below the 2-year. The spread between the 10-year and the 2-year is at a level not seen since 2007 and is close to inverting as well. The spread between the 10-year and the 3-month (which is closely watched as a recessionary signal) has plummeted from 136 basis points in February to just 44 and been cut in half in the past month alone. This has the Federal Reserve’s attention.


As a reluctantly avid Fed watcher, (I wish monetary policy wasn’t such a driving force in the global economy these days) I’d be remiss if I didn’t point out this fascinating tidbit. On June 27, 2017, when the VIX Volatility Index sat at 11, US Federal Reserve Chair Janet Yellen said,

“You know probably that would be going too far but I do think we’re much safer and I hope that it will not be in our lifetimes and I don’t believe it will be.”


On Tuesday December 11th, 2018 (532 days or 1.46 years later) when the VIX sat at 22, now former US Federal Reserve Chair Janet Yellen said on CNBC,

“I’m not sure we’re working on those things in the way we should, and then there remain holes, and then there’s regulatory pushback. So I do worry that we could have another financial crisis. ″

You can’t make this stuff up.

On top of raising rates to tighten financial conditions, the Federal Reserve tapering has reduced its balance sheet by 8.3% since its tapering program commenced 13 months ago – that’s a solid level of liquidity drain as we’ve discussed in our last Context & Perspective piece.

The futures market is now pricing in less than 20 basis points of rate hikes next year versus over 55 basis points just a few months ago.

Oval Office Drama

Just when you thought the acrimony inside the beltway could not possibly get worse, it did. On Tuesday December 11thPresident Trump and Vice President Pence met with House Minority Leader Nancy Pelosi and Senate Majority Leader Chuck Schumer in the Oval Office while the network TV cameras rolled to discuss the impending government shutdown.

If this is a preview of what we can expect in the next two years with a divided government, the markets are right to be concerned with Capitol Hill’s ability to take constructive action if/when the economy slides into a recession let alone deal with the immediacy of a potential government shutdown which would leave federal employees without a paycheck at Christmas.

At a time when corporate balance sheets are the weakest they’ve been since the financial crisis, the federal deficit is at a percent of GDP not seen outside of a war or a recession. Total public debt outstanding has risen by $1.7 trillion (or 6.6%) since the start of the year. The current debates in DC are not focused on reducing the deficit, but rather a battle over where to spend. This means we are likely to see a greater supply of Treasury bonds on the market in the coming year(s) to compete with the high level of corporate debt that will need to be refinanced as we discussed in our last piece.


This level of dysfunction is particularly concerning when we look around the world and see political volatility outside the US also reaching heights rarely seen. Keep in mind that during the prior financial crisis leadership in much of the world’s leading nations were much more stable. The bottom line here is the current market volatility doesn’t fully reflect the heightened political risks emerging.


US China Trade War

The trade war between the US and China has seen some major fireworks over the past few weeks from the arrest of China’s Huawei’s CFO Meng Wanzhou to Canada granting her bail to rumors that China plans to submit a proposal to reduce its 25% surcharge on US-made vehicles. One day it is acrimony, the next rumors of attrition. What we do know is that China’s economy is weakening, (China imports rose just 3% year-over-year versus expectations for 14%) and the trade wars are having an impact on both nations. Regardless of one’s political preferences on this topic, when the two largest economies in the world go head-to-head, it is going to have a negative impact on global growth in at least the near-to-medium term.

Tying this back to the debt issue, given China’s black box economy with data tightly controlled by its government, it is impossible to have accurate data on just how high the nation’s debt level has reached. Estimates are that China’s total debt has hit more than 300% of GDP(according to the Institute of International Finance), versus the “official’ level of 47%, and Chinese distressed assets have grown by over 25% in the 18 months according to data from PwC.

China’s economic growth has been heavily dependent on ever-rising levels of debt and is showing signs of stumbling. As the world’s second largest economy, when China struggles the world will feel it.

UK Brexit Drama Spikes

The UK was not to be outshined by this week’s Oval Office “disagreement” as its political strife spiked when Prime Minister Theresa May postponed the Parliamentary vote on the agreement she reached with the European Union on fears that it had a snowball’s chance in hell of passing. The EU leaders insist that there will be no fundamental changes made and the Prime Minister survived a vote of no confidence in her leadership the night of December 12thas euro-skeptic MPs attempted a coup against her to wrest control of the final 106 days of Brexit talks. She was forced to agree to not lead the Tories into the next election, which puts her at risk of becoming a lame duck like her German counterpart, Angela Merkel.

We are quickly moving towards the worst of all possible outcomes, at least in the near-to-medium term, with no deal between the European Union and the United Kingdom and the UK lacking any strong leadership as it sails into uncharted political territory. All this uncertainty it a major headwind to economic activity on both sides at a time when people in the UK and the EU are increasingly angry over the lack of improvement in household finances as it has also been struggling under the Middle Class Squeeze. Voters will be looking for more rather than less government spending if/when their respective economies weaken, which means even more debt in a world awash with it.

Paris on Fire

Over the past weekend Paris erupted into violent protests, the magnitude of which is under debate, but the result of which was a clear – a loss a political firepower for France’s President Macron as he agreed to roughly €10 billion in concessions, including a minimum wage hike and tax breaks for employers. Many in France have also been suffering from Middle Class Squeeze and are frustrated by their leaders’ ongoing inability to shift the economy into something that provides them with better opportunities. Their demands mean more government spending which means more debt.

France is now on track to have the biggest budget deficit in the EU next year and Macron’s credibility and political power have taken a serious blow. This is yet another dangerous blow to the European Union.


Italy Sees and Opportunity

While Paris was burning, Italy’s Matteo Salvini and Claudio Borghia were loving (and tweeting)  what this would likely mean for their budget talks with Brussels, who as you may recall had sent the Italian leadership back to the drawing board in Rome to hammer out a budget with a smaller deficit. To put their deficit in perspective, the rejected plan was for 2.4% of GDP versus the US on track this year for over 6.6%. The troubles in Paris may give Rome confidence to push back against Brussel’s demands as they meet on December 12th. Late on the night of Wednesday December 12thrumors started to fly that perhaps the Italians would reduce the planned deficit to 2% of GDP. Either way, Italy is facing a weak and weakening economy with nearly €200 billion of Italian bonds coming due next year that will need to be reissued in addition to its current deficit.

Fighting Brussels is one thing, but the debt markets are another thing entirely and they are not pleased with what they see as evidenced by the widening spread between the Italian and the German 10-year, which has reached the highest level since the worst of the eurozone crisis. Moody’s has downgraded Italy’s rating to Baa3 while S&P and Fitch held their ratings but downgraded the nation’s outlook. If Italy’s economy weakens further, and its economy already contracted by -0.1% in the third quarter versus the prior, it could lose its investment grade standing which would have a major impact on bond markets as Italy’s external debt was $2.5T at the end of 2017.

When it comes to the problems arising from Aging of the Population and the Middle Class SqueezeItaly is in even worse shape than the United States and its banks still hold an elevated level of domestic debt. The employment situation is worsening.

The banking sector is quite vulnerable.

Italy, like France and the UK, is facing voters who a frustrated with the lack of improvement in the household finances and the populist movements sweeping across them are looking for governments to spend their way into national prosperity. Neither Italy, France, Germany nor the UK have strong or stable political leadership and GDP growth is faltering. This is not good.

According to data from the International Monetary Fund’s October 2018 Edition of the World Economic and Financial Survey, since the inception of the unified currency, Italy has seen all of a 1% increase in its per capita GDP (as measured by chained domestic currency) while even beleaguered Greece has enjoyed a 5% increase. On the other end of the spectrum Ireland has seen its per capita GDP nearly double with an increase of 89%, Germany is in second place with a 29% improvement while the US and the UK both have seen a 25% improvement. Is it any wonder that voters in Italy are becomingly increasingly skeptical of the euro?


Putting it all together

In our last Context & Perspective piece I discussed how we are seeing a profound decline in the level of liquidity at a time when debt levels are back to record highs. In this week’s piece, I discuss the trends across major parts of the world that are likely to lead to even more debt. We look to be in the final innings of what the master investor Ray Dalio of Bridgewater Associates refers to as the debt super-cycle. These cycles tend to run 50-75 years and we are today at the far end of that range with excessive leverage across much of the world, highly concentrated lending portfolios and a mismatch between assets and liabilities and/or liabilities and asset cash generation potential.

We’ll be talking about this more in the coming months but before then, I highly recommend Mr. Dalio’s free book on how to navigate a debt crisis, which you can get a copy of here. The impact of all this debt on the economies of the world will have a profound impact on tomorrow’s investable markets.


Debt Levels + Falling Liquidity = EPS Pressure Ahead

Debt Levels + Falling Liquidity = EPS Pressure Ahead


Investing markets across the board have taken a serious beating in 2018. According to Deutsche Bank, of the 70 asset classes they track, 63, or 90% of them, are in the red for the year. In 2017 only 1 of the 70 closed in the red. We’ve undergone a massive shift in the investing landscape which bears further investigation.

Taking a step back to look at the market and the economy, over the nine years since the depths of the financial crisis bear market in March 2009 the S&P 500 rose 330% through its September peak. During that time GDP averaged an annual growth rate of 2.1%, which is just two-thirds of the average annual GDP growth rate from 1990 through 2007. In comparison, in the nine years between 1990 and 2000, the S&P 500 rose 350% within an economy that grew an average of 3.7% a year. During these two periods the S&P 500 gained roughly the same amount, but in the current period GDP rose at just over half the pace of the 1990 to 2000 period.

Why did we see such a profound increase in the S&P 500 when the economy was growing so much more slowly?

You can thank all that central bank provided liquidity in the form of various quantitative easing programs primarily provided by the Federal Reserve, the European Central Bank, Bank of Japan and let’s not forget the phenomenal growth in debt in China. As I described on this week’s Cocktail Investing Podcast, you can think of liquidity as water being poured into the global economic pool. As more water flows in, the level of the water, which is akin to the price of assets, rises. However, not all assets rise at the same rate every time. Last time around the increasing levels of liquidity were focused in housing and we saw real estate prices in much of the world rise at record rates. This time around the rising liquidity has been focused in the investing markets.


Draining the liquidity stimulus for the stock market

Today the water in that pool is being drained as global liquidity is shrinking at the fastest pace since 2008. The Federal Reserve is reducing liquidity in two ways, one by raising rates and the other by shrinking its balance sheet. When the Federal Reserve raises the Fed Funds rate, the result is higher short-term interest rates. That makes borrowing both more expensive for the borrower and riskier for the lender as the borrower has a higher hurdle to be able to service the debt. The Fed is currently shrinking its balance sheet at an effective annual rate of about $600 billion by not reinvesting those bonds it holds that mature. This means that when a bond the Fed owns for say $100 matures, the Fed receives the $100 and does not use it to purchase another bond, which means that $100 stays at the Fed and is effectively removed from the money supply.

On November 28th, Federal Reserve Chairman calmed the markets with his speech at The Economic Club of New York stating that rates, “remain just below the broad range of estimates of the level that would be neutral for the economy.” The market cheered this shift in tone from his stance in early October when he stated that rates were, “a long way from neutral.” One has to wonder how much the criticism coming out of the White House may have impacted such a change in the outlook for the economy in just 56 days. With most economic data available only on a monthly basis, it seems odd that one month’s worth of data would warrant the material shift that the market now expects. For months the data coming in has been suggesting a slowing economy both in the US and abroad, but we’ve seen nothing dramatic over the past 56 days.

The markets are now pricing in one more rate hike in 2018 and only one more in 2019, down from the prior view of up to four next year, which put downward pressure on the US Dollar that lasted all of one day, with the DXY US dollar index back in the green by the following morning. I’d like to point out that the target interest rate range is estimated to be between 2.5% and 3.5%. The Fed’s rate range today is between 2% and 2.25%, so we could be looking at future hikes that would total anywhere from 25 to 125 basis points. Powell also specifically mentioned that “equity market prices are broadly consistent with historical benchmarks such as forward price-to earnings ratios,” which indicates he isn’t worried about the recent stock market weakness.


Follow the Fed’s balance sheet deleveraging

While rising rates are good news for margins at banks, US banks look to be shoring themselves up for a slowdown. The inimitable David Rosenberg of Gluskin Sheff recently pointed out that, “They have shed assets in four of the past five weeks. On a four-week basis, bank assets have declined at nearly a 4% annual rate…. The part of the balance sheet that is expanding, and by the fastest pace, is bank holdings of Treasury securities which have bulged at a 13% annual rate over the past 13 weeks (and by 16% over the past four weeks.)”

In Asia (ex-Japan) the central banks’ supply of currency and bank reserves have decreased by 7% in real terms since the US Dollar started its recent move up in April. This is the steepest contraction in the monetary base since January and October of 2008 when it contracted by 11%.

Overall the inflation-adjusted global monetary base has contracted just five times since 1980 – 1982, 1990, 1998, 2011 and 2006. Every time the contraction either preceded or coincide with global economic slowdown. The question then is, what will be most affected?


What goes around is bound to come around

The last time around we saw liquidity raise home prices to record heights so when the liquidity flows reversed, home prices fell. Those areas in which prices had risen the fastest fell the hardest. This time around we’ve seen an increase in stock prices and a significant increase in corporate debt, which has increased by 86% from the 2007 peak by the end of the second quarter of 2018. As we see rates rising, here are some points that are cause for concern:

  • Global debt has reached a record $247 trillion, 318% debt to GDP – a ratio far above the roughly 200% in 2008.
  • The level of corporate debt has hit an all-time record high of $6.3 trillion, which looks manageable as in aggregate US companies have $2.1 trillion in cash to service that debt, but that cash is concentrated in the hands of a few behemoths.
  • The ability to service that debt is weak for many. The cash-to-debt ratio for speculative-grade borrowers fell to a record low of 12% in 2017, well below the 14% seen in 2008. This means that for every dollar they generate in cash flow, they have $8 of debt.
  • It isn’t just the speculative grade that is struggling. Over 450 investment-grade companies that are not in the top 1% of cash-rich issuers also have cash-to-debt ratios that are quite low, around 21%. Rising rates mean even weaker coverage ratios.
  • The quality of debt is low by historical norms. Moody’s Covenant Quality Indicator has been sitting at the lowest level of classification for the past 18 months, just slightly off its August 2015 record low.
  • 25% of all corporate debt is maturing over the next 3 years.
  • $2.2 trillion of corporate debt (more than one-third) is floating rate, which means as interest rates rise, interest payments on existing debt rises, which means margin compression.
  • An early warning sign — Deutsche Bank 6% coco bond has risen to 10.3%, the highest rate since 2016. Investors expect that Germany’s biggest bank will take serious hits in the next recession.

And what about that debt… about that debt… about that debt?

As we look to the holiday shopping season, it isn’t just corporate credit that has our attention. Our Middle-Class Squeeze investing theme is front and center when we see that in the third quarter the delinquency rate on credit card loan balances spiked to 6.2% at smaller banks (the group that excludes the 100 largest). That is well above the peak of 5.9% we saw during the financial crisis. The pace of the decline is also concerning, more than doubling in the past two years from less than 3% to 6.2%. The credit card charge-off rate at these same banks was 7.4% in the third quarter and has now been above 7% for five consecutive quarters. In comparison, during the financial crisis the charge-off rate was above 7% for only four consecutive quarters. You read that right, the charge-off rate has been worse in the past five quarters than in the debts of the financial crisis.

But hold on a minute, overall credit card and other revolving consumer credit was just $1 trillion in the third quarter, which is right about where it was at its prior peak a decade ago despite a population that has grown by about 20 million people. Doesn’t that mean that consumer debt isn’t a concern? If we look at the credit card delinquency rates for the top 100 banks, things do in fact look pretty good for the consumer, sitting at just 2.5%, which is well below the over 6.5% rate in the depths of the financial crisis.

The message here is that while the banks overall are not in danger here from credit card debt, what we are seeing is that those consumers who are the most vulnerable — those with weaker credit history — are already getting into trouble with their credit cards at a time when we are being told the economy is stronger than ever. What happens to them and to the smaller banks that serve them when times inevitably get tougher?

Overall retail sales in October, when adjusted for inflation, rose just 2%, at the lowest end of the post-financial crisis range but e-commerce continues to be extremely strong, reflecting our Digital Lifestyle investment theme. Total retail sales not adjusted for inflation rose 4.6%, but eCommerce accounted for the bulk of that, rising 14.5% from a year ago.


Falling liquidity plus upcoming debt refinancing will be a headwind to earnings.

The bottom line is we are in the midst of major shifts in market dynamics. The outsized performance of the stock market relative to the weak rate of economic growth was fueled by liquidity injections courtesy of many of the world’s central banks. Now that liquidity is draining out of the global economy at a meaningful rate at a time when the US is engaging in a level of deficit spending unheard of outside of a recession or war, so we are seeing a major increase in Treasury bond issuance. That means less liquidity as we see a significant increase in the supply of new Treasury bonds. The overall US corporate balance sheet is quite weak, particularly when we remove the handful of large cash holders. With over one-third of the outstanding corporate bonds floating rate and one-quarter of all corporate bonds rolling over the in next three years, rising interest rate expenses will be adding to the rising margin pressures from the tightest labor market in decades. In other words, a headwind to EPS generation that investors and the multiples they assign to the stock market will have to contend with.

In the coming months we will be watching for any changes in fiscal policy coming out of DC to gauge the level of Treasury bond issuance. We will be watching the dynamics in corporate credit as many will need to favor shoring up their balance sheets over dividends or buybacks. For investors, this is a time to ensure that not only are the companies in which you have invested benefiting from the types of long-term tailwinds we focus on with our investing themes, but to also review the financial health of the companies in your portfolio. There will be a price to pay for the past corporate debt extravaganza.


While The Market Regained Some of Its Footing, It’s Shaky At Best

While The Market Regained Some of Its Footing, It’s Shaky At Best


Key Points from This Report:

  • Did the election matter?
  • Italy is a growing problem for the Eurozone and U.S. Investors should care
  • The rising dollar and interest rates
  • Another strong jobs report – be careful what you wish for
  • More signs that the global economy is slowing
  • The trade war with China continues with no end in sight.
  • The Market has found at least some shaky footing


Did the Election Matter?

The big news of the week was the non-news of the election, which gave both sides sufficient wins to claim victory. The market engaged in what was likely a brief “thank-God-there-were-no-surprises-this-time” rally the following day. For investors, the election means that any further tax cuts are highly unlikely and while the need for infrastructure spending is something both parties agree on, the budget process for that spending has the potential to be reminiscent of a Jerry Springer episode – let the games begin.

We’ll probably hear more threats concerning impeachment, but the election results make it unlikely that will be anything more than the usual vitriol coming out of the beltway these days. Overall the election ended up being a non-event, followed by a relief rally… but several issues remain that could complicate matters for the market and investors.


Italy is a growing problem for the Eurozone and U.S. Investors should care

Italy continues to vex both the eurozone and those pundits who insist that cooler heads will prevail. I live a good portion of my time in Italy and I can assure you, there are no cooler heads in Italy’s leadership and its citizenry are becoming more and more enraged by their governments’ endless inability to address the myriad of issues facing the nation, regardless of which party or coalition is in charge. Keep in mind that Italy faces even more challenging demographics than the U.S., (which in comparison is akin to our Aging of the Population investing theme on steroids) as its population is skewed even older thanks to insanely high youth unemployment, which drives many of the young to look outside their birth country for better opportunities.

The U.S. isn’t alone in its desperate need for infrastructure investment. Remember that bridge in Genoa, Italy that collapsed in August killing 43 people? Despite the promises in the days following the tragedy that the nation’s leadership would mobilize all available resources immediately and get a new bridge for this vital part of the region’s infrastructure up as soon as humanly possible, nothing has been done.

Not.

One.

Damn.

Thing.

And that is just a bridge. Last week the nation was hit with massive storms that caused an incredible amount of damage, inflicting even more pain on a country that is already a mess. I expect Italy will not be the one to blink first when it comes to the revised budget due to Brussels later this month. There will be a showdown with the rest of the Eurozone and it is going to get even messier.

For some perspective, just 10 years ago Luigi Di Maio, the leader of the Five Star Movement and Deputy Prime Minister, was living with his parents and working as a drinks server at the Napoli stadium. In just 10 years he’s gone from one of those guys walking around, hocking drinks from his tray, to leading Italy. Is it any wonder that the rest of Europe’s leadership isn’t exactly thrilled with Italy’s leadership choices?

Adding to the drama, France’s leader, Emmanuel Macron, looks to be struggling under all the pressure and Germany’s Angela Merkel is now a lame-duck having announced she is stepping down as the leader of her party and will not be seeking reelection. Europe is without strong leadership at a time when it desperately needs it. This is going to get worse before it gets better.

Why should investors care what happens in Italy?

The eurozone economy is nearly the size of the United States’ and Italy is both too big to save and too big to fail without putting the entire region into an economic tizzy. Italy has the potential to seriously rock the markets at a time when interest rates are rising most everywhere, and dollar liquidity is shrinking.


The rising dollar and interest rates

With global liquidity shrinking at the fastest pace since 2008, the dollar continues to strengthen, causing a variety of problems for a broad swath of market participants. The strong dollar has been causing pain in the commodity complex and those economies tied to it, for example, this week U.S. West Texas Intermediate (WTI) crude fell more than 21% from last month’s four year high. The recent strong jobs reports mean the Fed is likely to continue on its rate hike path and Thursday’s post-meeting announcement referred to a strengthening labor market and economic activity rising at a strong rate – pretty much like the Bat-signal for more hikes coming. The lack of foreign buyers of Treasury auctions is adding to rate pressures. So far in calendar year 2018, we have seen half the level of foreign buying we saw in 2017.


Another strong jobs report – be careful what you wish for

Last month businesses added an additional 250k to the U.S. workforce, well above the expected roughly 200k, but the real number would have been even more incredible had it not been for the 198k that were not at work due to weather conditions – a level three times the historical norm thanks to Hurricane Michael. Without Mike, the number would have been closer to +400k, so while Wall Street is getting serious jitters as the bears have been pacing around the major indices, Main Street is busy hiring. Break out the champagne and party hats?

Err, not so fast. As much as I love a glass of the chilled bubbly, digging into the details gets me a bit nervous to see that while construction activity has been contracting for several quarters, the sector has added 100k to its ranks since July. Contracting activity levels while growing payrolls? Not exactly good for the bottom line. The Federal Reserve’s Beige book has been a compendium of executive angst over the impact of trade wars on their businesses, but transportation services grew their ranks by 25k, the most in 13 months. This is likely because 100% of the net new jobs over the past four months have gone to those with a high school education or less. Great for the development of skills in that cohort, not so great for their employers who are experiencing lower productivity levels, which translates into earnings pressure for investors.

Cocktail Investing Podcast Episode 85We also saw wages rise +3.1% year-over in October from +2.8% in September, the fastest rate since 2009. We suspect consumers in our Middle-class Squeeze investing theme are cheering as are retailers that are gearing up for the 2018 holiday shopping season – for more on that, check out this week’s Cocktail Investing Podcast where we talk with the National Retail Federation and its consumer survey findings for holiday shopping this year.

Back to the October wage gains, we strongly suspect the Fed is watching as increased pay pressures have pulled 711k into the workforce, which pushed the labor force participation rate up by +0.02% in October. Without the new entrants into the workforce, the unemployment rate would have dropped to 3.3%, which would be the lowest level in 65 years!

So, jobs look fantastic right? Errrmmmmm, yes but… the manufacturing workweek was cut a second time by 0.2% since June to the lowest number of hours since January – could be the trade war is cutting folks’ hours. Overall, the labor market is exceptionally tight so no wonder the Fed this week announced that “The labor market has continued to strengthen and … economic activity has been rising at a strong rate,” keeping in place its plan to continue to gradually raise rates.


More signs that the global economy is slowing

While the US is still humming along, most are not paying attention to the slowing happenings outside our borders. The IHS Markit Composite PMI in the euro area dropped to a 2-year low of 53.1 in October from 54.1 in September while Italy dropped to its lowest level since November and is now in contraction territory- anything below 50 is in contraction. Germany’s real manufacturing orders year-over-year declined -2.2%. Eurozone GDP slowed to a 5-year low in Q3 of a less than +1% annual rate. The US will not be unaffected by the slowing outside its borders.


The trade war with China continues with no end in sight.

We’ve already talked a lot about this in previous weeks, so we will just leave this one with a note that China is looking to regain its place as the world’s dominant nation and its leader has his job for life. The strange events surrounding many high-profile people ranging from the leader of Interpol to actress Fan Bingbing to Alibaba’s Jack Ma give the impression that some seriously strange things are going on in the nation and perhaps the CCP leadership is looking to close ranks and tighten its grip – there is going to be a lot more to this story in the months and years to come.


The Market has found at least some shaky footing

Finally, after a brutal October, the market has managed to regain some of the ground it lost in the early days of November but let me point out that it is unusual for the S&P 500 to lose 10% or more twice in any given year. Going back roughly half a century, such double dipping typically precedes or occurred in conjunction with a recession, (with the exception of 1987 which wasn’t much fun).

As earnings season is nearing a close, corporate share buyback programs have been able to restart their purchases, helping put a (temporary?) floor under the market. I remain warry that we haven’t seen the end of this period of volatility.


October Buy-the-Dip Trick or Treat?

October Buy-the-Dip Trick or Treat?


So much for the typical October strength in equities – a month in which the major US indices historically have gained ground 75% of the time. We’ve seen major index support levels broken while earnings beats have been smaller than we’ve seen over the past year with revenue and forward guidance giving investors jitters.

Over the summer and through September we warned that this earnings season would likely be a very bumpy ride as earnings would probably be decent, but guidance would not support the market’s multiples. Our concerns have proven warranted. Overall this earnings season the average company that has reported saw its shares fall 2% on its earnings reaction day – if this keeps up it will be the worst stock performance reaction on record since 2001.

How bad has it been?

  • On Wednesday, October 24, the Nasdaq had its worst daily drop since 2011, closing the day down over 10% from its recent highs and by the close of the trading day, the Dow Jones Industrial Average and the S&P 500 had lost all their gains for the year. If the market’s close in the red again Friday, the S&P 500 will have closed down 15 days during the month thus far, the most since 2012.
  • The FAANGM stocks entered a bear market this week, losing 4.4% on Wednesday – the worst decline since August 2011.
  • The Global MSCI All World Index hit a 14-month low, in bear market territory with a more than 20% decline since the January highs, losing 11% in October alone – the biggest decline since the financial crisis. This week only 4 of the 47 countries in the MSCI all country world index were above their 200-day moving average.
  • Homebuilder stocks have fallen more than 40% from their January highs – the canary in the consumer coal mine. New home sales plunged 5.5% in September versus expectations for a -0.6% decline as the supply of homes for sale rose +2.8% (the sixth consecutive increase) to the highest level since 2008 while demand has fallen to a 2-year low. Tell me again how great that consumer is doing and how they might contend with 5% mortgages? As those homes become more expensive to purchase, fewer Middle-Class Squeeze consumers will be filling out a mortgage application.
  • The only two S&P 500 sectors in the green this month are defensive – Consumer Staples (+1%) in the midst of its longest winning streak since November 2009 and Utilities (+3%). Even one of the must-have lifelines for our Digital Lifestyle investing theme mobile service wasn’t a safe haven as AT&T (T) shares fell some 9% this week hitting a new 52-week low in the process.
  • This week the Russell 2000 small cap index fell over 15% from its highs, closing Wednesday just 5 points away from a new 52-week low.
  • After spending 262 consecutive days above its 200-day moving average, oil closed this week below that marker. Streaks of such magnitude have only happened two other times over the past 30 years – April 10, 2000, which ended a 272-day streak and September 2, 2008, which ended a 330-day streak. Those dates are worth noting.
  • The first 18 trading days in October have seen a daily open to close loss 83.3% of the time, besting the previous 75% record in September of 2000. If the market rallies from open to close on the next 4 trading days, October’s closed in the red versus open will be 65.2% of days – the worst for any single month since October 2008 which was at the height of the financial crisis – and that is the very BEST we could hope for.

Investors are taking note with the weekly sentiment survey from AAII reporting that bullish sentiment fell to 27.9% from 34%, the fourth weakest reading for bullish sentiment this year. Bearish sentiment rose from 35% to 41%, the highest reading since the last week of June. Other indicators, such as the CNN Fear & Greed Index which fell to Extreme Fear (6) this week from Greed (64) a month ago, also point to increasing investor unease.


What is driving all this is the market starting to sync up with the reality of geopolitics and economics.

  • The era of central bank continual infusions of liquidity is over. The flow has not only stopped, but in the case of the US, reversed course.
  • We are facing trade wars and tariffs. The recent Federal Reserve Beige book was packed full of executives complaining about the impact of such on their businesses.
  • A decent portion of the domestic economic acceleration has been thanks to unsustainable fiscal deficits. The market is just starting to figure that out as the headlines move from cheerleaders to more rationale skeptics. Our Safety & Security investing theme is making headlines as a solid portion of growth has been driven by increases in defense spending which shifted from an average annual -2.1% rate of decline from June 2009 to March 2017 to a +2.9% average annual rate of increase since April 2017.
  • The Italian problem is not going away. It is too big to save and to say its current leadership is incompetent is putting it mildly, (as someone who lives a good portion of my time in Genoa of the collapsed bridge fame) and the clock is ticking on its sovereign debt bomb. As an example of the breathtaking level of incompetence, after two months basically no progress has been made on replacing that bridge despite its vital importance to not only Italy’s economy but to the greater Eurozone given its link to a major port.
  • China is in a full bear market, its economy is saddled with a staggering level of debt, and the Chinese yuan has dropped to its lowest level versus the dollar in a decade. We are watching these and other data points with an eye toward our Rise of the Global Middle-Class investing theme.
  • Geopolitical tensions are mounting around the world and the current Saudi situation highlights just how much the balance of global power is shifting.


The big question is where do we go from here?

Just 13% of stocks in the S&P 500 are above their 200-day moving average – these are mostly in the aforementioned Consumer Staples and Utilities sectors. This level has only occurred a few times in the past, marking just how oversold near-term the market has become. There is not one Energy or Industrial sector stock above its 50-day moving average. Rebounds are to be expected with such near-term oversold conditions.

Looking at the economics, the Citigroup Global Economic Surprise Index has been in negative territory, (meaning more data coming in below expectations than above) since April – the longest stretch in 4 years. The October Eurozone PMI fell to a 25-month low. Back in the US, the Richmond Federal Reserve local business conditions index for services hit a 7-year low, similar to what we’ve seen on the manufacturing side.

The employment situation is increasingly worrisome. The Richmond Fed’s wage expectations index for 6 months out recently jumped dramatically up to a level not seen since March 2000 as the available pool of labor has dropped to an 11-year low. Looking at who has been getting jobs recently, 70% of job gains over the past 6 months and 100% over the past 4 months have gone to folks with just a high-school degree or less. While we love to see more people getting jobs, from the corporate side of things, that means that companies are having to hire those with the weakest skill set. Great for the person getting a job as they can now develop more skills, but brutal for the employer who is facing weaker productivity as a result – that hurts earnings which are already facing rising costs from tariffs and trade wars as well as rising interest rates.

The bottom line is we are likely to see some interim rebounds, but it doesn’t look like the market is yet in sync with global realities. We have been pointing out for months that US stocks indices have been outperforming the rest of the world to a degree that was simply not sustainable.

The market is starting to appreciate the magnitude of the fiscal stimulus economic sugar high, that trade wars aren’t so easily won, that geopolitical risks are material, that the change in central bank liquidity flows matters and that future earnings growth is likely slower. We haven’t even gotten started when it comes to the fireworks I’m expecting from the Italian situation. We are likely to see the occasional rebound, but my money is that more pain is yet to come. That is great news for those that are focused on solid, long-term investing themes like the ones we have developed at Tematica Research, and have a shopping list of stocks ready for the bargains that will be coming our way.