Consumer Sentiment Closer to Economic Reality than Blankfein?
The CEO and Chairman of Goldman Sachs (GS), Lloyd Blankfein, is arguably one hell of a sharp fellow, which leads us to believe there are reasons behind this that go beyond a straightforward assessment of the economy.
![]()
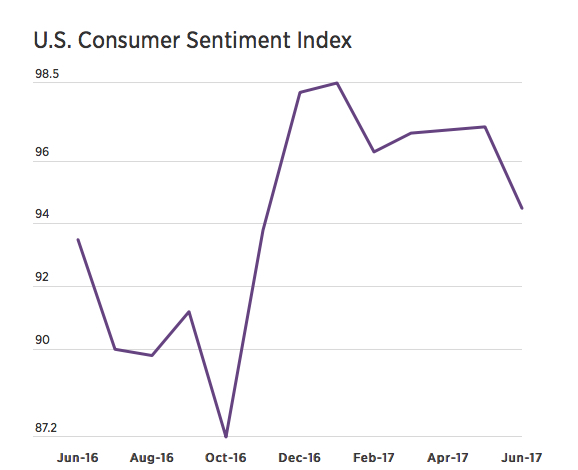
Perhaps consumers see something different than what we hear in the mainstream financial media. The University of Michigan’s Consumer Sentiment Index dropped to 94.5 in June, which was well below expectations for 97.1.
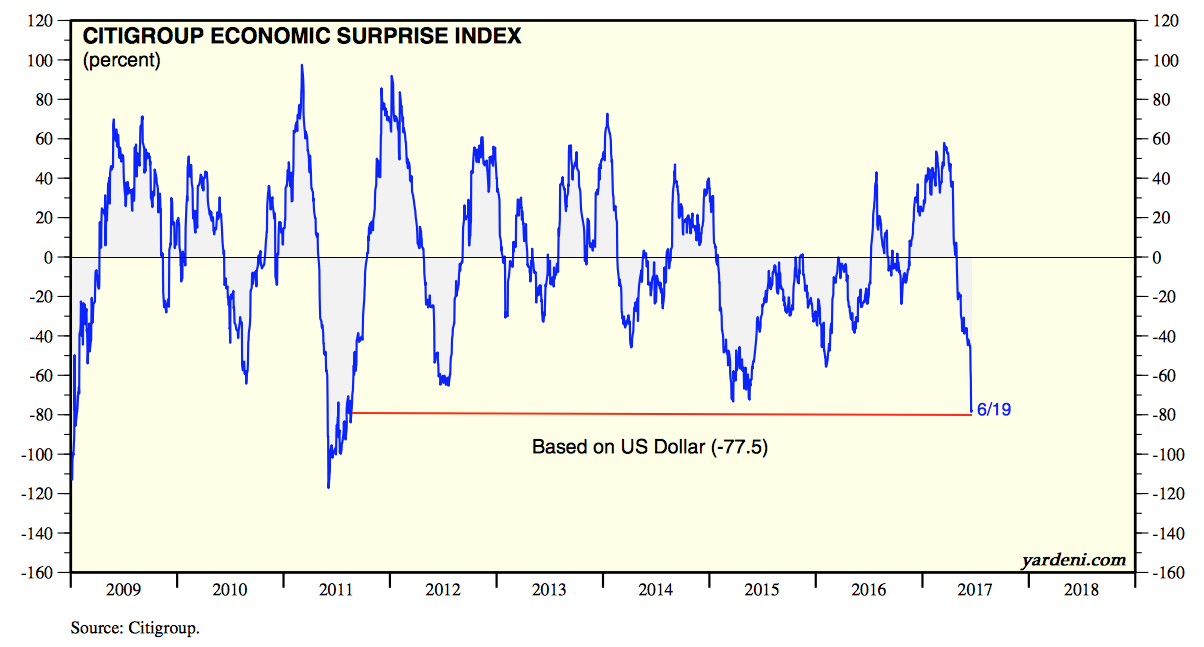
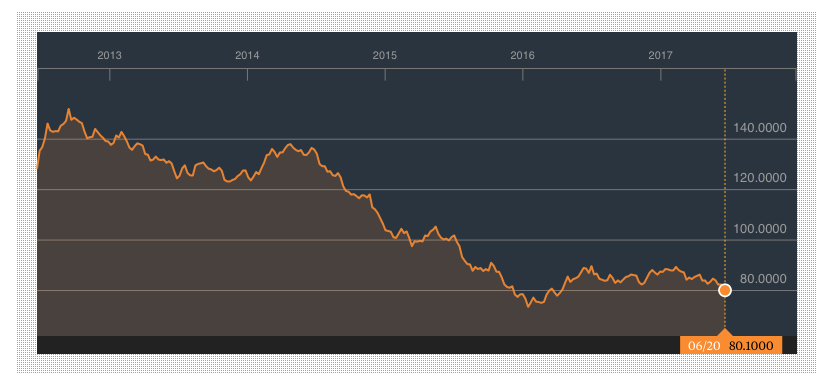
Let’s start with a look at the Citi Economic Surprise Index, better known at the “CESI,” which has hit a multi-year low.
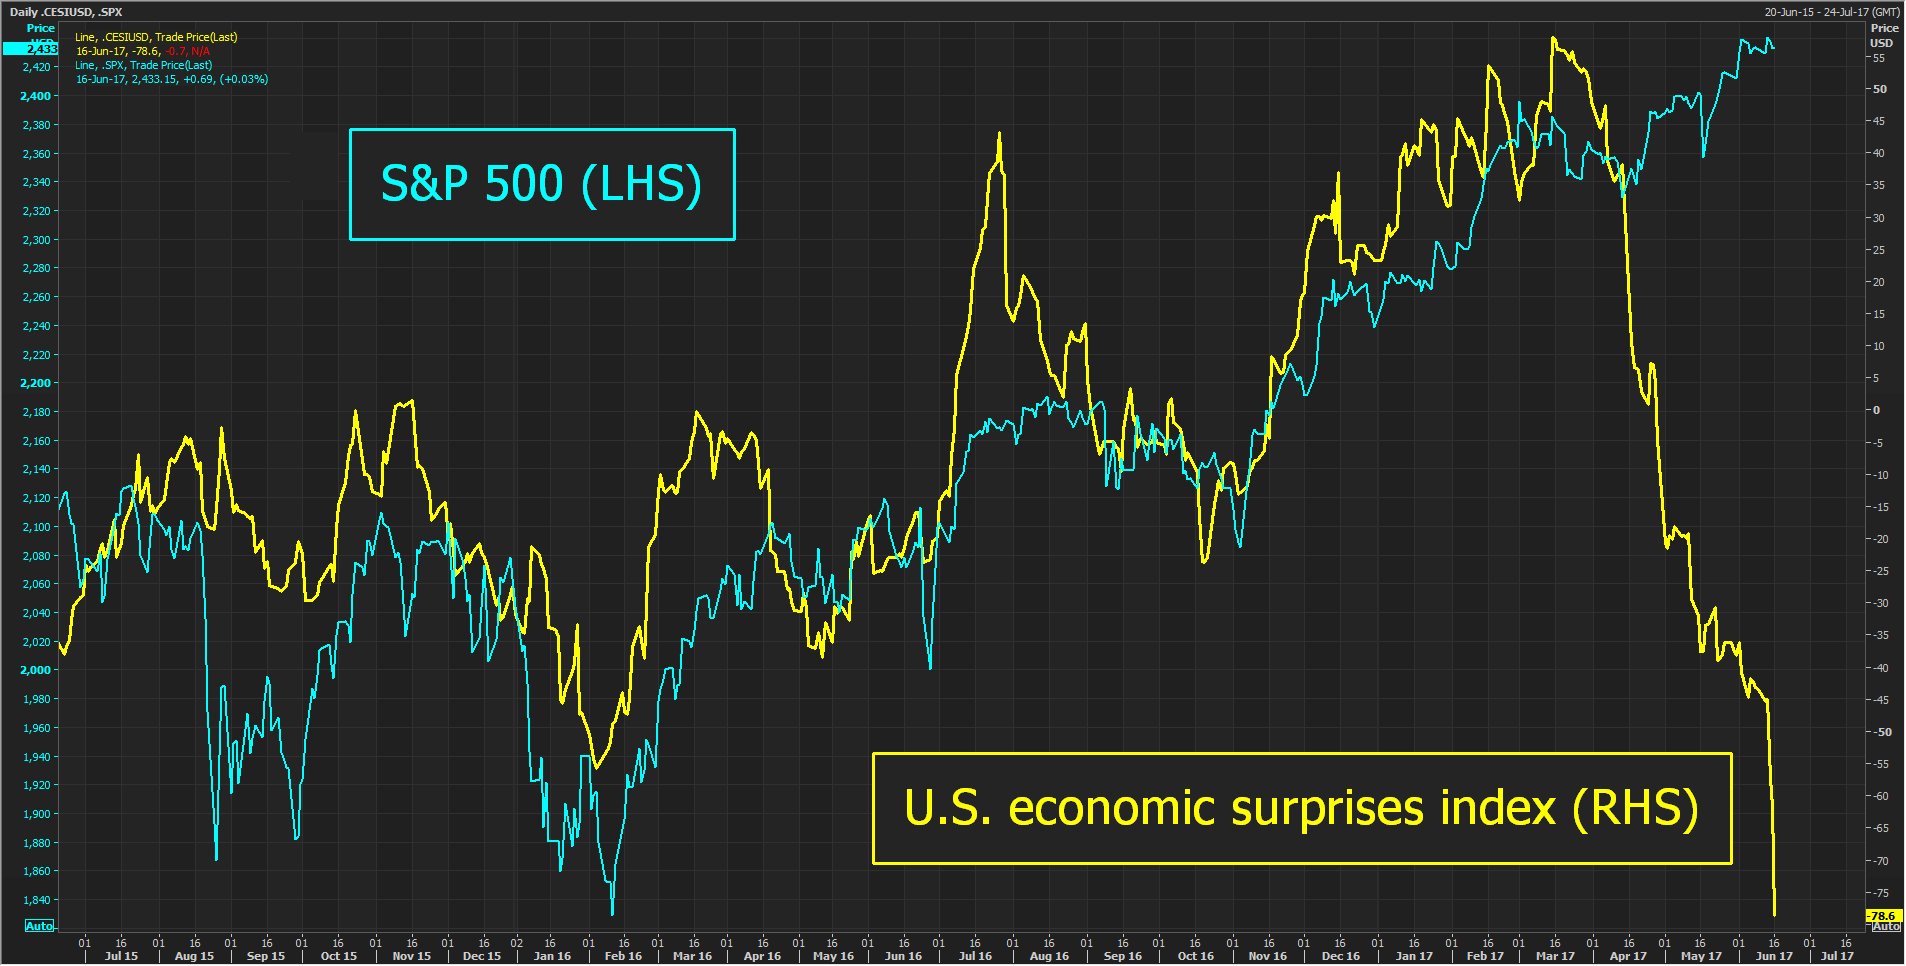
While US stocks look to have decoupled recently from this measure.
But we’re sure that stock prices aren’t anything to worry about. 🙄
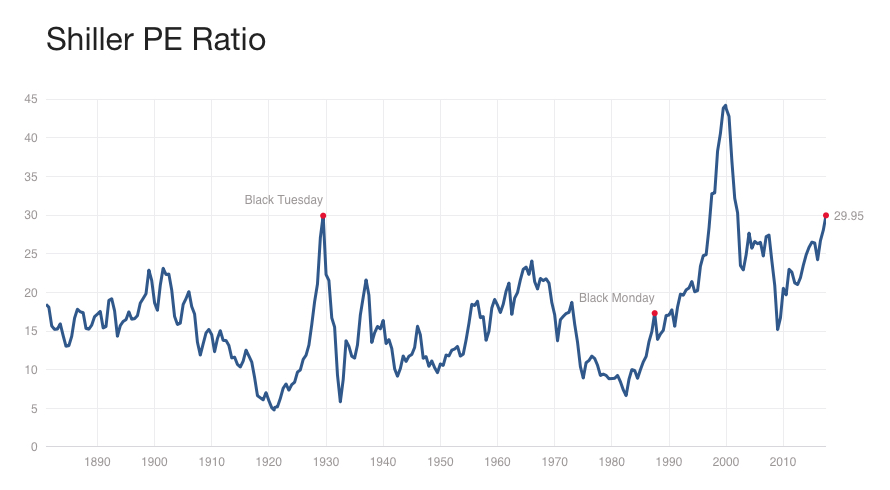
The Cyclically-Adjusted Shiller P/E ratio today sits at 29.95, just shy of the 32.54 peak from 1929. The fact that this metric has only been at these levels twice in history, just prior to the Stock Market Crash of 1929 and again before the bursting of the DotCom bubble, is likely immaterial – so say those who derive their paychecks from investors staying fully invested. 🙄🙄
One other thought for those so inclined, in 1929 the Fed rate was at 6 percent – that’s a lot more room to move than we have today.
As we head into the summer driving season, US crude oil stockpiles declined much less than expected while gasoline inventories have actually increased over the past two weeks versus expectations for a decline. Gasoline stockpiles are now above the 5-year average for this time of year as gasoline demand has unexpectedly fallen to well below last year’s level.
According to a recent Bloomberg study, back in March, 31 percent of economists were boosting their GDP forecasts. Today 27 percent are cutting them.
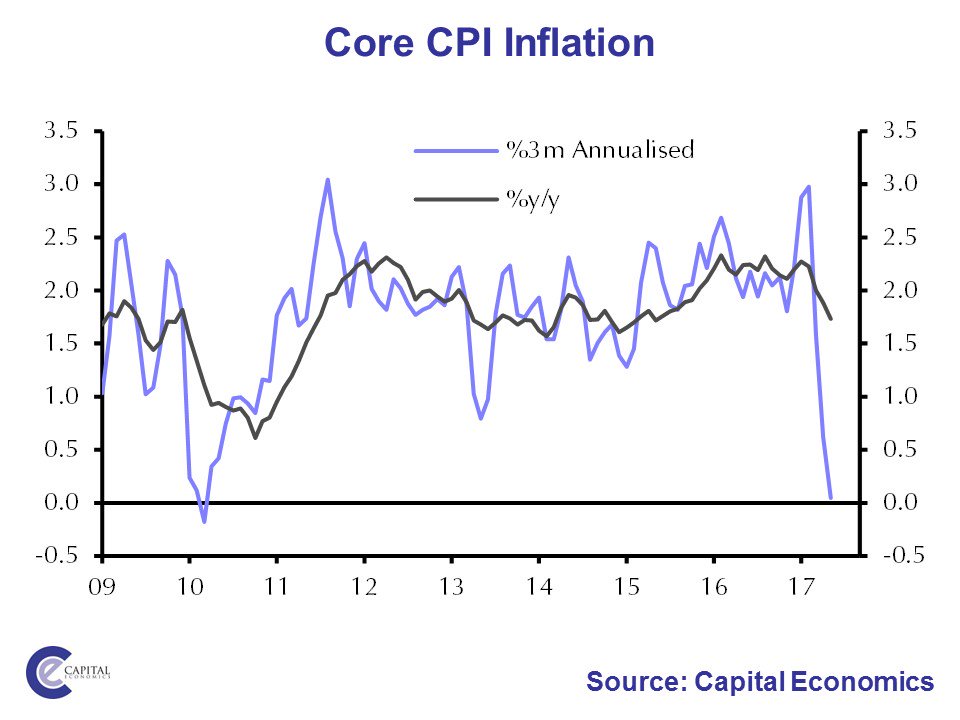
US CPI recently disappointed to the downside, coming in at 1.87 percent versus expectations for 2 percent. Core CPI came in at 1.73 percent versus expectations for 1.9 percent and the 3-month moving average of year-over-year change for Core CPI indicates that this key measure of inflation is rolling over to an impressive degree. This puts that Fed rate hike into a different light!
Used car and truck prices have rolled over hard and are continuing to drop significantly.
Housing has also rolled over, both for multi-family…
and single family…
According to the U.S. Commerce Department, housing starts declined 5.5 percent in May, after falling in April and March. Building permits fell 4.9 percent.
The cost of putting a roof over one’s head rolling over has rolled over as well.
The cost of medical care has also rolled over.
While retail sales growth is still pretty decent, it has been declining since early 2015.
Restaurants and bars are having a hell of a tough time, with their businesses experiencing a more severe decline, over the past two years.
Manufacturing inventories remain frustratingly elevated. That is basically capital sitting on the shelves, earning nothing and in many cases wasting away.
With elevated inventory levels, not a big surprise to see that U.S. factory output fell in May as manufacturing production dropped 0.4 percent, the second decline in the past three months. Overall factory output was lower in May than in February. Output fell across a wide range of industries, from motor vehicles and parts production to fabricated metal. Manufacturing capacity utilization fell 0.3 percent in May with overall industrial capacity utilization falling 0.1 percent. Where’s the accelerating growth?
There is some good news for a segment of the economy. Online sales continue to command a greater and greater portion of retail sales as our Connected Society intersects with the Cash Strapped Consumer where online shopping is not only fun from one’s couch, but it is a lot easier to compare prices and get the best deal for families concerned with watching their pennies in an economy with weak-to-no wage growth.
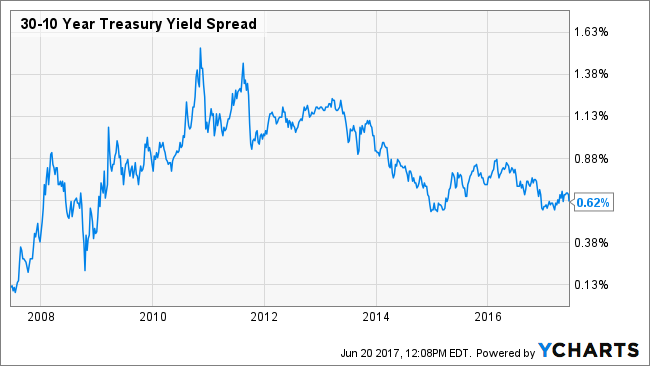
The bond market is not telling a tale of accelerating growth, with the 30-year Treasury yield now back where it was in November.

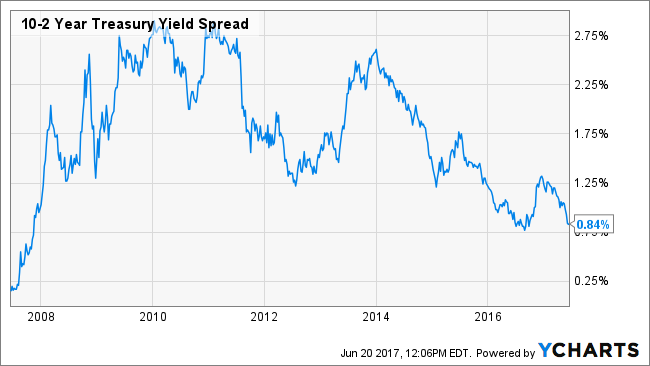
While the 10-2 Year Treasury yield spread is back down to where it was in late 2007.
The 30-10 Year Treasury yield spread is also showing a flattening yield curve – more signs of an economy that is do anything but accelerating to the upside.
Finally, we have the Bloomberg Commodity Index heading back towards those lows from early 2016, not exactly an indicator of accelerating demand.
Here at Tematica, we are a fairly jovial bunch, with innately optimistic personalities, but we let the data first do the talking and that data is giving us a plethora of warning signs.
Turns out, we aren’t alone in our skepticism as the New York Federal Reserve now expects the economy to grow at an annualized rate of just 1.9 percent in the second quarter!