

GDP views dim, valuations stretch, and Friday’s data sets will set the tone for April
We hope you enjoyed the Easter holiday weekend, and all that it entailed — from some fancy hats for the ladies to all the candy and chocolates for the youngsters. We had our share of treats, as well as an extra day to get ready for the week ahead with last Friday’s market holiday.
It’s one that promises to be rather busy, especially on the economic data front, but before we get to that, let’s tackle some of the high points from last week’s shortened market that brought an end to the recent rally.
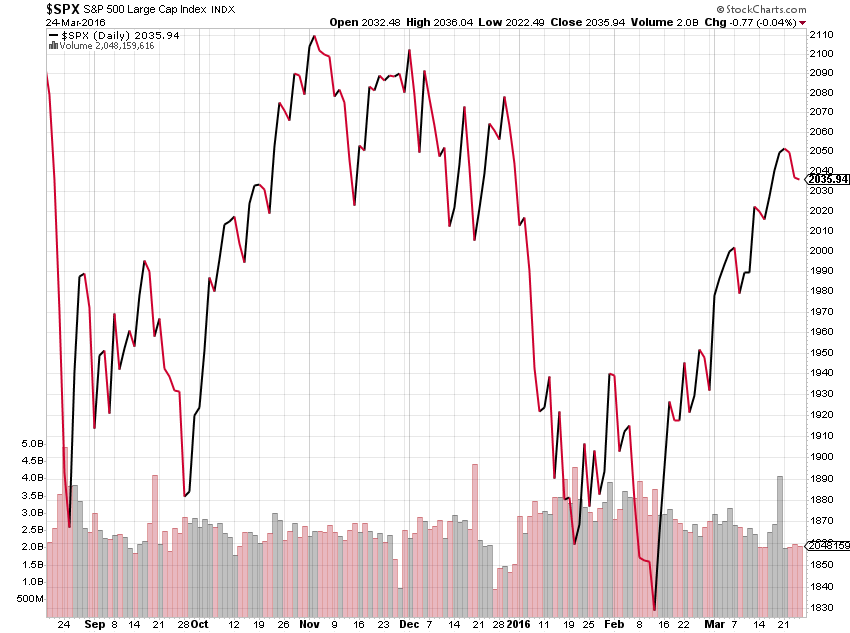
Last week started off on a somber note following the bombing in Brussels. It wasn’t until oil prices fell amid news that oil inventories jumped higher according to weekly data from the Energy Information Administration, combined with hawkish commentary from St. Louis
Fed President and FOMC voting member James Bullard suggesting than an April rate hike is not off the Fed’s table, that the S&P 500 set a southern course for the week (see chart right). All told for the shortened holiday week, despite Thursday’s late afternoon rally back, the S&P 500 fell 0.8 percent, bringing the index back into the red for 2016.
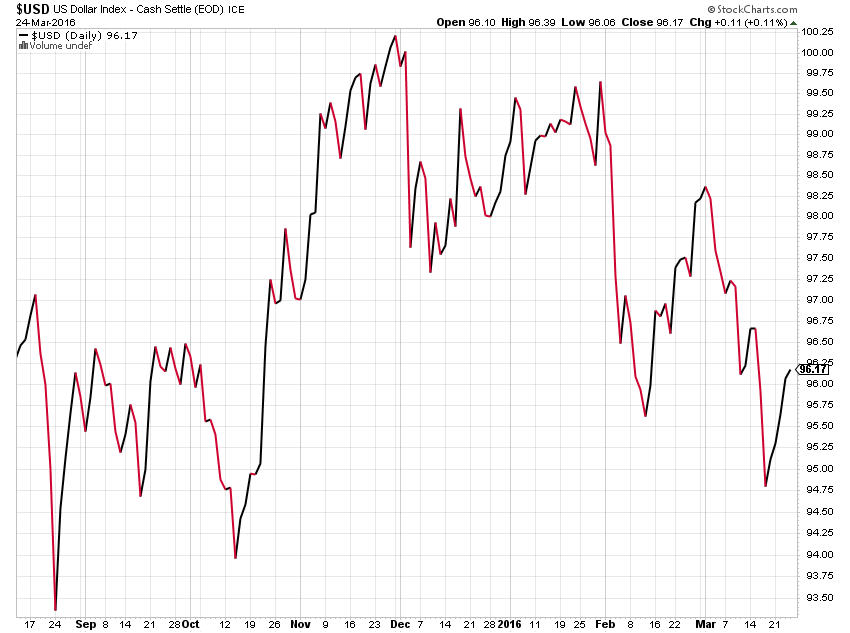
Bullard’s comments, which seem to be in the minority if one looks at the economic data, also served to reignite the US Dollar. This was a positive for several positions we’ve recommended to Tematica Pro subscribers, and comments from Nike (NKE) last week remind us that currency headwinds will weigh on upcoming quarterly results. Should Bullard’s rumor mongering prove to be correct, the US Dollar will continue to be a thorn in the side of corporate America as the European Central Bank’s latest stimulative efforts get underway in the coming days (see chart below).
To us here at Tematica, Bullard’s hawkish tendencies have gotten the better of him over the last few quarters, but even so, we will be listening to both Fed Chairwoman Janet Yellen and Chicago Federal Reserve Bank President Charles Evans when they speak to the Economic Club of New York (March 29th) and the Forecasters Club of New York (March 30th), respectively.
From a stock market perspective, even after last week’s modest retreat for the S&P 500 and the Dow Jones Industrial Average, the indices have had a strong run over the prior weeks. Some would argue the market was due for a pullback; however, given the deterioration in earnings expectations we’ve talked about over the last few months combined with the market run- up, valuations metrics, particularly those from a growth perspective, have gotten stretched.
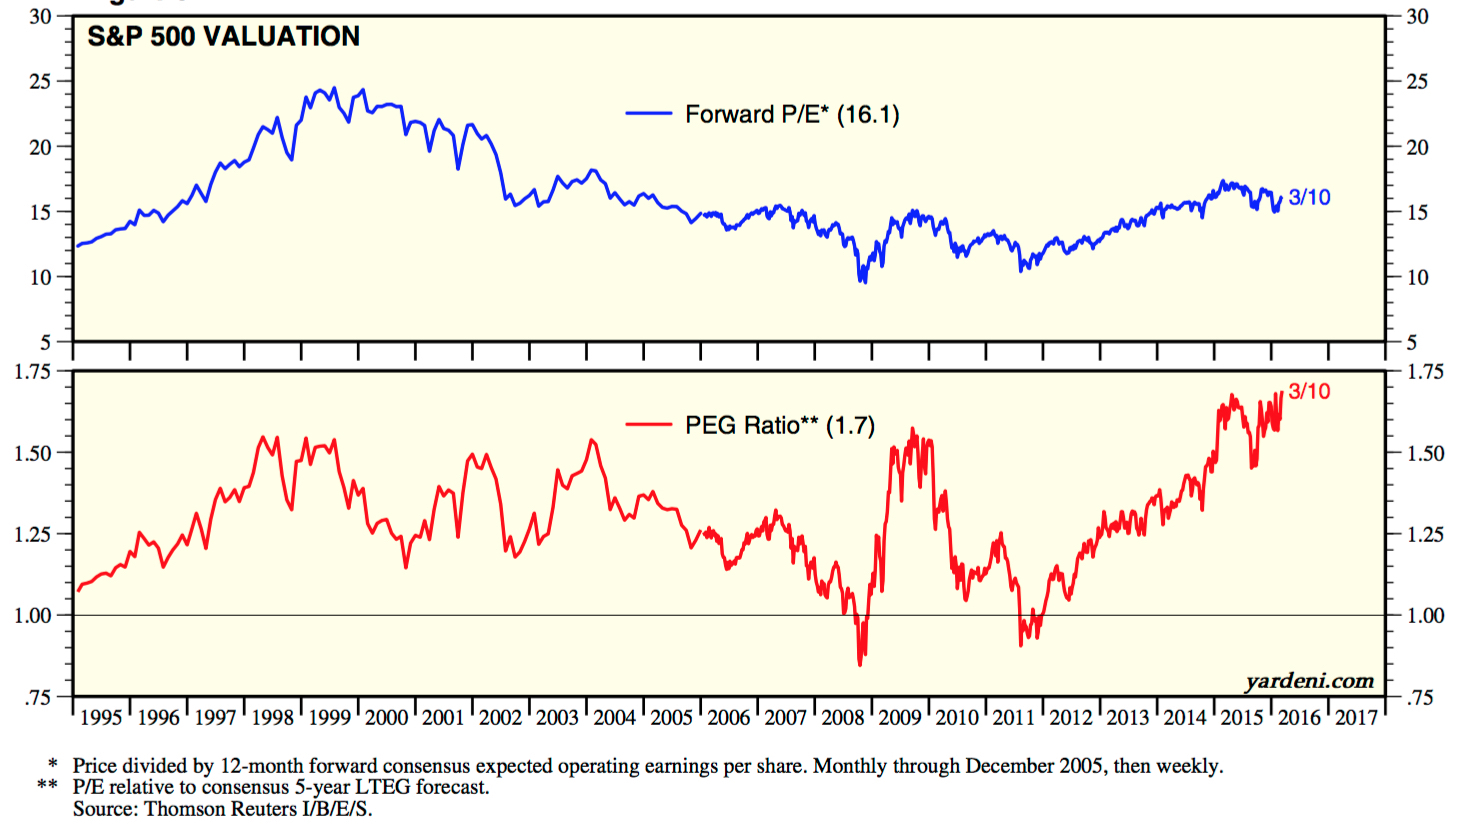
As of last Thursday’s market close, the S&P 500 was trading at 16.9x expected earnings of $120.64 for 2016, up a paltry 2.8 percent year over year. Viewed from a Price to Earnings Growth (PEG) perspective, the index is near record highs (see chart below), and has us thinking there is room for the market to move lower near- term as growth expectations for the coming quarter catch up with economic data points published during the March quarter.
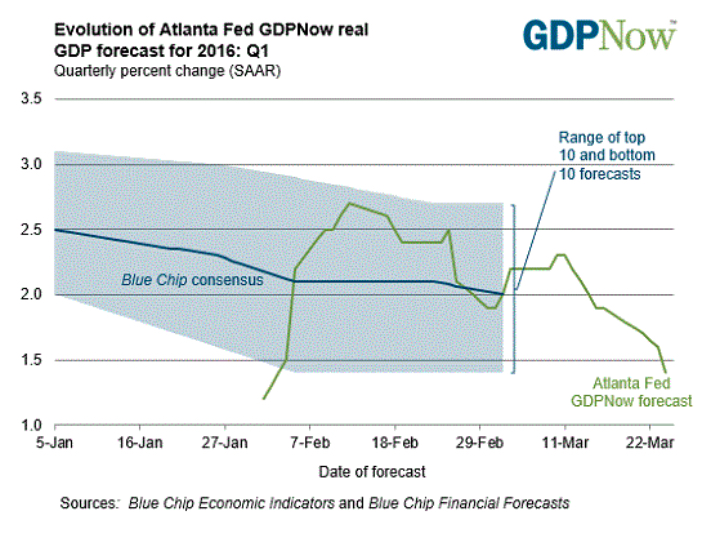
As you can see in the graph to the below, GDP expectations for the March quarter have round tripped to 1.4 percent as of March 24 per the Atlanta Fed, a level that was last seen in late January. One of the biggest reasons for the move lower was last week’s weak February Durable Orders report from the U.S. Census Bureau, which led to a forecast for first-quarter real equipment investment growth from 0.9 percent to -1.4 percent.
Turning to the Week Ahead
As we near the end of March — and therefore the March quarter — we will start to get more clarity on how both the domestic and global economies have faired. As we saw above, the latest data can make all the difference in the expected vector and velocity of the economy, which means we’ll be paying attention to a number of key data points this week. Among them is the February Personal Income and Spending Report. Because we live in a consumer led economy, it means understanding the consumer’s ability and willingness to spend is crucial.
Over the last few quarters we’ve witnessed the personal savings rate move higher (between 5 to 5.2 percent over the last several months) even though incomes have been relatively unchanged. We’ve not seen the incremental “big gas savings” translate meaningfully into spending as evidenced by weak Retail Sales reports. After doing some digging, it’s somewhat easy to understand — since 1960, the average saving rate is 8.3 percent, while from 1960 through 1995 it averaged about 10 percent, which means the current personal savings rate is still incredibly low by some historic standards.
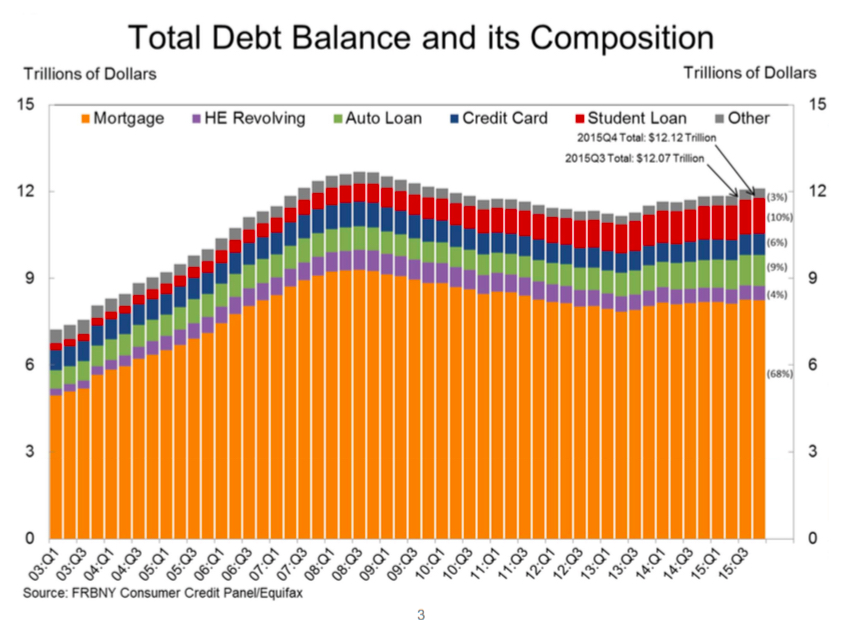
At the same time, according to Fitch Ratings, the rate of seriously delinquent subprime car loans soared above 5 percent in February — that’s worse than during the Great Recession and the highest level since 1996. Paired with findings from the Federal Reserve Bank of New York (see chart right) that total household indebtedness was $12.12 trillion exiting 2015, a $51 billion (0.4 percent) increase from the third quarter of 2015, this tells us The Cash Strapped Consumer is alive and well.
The downside is there is a high probability we will continue to see restrained consumer spending levels without any pronounced pick up in wages. However, given the impact of
the Affordable Care Act and stronger dollar that is hampering competitiveness of domestic companies… you see where we are going with this.
While we’ll be watching the February Personal Income and Spending Report that is released on Monday, it means digging into the wage and hours worked data as well as overall job quality found in Friday’s March Employment Report. Despite the noise around the unemployment rate, we have yet to see any meaningful pick up in wages or sustained creation of quality (higher-paying) jobs. While we want to be optimistic for what we will find in the March Employment Report, we aren’t exactly holding our breadth.
Also on Friday, the Institute for Supply Management (ISM) will report its findings on the industrial and manufacturing economy in the US. Aside from March production data and order data that offers a first look at April, the report also sheds light on hiring trends, wages and inflation – in other words, a second set of data to balance against the March Employment Rate.
Both before and after these two reports hit Friday’s market tape, Markit Economics will publish a number of March Manufacturing PMI reports for the China, Japan, the Eurozone and the US. These should help fill in the remaining blanks on the current quarter, but based on what we’ve seen so far we are not expecting anything dramatically different than what we have seen thus far. That said, we will let the data “talk to us” rather than superimpose our view on the data — a common investor pitfall as we saw in the evolving Atlanta Fed’s GDP Now forecast for the March quarter.
As we mentioned a few paragraphs above, before the week is out, we close the books on the March quarter, and that means before too long we will be inundated with corporate earnings. While some will take solace in the slower pace, to us it means collecting the data points we can from the corporate earnings that will happen this week to get ready for what will be akin to drinking from the fire hose before too long
Here are the corporate earnings reports that have caught our thematic eye this week:
- Affordable Luxury: Nike (NKE), PVH Corp. (PVH), Finish Line (FINL), Signet Jewelers (SIG)
- Cash Strapped Consumer: Five Below (FIVE), Fred’s (FRED), General Mills (GIS)
- Cashless Consumption: On Track Innovations (OTIV), Payment Data Systems (PYDS)
- Connected Society: Sigma Designs (SIGM)
- Content is King: GameStop (GME),
- Economic Acceleration/Deceleration: Blount International (BLT)
- Fattening of the Population: Krispy Kreme Donuts (KKD)
- Foods with Integrity: The Fresh Market (TFM)
- Rise & Fall of the Middle Class: Iconix Brands (ICON), Jarden Corp. (JAH),
- Safety & Security: Elbit Systems (ESLT)
- Scarce Resources: Connecticut Water Service (CTWS)
| ECONOMIC CALENDAR, MAR. 28 – APR. 1, 2016 | ||
| DATE | REPORT / SPEECH | DATA |
| 28-Mar | PCE Prices | Feb |
| 28-Mar | Personal Income | Feb |
| 28-Mar | Personal Spending | Feb |
| 28-Mar | Pending Home Sales | Feb |
| 29-Mar | Case-Shiller 20-city Index | Jan |
| 29-Mar | Consumer Confidence | Mar |
| 30-Mar | MBA Mortgage Index | 26-Mar |
| 30-Mar | ADP Employment Change | Mar |
| 30-Mar | Crude Inventories | 26-Mar |
| 31-Mar | Challenger Job Cuts | Mar |
| 31-Mar | Continuing Claims | 19-Mar |
| 31-Mar | Initial Claims | 26-Mar |
| 31-Mar | Continuing Claims | 19-Mar |
| 31-Mar | Chicago PMI | Mar |
| 31-Mar | Natural Gas Inventories | 26-Mar |
| 1-Apr | Average Workweek | Mar |
| 1-Apr | Nonfarm Payrolls | Mar |
| 1-Apr | Nonfarm Private Payrolls | Mar |
| 1-Apr | Unemployment Rate | Mar |
| 1-Apr | Hourly Earnings | Mar |
| 1-Apr | Unemployment Rate | Mar |
| 1-Apr | Average Workweek | Mar |
| 1-Apr | Hourly Earnings | Mar |
| 1-Apr | Construction Spending | Feb |
| 1-Apr | ISM Index | Mar |
| 1-Apr | Michigan Sentiment – Final | Mar |
| 1-Apr | Construction Spending | Feb |
| 1-Apr | Michigan Sentiment – Final | Mar |
| 1-Apr | Auto Sales | Mar |
| 1-Apr | Truck Sales | Mar |