
Markets Reach New Highs, But Why?
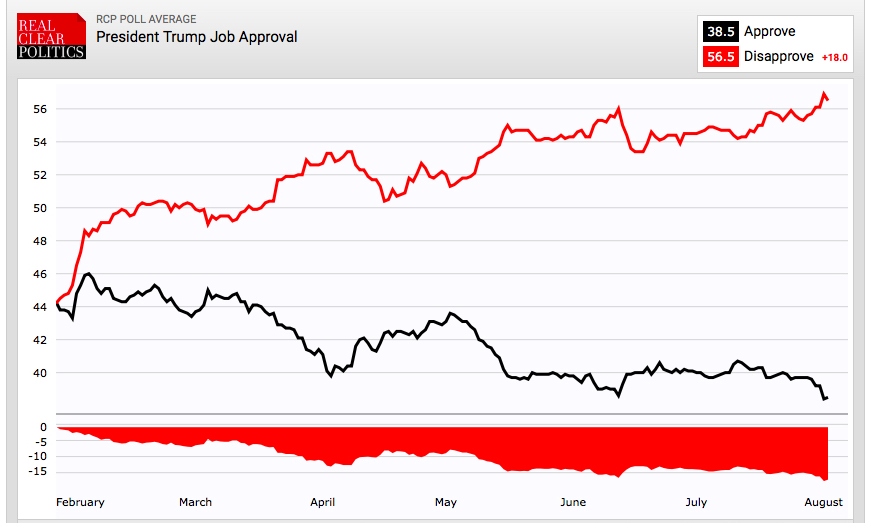
At Tematica, we separate our politics from our analysis to be able to provide objective assessments, which means that we need to call out an error we see in the prevailing narrative. Thursday the Dow hit its 7th straight record close, despite the news that Special Counsel Mueller has impaneled a grand jury in the Russia election tampering probe. While many are attributing the market’s gains to president Trump’s administration, this divergence calls that into question. As does the reality that President Trump’s approval rating has hit new lows with disapproval ratings reaching new highs while the market has continued to rise.
The reality is that in the past 6 weeks, the median stock price and median sector price haven’t actually moved. What has happened has been a falling U.S. dollar, which is on track for the weakest annual performance in 14 years. That’s really something in light of the prevailing narrative that assures us the U.S. economy is going like gangbusters. Ignore that recent ISM report which saw Services experience the biggest drop since November 2008 – same goes for the Composite Index. Amazing to have a falling dollar and the U.S. Treasury 10-year yield right around where it was during the depth of the Great Recession while the Fed is tightening and yet we are to believe the economy is firing away, hmmm.
The top three stocks in the Dow for foreign revenue, Apple (APPL), Boeing (BA) and McDonalds (MCD) account for 50 percent of the Dow’s year-to-date gains, hmmmm.
So what’s going on here?

Euro to US Dollar Exchange Rate data by YCharts
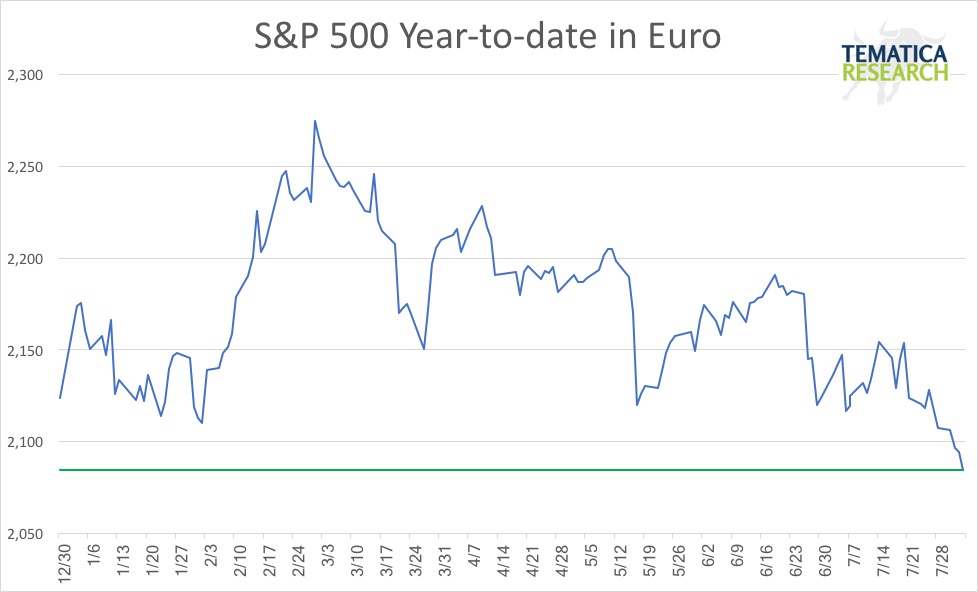
In euro terms, the S&P 500 is actually down 1.9 percent year-to-date. In Mexican peso terms it is down around 4 percent and even in the polish zloty it is down roughly 5 percent.
In fact, when President Trump was elected, the U.S. stock market capitalization represented 36 percent of total global market capitalization. That ratio rose to nearly 38.5 percent but has since fallen to 35 percent where it was all the way back in June 2015. On a relative basis, the U.S. stock market has significantly outperformed. What we are seeing here is more a function of a falling currency that a rising stock market reflecting a robust economy.
What could go wrong? The Intercontinental Exchange now has a net short position for the U.S. dollar for the first time since May 2014 and after that time the greenback gained 5 percent within 3 months. If the market has been rising on a falling dollar….
Then there is that debt ceiling debate that, when taking into account recent dynamics in D.C. between various members of Congress and the White House, could make Game of Thrones appear rather tame. This coming at a time when the tax reform debate is set to kick off. Oh and there are those November elections to really bring out the softer side of politics. With the Chargers no longer playing in San Diego this Fall, (What the hell?) I think I’ll have more than enough games to watch coming out of Washington.