Category Archives: News

Macy’s Margins Harbinger of What’s to Come as Amazon Flexes Its Apparel Muscles

Macy’s Margins Harbinger of What’s to Come as Amazon Flexes Its Apparel Muscles


Yesterday Macy’s (M) warned that its gross margins are likely to come under pressure in the balance of 2017, which in our view serves as a reminder of the more than challenging retail environment that is a direct fallout of our Connected Society and Cash-Strapped Consumer investing themes. With many households living paycheck to paycheck, consumers want the best price possible and the Connected Society makes price comparison easier than ever, leaving retailers with less and less pricing power while at the same time minimum wage hikes shrink margins even further.

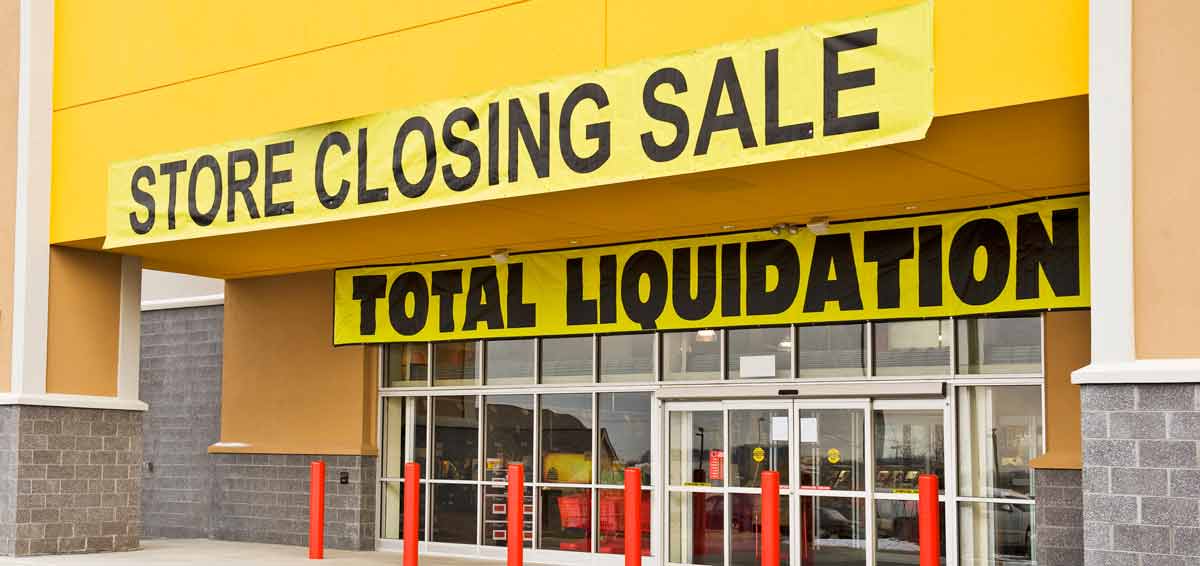
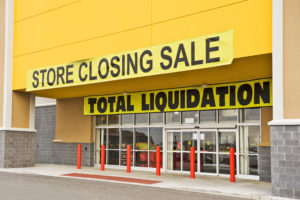
We’ve had other reminders in the last few days of the profound impact of these themes, including Sears (SHLD) closing an additional 72 locations on top of the 180 it announced earlier this year. In sum, these closures will shrink the Sears footprint to roughly 1,200 locations compared to 2,073 five years ago. One-time high flying Affordable Luxury investment theme retailer Michael Kors (KORS) not only recently shared it would shut 125 full-price locations over the next two years, but it guided same-store comps and revenues lower for the coming quarters due to decreased mall traffic and increased promotional activity.

These are just the latest in a series of data points that confirm the current bout of “retail-megaddon” has legs into the all-important holiday-filled second half of the year. Those same data points also confirm our short position thesis in Simon Property Group (SPG). Over the last few years, we’ve seen shoppers increasingly switch to digital commerce, with both online and mobile shopping, at the expense of brick & mortar retailers. While many will rightfully jump to Amazon and its Prime service that has compressed delivery time to customer significantly, other retailers ranging from Nike (NKE) to Under Armour (UA), Williams Sonoma (WSM) and Nordstrom (JWN) are embracing the direct to consumer (DTC) model — some with more success than others.


Yet Another Thematic Tailwind for Amazon

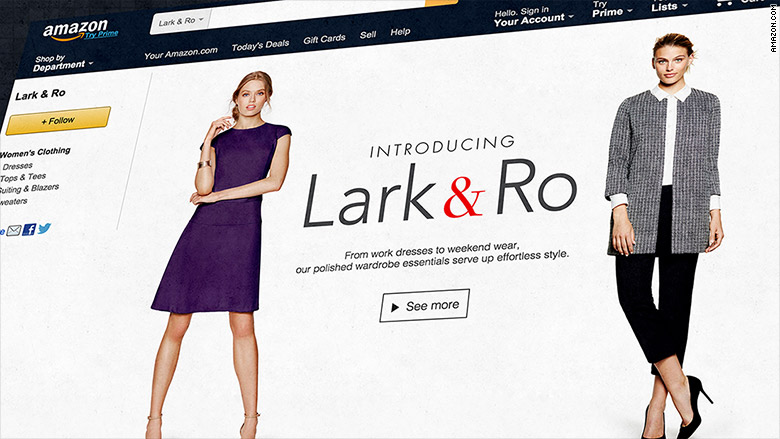
We expect to see a continued shift in retailers from brick & mortar to digital, much like we’ve seen at Macy’s and others, but here’s the thing that is likely to hit apparel retailers – Amazon flexing its muscles as it moves into apparel. Even though Amazon has cancelled its Style Code Live show, which served to tout products for shoppers to buy on Amazon, in 2016 it registered the most apparel sales of any online retailer in the US for the 18–34 demographic with more than double the market share of second place Nordstrom.

Clearly, Amazon is looking to leverage the reasons cited by shoppers for switching to Amazon – Prime, convenience, customer service, and reviews – and earlier this year it launched several private label apparel brands with products in men’s accessories, women’s dresses, and handbags followed by its own line of lingerie in April. The company’s latest effort to goose its apparel position can be found in its latest Alexa powered device, the Echo Look, which is, “a gadget with a built-in camera that is being marketed as a way to photograph, organize and get recommendations on outfits.” As part of its recommendation services, no doubt the Echo Look will recommend not only brands that can be bought on Amazon, but more than likely it will include its private label products as well.

To us, the question is not will Amazon succeed in apparel, but rather, is it tracking ahead of expectations? Research firm Cowen & Co. shared its expectations for Amazon apparel sales to account for 8.2 percent of the domestic apparel market this year, up from 6.6 percent in 2016, and 16.2 percent by 2021. To help put some context in and around those percentages, apparel is one of the biggest US retail categories with estimates sizing it up as high as $300 billion. Each market share point gain by Amazon equates to an additional $3 billion in annual revenue for the company — yes, that’s billion with a b.

And while that $ 3 billion in revenue equates to 1.5 to 1.8 percent of expected 2017-2018 revenue for Amazon, it also equates to:

  • 12 percent of Macy’s (M) total expected revenue this year
  • Roughly half of what Wall Street expects Dillard’s (DDS) to generate in revenue this year
  • More revenue than Bon-Ton Stores (BONT) is forecasted to collect this entire year across is 270 stores and 25 million square feet.

Again, that’s each market share point, and Cowen’s forecast calls for Amazon to gain more than 1.5 percentage points in 2017 alone. To paraphrase one time presidential candidate Ross Perot, that giant sucking sound you are hearing is brick & mortar retailers going down the drain.

Back to the topic at hand, the bottom line is Amazon’s apparel market share gains, revenues and profits as part of our Connected Society and Cash-Strapped Consumer investing themes will only exacerbate retail-meggadon, likely leading to even more vacant retail space in malls across the U.S. Spurring this along is a consumer that is increasingly strapped with high and likely raising debt levels combined with little in the way of wage gains. This one-two combination of our Cash-strapped Consumer and Connected Society investing themes paints a not so pleasant picture of fewer retailers and empty storefronts with potentially more people unemployed.

Lastly, as retailers go down the drain, our thematic lens also looks to what could also be washed down with it. We’re talking about the large chain restaurants that tend to favor retail centers, the likes of Darden Restaurants (DRI), Brinker International (EAT) and Bravo Brio Restaurant Group (BBRG) just to name a couple. How those groups pivot to attract diners when malls are increasingly closing or are near empty will be critical as they attempt to avoid “restaurant-mageddon”. Haven’t heard that one yet? We’re already starting to see the Thematic Signals point to it as lunchtime meals have plunged and restaurant sales are showing signs of peaking.

The good news is, we all have to eat, and several restaurant chains are turning to mobile ordering (good news for our Cashless Consumption theme) and new, more healthy menu options that is part of our Foods with Integrity theme. But that’s all for another story, literally.


Tematica Chief Investment Officer Chris Versace Joins Cheddar to Discuss Chipotle’s Comeback Story

Tematica Chief Investment Officer Chris Versace Joins Cheddar to Discuss Chipotle’s Comeback Story

With the Burrito chain’s health scare firmly in the rearview mirror, the question still remains if this Foods with Integrity investment theme company can make the full comeback and overcome a new set of hurdles that sit in front of them.

CLICK HERE TO WATCH (forward to the 38 min mark): http://www.cheddar.com/videos/147086
Tematica’s Take on Mnuchin’s Reforms and Growth Prospects

Tematica’s Take on Mnuchin’s Reforms and Growth Prospects


There are several drivers of a company’s business as well as the price of its shares, assuming it is publicly traded. We described many of these in Cocktail Investing: Distilling Everyday Noise into Clear Investment Signals for Better Returns, but a short list includes new technology, regulatory mandates, the overall speed of the global economy and new policies flowing out of Washington. From a business perspective, more regulations and taxes tend to drive costs higher, leaving companies with smaller profits to spread across developing new products and services, implementing new technologies and creating more jobs – in other words investing for the company’s future.


We’re seeing this today in the restaurant industry, which is struggling with the impact of higher minimum wages as companies like McDonald’s (MCD) and others look to bring mobile ordering, as well as in-store kiosks like those found at Panera Bread (PNRA), to market. There has been much made about the low to no growth in the US economy over the last several years, but headwinds, like our aging population that has people shifting from spenders to savers and rising consumer debt levels that weigh on disposable income levels and consumer spending, make prospect for growth challenging.


Last week Treasury Secretary Steve Mnuchin reiterated in his testimony in front of the Senate Banking, Housing, and Urban Affairs Committee that the Trump administration’s goal of 3 percent or better GDP is achievable provided, “we make historic reforms to both taxes and regulation.” Mnuchin went on to say, “he’s got 100 bodies working on tax system reform and that they’re working on far more than just undoing the Dodd-Frank Act” including overhauling housing finance reform.


Over the weekend in a radio interview, Mnuchin noted, “The good news is that [the administration and Congress] all agree on the fundamental principles: simplifying personal taxes, creating a middle-income tax cut and making our business taxes more competitive.” Mnuchin went on to acknowledge that over the past eight years, the US economy has had very low growth, but “tax and regulatory changes and better trade deals” can unleash more historically typically growth rates in this country,” with “sustainable levels of 3 percent growth.”


The key word employed by Mnuchin is “reform,” and no matter which definition of the word offered by Merriam Webster – “to amend or improve by change of form or removal of faults or abuses” or “to put an end to (an evil) by enforcing or introducing a better method or course of action” – it’s rather clear Mnuchin’s language suggests something far more historic than a temporary tax cut or other one-time band aids like we’ve seen in recent years. That resetting should help reduce regulatory and litigation costs, but also a lower corporate tax rate, which would benefit predominantly US based companies like Verizon Communications (VZ), CVS Health (CVS), Walt Disney (DIS), Norfolk Southern (NSC) and others as well as their shareholders.


With true regulatory and tax reform, there would be the added benefit of certainty or at least greater certainty that would allow for longer-term corporate planning. It’s rather well understood the stock market abhors uncertainty, but uncertainty in the form of short-term tax cuts and ones that are about to expire as well as a shifting regulatory environment wreak havoc on corporate planning and subsequently spending. One example is Research & Experimentation Tax Credit (better known as R&D Tax Credit) was originally introduced in the Economic Recovery Tax Act of 1981 with an original expiration date of December 31, 1985.


Flash forward a few years, and the credit has expired eight times and has been extended fifteen times with the last extension expired on December 31, 2014. Not exactly a boon to corporate planning, but in 2015, Congress made permanent the research and development tax credit, which now allows more consistent planning and product development at companies ranging from Apple (AAPL) and Facebook (FB) to II-VI (IIVI) and Oracle (ORCL), not to mention food and beverage companies like Coca-Cola (KO) and PepsiCo (PEP). Douglas L. Peterson, President and Chief Executive Officer of S&P Global Inc. summed it up well when he said, “If we knew where the cost was going…and we’re able to predict it over the long run, we could have a completely different planning cycle and invest in the long run.”


While these reforms are likely to help reignite growth in the US economy, the stark reality is between increased spending to rebuild US infrastructure as well as the US military and ensuring entitlement programs are in place for our aging population, there is a deficit funding gap at least in the short to medium term that will need to be addressed. While there are several mechanisms being bandied about, a recurring one is the Border Adjustment Tax. There are those that oppose it, particularly retailers that source heavily from outside the US, but the argument for the Border Adjustment Tax is that it would help level the playing field between imported goods and those crafted within the US as well as encourage companies to source within the US, thereby developing industries and creating jobs.


The challenge here is that with the gap between Job Openings and Hirings already well above historical norms as companies struggle to find the right talent for open positions as we sit at what has been the lower range of the unemployment rate over the past fifty years, who is going to take these jobs? Regular Tematica readers will quickly recognize how this pertains to our Tooling and Re-tooling investment theme.


We frequently discuss here at Tematica Research how economic growth requires that either the labor pool grows and/or productivity must rise. If companies are able to keep more of their income thanks to tax cuts, they can invest back into their own operations so that the productivity of their workforce improves. That being said, cutting corporate tax rates doesn’t guarantee that companies will do such reinvestment as they could also look to return the additional funds to investors through dividends, fund buyback programs or hold onto it if there is concern that times could get tough in the near to medium-term future. Investors need to assess the overall economic conditions and business drivers as well as other incentives facing companies when it comes to decided just what to do with those tax savings.


As Team Trump and his allies, including Mnuchin, look to reset the administration’s timetable for meaningful reform, investors should begin doing their homework on which companies stand to benefit. If we see lower corporate tax rates like those being discussed, we could see greater earnings falling to corporate bottom lines, which could spur shares in those companies higher, outside of any decision on just what to do with those newly saved funds. If we see infrastructure spending beginning, it offers another shot in the arm for companies like US Concrete (USCR), Granite Construction (GVA) and aggregates companies like Martin Marietta (MLM). Any boost in defense spending would likely bode well for companies such as General Dynamics (GD), Raytheon (RTN) and Northrop Grumman (NOC).


The key is for investors to develop their wish list today and be ready to strike once we know the particulars on the actual reforms. While that is likely a sound strategy, we would suggest investors go one step further and utilize our thematic perspective to identify those companies already benefiting from pronounced multi-year tailwinds that could also benefit from tax and regulatory reform, rather than being dependent solely on these reforms making it through the D.C. sausage factory.

Despite Narrative of Accelerating Economy, Hard Data Is Not Indicative of a Bullish Market

Despite Narrative of Accelerating Economy, Hard Data Is Not Indicative of a Bullish Market

The market has been mostly trending sideways as the primary driver of the market, namely the expanding P/E ratios based on assumptions around the impact of future Trump administration policies and prospects for earnings growth, come into question. We have been seeing heavier volume on down days than on up for both the Dow and the S&P 500, which is a bearish sign. Next week will mark the 100th day in office for President Trump, with the market starting to price in much lower expectations that right after the election. In fact a recent Merrill Lynch Fund Manager survey found that only 5 percent of managers expect any tax legislation to be passed by the end of summer. We see that push out in expectations as well as the likelihood we see an earnings expectations reset occur as more than 2,000 companies report quarterly earnings over the next few weeks weighing on the market at least for the near-term.

As we get ready for that rush of quarterly earnings reports, three comments from last week are likely to set the stage for what we are likely to hear:

“The first quarter was an interesting one, as we entered it with a lot of optimism about what the new administration might do to further improve the economy. As the quarter continued, some of this optimism has slowed and now companies are more cautious or skeptical about what shape some of the programs, including tax reform, infrastructure projects and ACA reform will take and when they might actually take effect, if at all.”

— Brown & Brown (BRO) CEO Powell Brown (Insurance Broker)

“During the first quarter of 2017, commercial loan growth was sluggish across the industry. Our large corporate customers tell us that they are optimistic about the future, but are awaiting more clarity regarding potential changes in tax and regulatory reform, infrastructure spend and trade policies.”

—US Bancorp (USB) CEO Andy Cecere

On the US, I think there’s a general observation here and that is pretty weak consumer demand and that’s not a particular issue here for Nestle. I think that’s all throughout…category by category, whether it’s us or anyone else, what you’re seeing is fairly soft demand, even in the face of pretty good fundamental economic data.”

—Nestle (NSRGY) CEO Mark Schneider

Not exactly commentary that points to a teeming economic environment or an expected rebound in 2Q 2017.

Last Thursday, the S&P 500 closed below its 50-day moving average for the first time since the election, ending the 105-day trading streak that is the 17th longest on record for the S&P 500 going back to 1928. The leading market sector, technology, also closed below its 50-day on Thursday for the first time in 2010, after experiencing ten consecutive declining days, the sector’s second longest losing streak since 1989. With a gain of 4.1 percent since President Trump’s inauguration, the S&P 500 performance is right in the middle of the pack for a president’s first 100 days.

Despite the narrative of an accelerating economy over the past few months, as of Friday’s close the S&P 500 is up 4.9% year-to-date, only slightly more than iShares 20+ Year Treasury Bond ETF (TLT), up 3.7%, with the longer dated bond fund strongly outperforming the Russell 2000, up just 1.7%. Not exactly indicative of a bullish market. Outperforming all the major indices is gold, the the SPDR Gold Shares ETF (GLD) up 11.6% year-to-date. Tough to argue the market is buying into an accelerating domestic economy when bonds and gold outperform small cap stocks.

From a valuation perspective, the S&P 500 closed Friday at 17.9x expected earnings of $131.05 this year. We’ve already seen 1Q 2017 earnings expectations for those 500 companies slip to $29.36 from just under $30.65 in early December as 2017 forecasts slipped to the current $131.05 from $132.73. Given the data we’ve discussed that points to a sharp slowdown and push out in Trump’s fiscal policies, odds are we will see revisions to both 2017 earnings and GDP expectations in the coming weeks as the market digests current earnings deluge. Here’s the thing, the current market valuation is 18.5 percent above the 5-year average (15.1) and 27.9 percent the 10-year average (14.0). If we do get a meaningful downward revision to 2017 earnings expectations, much the way we did last year, it would mean the S&P 500 would be even more expensive – something that is not likely to be lost on investors.

For context and perspective, in late December 2015 the consensus expectation was for the S&P 500 group of companies to deliver EPS of $127.05 in 2017, which would have equated to an increase of 7.5 percent year over year. In looking back on 2016, the S&P 500 delivered EPS growth of just 0.5 percent. Mixed with our view on the overall economy, we look at the forecasts calling for the S&P 500 to deliver EPS growth of 9.9 percent this year and 11.9 percent in 2018 as rather aggressive. As the market comes around to this realization, odds are meaningful market returns from current levels will capped.

The bond market is telling us that U.S. growth is going to be no where near the levels necessary to justify S&P 500 valuations. Friday’s core CPI fell 0.1 percent month-over-month, something we haven’t seen since January 2010. The yield curve is flattening as well, which is indicative of weak growth expectations. Global FX markets are seconding the bond market’s view with the Australian dollar and the Canadian looney showing signs of weakness.

To further put valuations in context, the Bank of America Merrill Lynch survey of fund managers recently found that a record 83 percent of managers think stocks are overpriced and that is in a survey going back to 1999, not exactly a year known for modest valuations. Friday morning a Bloomberg article quoted the legendary Paul Tudor Jones as saying that central bankers should be “terrified” of current stock market valuations, claiming that the years of low interest rates have inflated stock valuations to levels not seen since 2000. He’s not alone. Keep in mind as well when looking at the consumer confidence surveys that they tend to peak at the peak of the business cycle and history shows us that the S&P 500 tends to decline somewhere between 5 percent and 10 percent a year after consumer confidence peaks.

As for the current market trends, it is still too early to tell if we are just two months into a consolidation period after which we will experience another leg up or if we are seeing the start of a directional charge. We find it absolutely fascinating that most investor sentiment surveys find that the vast majority believe stock valuations are quite rich, yet most also believe that the market will be higher a year from now. For example, the Yale “One-Year Confidence” reading found that only 1 percent of institutional investors don’t expect gains for the Dow over the next year. That same survey found that individual investors are the most bullish since February 2004, with 91 percent expecting gains. On the other end of the spectrum, the survey found that both individual and institutional investors are near lowest levels on record for believing the market is cheap.

Another “yikes!” data point can be found in the end of month data for margin debt published by the New York Stock Exchange. According to the latest report, margin debt climbed to a new record high in February at $528.2 billion. Here’s the context – that’s up 2.9 percent from $513.3 billion in January, which had been the first margin debt record in nearly two years. And this is where we remind that margin leverage cuts both ways – it can be a powerful lever in a rising market, but it can quickly compound the pain in a falling one.

Now that certainly tells several things, but the one we are zeroing in on is the simple fact that in a nervous market like the one we are currently in, investors are likely to shoot first and ask questions later when faced with a barrage of earnings reports, especially if they or the guidance they offer come up short.

Viewed from a different perspective, combining the high confidence in future gains with record low levels for valuation and we find ourselves repeating the conditions described by former Fed Chair Alan Greenspan in his 1996 speech on “Irrational Exuberance.”


Shifting Consumer Preferences Favor Food with Integrity Bullets Not Restaurant Shares

Shifting Consumer Preferences Favor Food with Integrity Bullets Not Restaurant Shares

It’s no secret the restaurant industry is having a tough time given restaurant traffic data and less-than-flattering industry articles as it grapples with several consumer-centric issues. We received yet another indication of that restaurant pain last week when Sonic Corp. (SONC) reported a 7.4 percent decline in same-store-sales. The company’s management team chalked up the drop to “a sluggish consumer environment, weather headwinds and share losses…” amid a “very intense” competitive environment. Predictably, the company is retooling its menu offering and even though it’s late to the party, it is also jumping on the smartphone bandwagon.

Stepping back there is a larger issue that Sonic and other restaurants have to contend with – declining restaurant traffic that is due not only to lower prices at grocery stores but also to the shift in consumer preferences to healthier foods. That preference shift is toward natural and organic offerings as well as paleo, gluten-free and others and that’s one of the reason’s we’ve favored shares of United Natural Foods (UNFI) as grocers expand their offering to meet that demand.

Even as companies like Coca-Cola (KO) and PepsiCo (PEP) tinker with their carbonated soft drink formulas to reduce sugar, the new enemy, they have to do so without sacrificing taste. Some investors may remember the whole New Coke thing back in 1985 that was ultimately a failure given the different taste. As Coca-Cola, PepsiCo and even Dr. Pepper Snapple (DPS) look to reformulate to ride either the lower sugar or better-for-you shift, it bodes rather well for flavor companies like International Flavors & Fragrances (IFF) or Sensient Tech (SXT).

That shifting preference has led several restaurant companies such as Panera Bread (PNRA) and Darden’s (DRI) Olive Garden to change up their menus in order to lure eaters. Over the last several years, Panera has been working to eliminate artificial additives in its food to make it “cleaner” for consumers and in 2015 it released a “no-no” list of more than 96 ingredients that it vowed to either remove from or never use in food. Darden is shifting to lighter fare recipes that have far fewer calories than prior ones. Even Chipotle (CMG), the one-time poster child for our Food with Integrity investing theme until its food safety woes last year, has come to fulfill its pledge of using no added colors, flavors or preservatives of any kind in any of its ingredients.

These are all confirming signs of our Food with Integrity investing theme that Lenore Hawkins and I talked about on last week’s podcast. Here too with these new menu offerings, it’s a question of how can restaurants offer healthier alternatives without sacrificing flavor? To us, the answer is found in  International Flavors & Fragrances, McCormick & Co. (MKC) and Sensient shares as well as other flavor companies.

Against that backdrop — – the shift to eating not only at home but eating food that is better for you – we have serious doubts when it comes to the quick service restaurant industry. According to the data research firm Sense360, which analyzed data from 140 chains and 5 million limited-service visits, 38% of heavy quick-service restaurant users reduced their visits in February, compared with the period before Christmas. Not exactly an inspiring reason to revisit shares of Sonic or several other QSR (Quick Service Restaurant) chains like McDonald’s  (MCD) or Wendy’s (WEN) at a time when bank card delinquency rates are climbing, subprime auto issues are doing the same, student debt levels loom over consumers and real wage growth has been meager at best.

While more people eating at home is a positive for Kroger (KR) and Wal-Mart (WMT), our “buy the bullets not the gun” approach continues to favor shares of McCormick and International Flavors & Fragrances in particular.  For those unfamiliar with “buy the bullets, not the gun” it’s a strategy that looks to capitalize on select industry suppliers that serve the majority of the industry with key components or other inputs. Shining examples of this strategy have included Intel (INTC), Qualcomm (QCOM) and recently acquired ARM Holdings. Common traits among them include a diverse customers base and strong competitive position with a leading market position for their products. The same holds true for both McCormick and International Flavors & Fragrances, which are also benefitting from our Rise & Fall of the Middle Class investing theme.

Assessing the Market as We Get Ready for 1Q17 Earnings Deluge

Assessing the Market as We Get Ready for 1Q17 Earnings Deluge

Despite yesterday’s move higher in the stock market, March to date has seen the Dow Jones Industrial Average move modestly lower with a larger decline in the Russell 2000. Only the Nasdaq Composite Index has climbed higher in March, bringing its year to date return to more than 9 percent, making it the best performing index thus far in 2017. By comparison, the Dow is up 4.75 percent, the S&P 500 up 5.35 percent and the small-cap heavy Russell 2000 up just 0.75 percent year to date.

So what’s caused the move lower in the stock market during March, bucking the upward trend the market enjoyed since Election Day 2016?

Despite the favorable soft data like consumer confidence and sentiment readings, investors are waking to the growing disconnect between post-election expectations and the likely reality between domestic economic growth and earnings prospects. Fueling the realization is the move lower in 1Q 2017 earnings expectations for the S&P 500, per data from FactSet, as well as several snafus in Washington, including the pulling of the vote for the GOP healthcare plan. These have raised questions about the timing and impact of President Trump’s stimulative policies that include infrastructure spending and tax reform.

We’ve been steadfast in our view that the earliest Trump’s policies could possibly impact the US economy was late 2017, with a more dramatic impact in 2018. On a side note, we agree with others that would have preferred to have team Trump focus on infrastructure spending and tax reform ahead of the Affordable Care Act. As we see it, focusing on infrastructure spending combined with corporate tax reform first would have boosted confidence and sentiment while potentially waking the economy from its 1.6 to 2.6 percent annual real GDP range over the last five years sooner. We’d argue too that that would have likely added to Trump’s political war chest for when it came time to tackle the Affordable Care Act. Oh well.


Evolution of Atlanta Fed GDPNow real GDP forecast for 2017: Q1


So here we are and the enthusiasm for the Trump Trade is being unraveled as growth slows once again. As depicted above, the most recent forecast for 1Q 2017 GDP from the AtlantaFed’s GDPNow sits at 1.0 percent compared to 1.9 percent for 4Q 2016 and 3.5 percent in 3Q 2016. Even a grade school student understands the slowing nature of that GDP trajectory. Despite all the upbeat confidence and sentiment indicators, the vector and velocity of GDP forecast revisions and push outs in the team Trump timing has led to to the downward move in S&P 500 EPS expectations for the current quarter and 2017 in full.

With Americans missing bank cards payments at the highest levels since July 2013, the delinquency rate for subprime auto loans hitting the highest level in at least seven years and real wage growth continuing to be elusive, the outlook for consumer spending looks questionable. Factor in the aging of the population, which will have additional implications, and it looks like the consumer-led US economy is facing more than a few headwinds to growth in the coming quarters. These same factors don’t bode very well for the already struggling brick & mortar retailers like Macy’s, Sears, JC Penney, Payless and others.

Now here’s the thing, currently, the S&P 500 is trading at 18x 2017 expectations —expectations that are more than likely to be revised down than up as the outlook for U.S. economic growth in the coming quarters is revisited. In three days, we close the books on 1Q 2017 and before too long it means we’ll be hip deep in corporate earnings reports. If what we’ve seen recently from Nike, FedEx, General Mills, Kroger and Target is the norm in the coming weeks, it means we’re more likely to see earnings expectations revised even lower for the coming year.

While it’s too early to say 2017 expectations will be revised as steeply as they were in 2016, (which started the year off with the expectation of a 7.6 percent increase year over year but ended with only a 0.5 percent increase following 4Q 2016 reporting), but any additional downward revisions will either serve to make the market even more expensive than it currently is or lead to a resumption of the recent downward move in the market. Either way, odds are there is a greater risk to the downside than the upside for the market in the coming weeks.

Buckle up; it’s bound to get a little bouncy.

Bearish Thoughts on General Motors Shares

Bearish Thoughts on General Motors Shares

While higher interest rates might be a positive for financials, at the margin, however, it comes at a time when credit card debt levels are approaching 2007 levels according to a recent study from NerdWallet. The bump higher in interest rates also means adjustable rate mortgage costs are likely to tick higher as are auto loan costs, especially for subprime auto loans. Even before the rate increase, data published by S&P Global Ratings shows US subprime auto lenders are losing money on car loans at the highest rate since the aftermath of the 2008 financial crisis as more borrowers fall behind on payments. If you’re thinking this means more problems for the Cash-strapped Consumer (one of our key investment themes), you are reading our minds.

In 4Q 2016, the rate of car loan delinquencies rose to its highest level since 4Q 2009, according to credit analysis firm TransUnion (TRU). The auto delinquency rate — or the rate of car buyers who were unable make loan payments on time — rose 13.4 percent year over year to 1.44 percent in 4Q 2016 per TransUnion’s latest Industry Insights Report. That compares to 1.59 percent during the last three months of 2009 when the domestic economy was still feeling the hurt from the recession and financial crisis. And then in January, we saw auto sales from General Motors (GM), Ford (F) and Fiat Chrysler (FCAU) fall despite leaning substantially on incentives.

Over the last six months, shares of General Motors, Ford, and Fiat Chrysler are up 8 percent, -2.4 percent, and more than 70 percent, respectively. A rebound in European car sales, as well as share gains, help explain the strong rise in FCAU shares, but the latest data shows European auto sales growth cooled in February. In the U.S., according to data from motorintelligence.com, while General Motor sales are up 0.3 percent for the first two months of 2017 versus 2016, Ford sales are down 2.5 percent, Chrysler sales are down 10.7 percent and Fiat sales are down 14.3 percent.

In fact, despite reduced pricing and increasingly generous incentives, car sales overall are down in the first two months of 2017 compared to the same time in 2016.


So what’s an investor in these auto shares to do, especially if you added GM or FCAU shares in early 2016? The prudent thing would be to take some profits and use the proceeds to invest in companies that are benefitting from multi-year thematic tailwinds such as Applied Materials (AMAT), Universal Display (OLED) and Dycom Industries (DY) that are a part of our Disruptive Technology and Connected Society investing themes.

Currently, GM shares are trading at 5.8x 2017 earnings, which are forecasted to fall to $6.02 per share from $6.12 per share in 2016. Here’s the thing, the shares peaked at 6.2x 2016 earnings and bottomed out at 4.6x 2016 earnings last year, which tells us there is likely more risk than reward to be had at current levels given the economic and consumer backdrop.  Despite soft economic data that shows enthusiasm and optimism for the economy, the harder data, such as rising consumer debt levels paired with a lack of growth in real average weekly hourly earnings in February amid a slowing economy, suggests we are more likely to see GM’s earnings expectations deteriorate further. And yes, winter storm Stella likely did a number of auto sales in March.

Subscribers to Tematica Pro received a short call on GM shares on March 16, 2017


Thematic Tailwinds and Headwinds Drive February Retail Sales 

Thematic Tailwinds and Headwinds Drive February Retail Sales 

This morning the US Department of Commerce published its February Retail Sales report, which was in line with expectations growing 0.1 percent compared to January. This report is always an interesting read due in part to the fact that we can look at the data a number of ways — month over month, year over year, and three-month comparisons on a trailing and year over year basis. As you can imagine, this can lead to quite a bit of confusion when trying to puzzle together exactly what the investing signal is coming out of that retail report noise.

Here’s our take on it featuring the thematic lens that we hang our hat at here at Tematica . . .

February 2017 vs. January 2017

Month over month retail sales climbed by 0.1 percent, in line with expectations. The four categories that saw faster spending growth than the average were furniture (+0.7 percent), building materials (+1.8 percent), health & personal care stores (+0.7 percent) and nonstore retailers (+1.2 percent). The sequential increase in building material demand, as well as furniture, fits with the mild winter weather that led to a pickup in construction employment and a stronger than seasonal pickup in housing starts.

The continued tick higher in health & personal care stores ties with our Aging of the Population investing theme. We continue to see this category rising faster than overall retail spending as the first baby boomers turn 70 this year with another 1.5 million each year for the next 15 years. The scary part is of these baby boomers, roughly only 50 percent have saved enough for retirement, which touches on our Cash Strapped Consumer investing theme.

Finally, we once again see Nonstore retailers taking consumer wallet share in February, which comes as no surprise as Amazon and other retailers continue to expand their service offerings and geographic footprints, while other traditional brick & mortar retailers focus on growing their direct to consumer business. In short, our Connected Society investing theme continues to transform retail.

Month over month weakness was had at electronics & appliance stores, clothing, and department stores. Compared to January gasoline station sales ticked down modestly as well, which we attribute to the essentially flat gasoline prices month over month per data from AAA.


February 2017 vs. February 2016

Year over year February Retail Sales excluding autos and food rose 5.9 percent led by a 19.6 percent increase in gasoline station sales, a 13.0 percent increase in Nonstore retail, a 7.3 percent rise in building materials, a 7.0 percent increase at health & personal care stores. Without question, the rise in gasoline station sales reflects the year over year 18 percent increase in gas prices per AAA data, while the milder winter we discussed earlier is likely pulling demand forward in construction and housing — we’ll look for February and March housing data to confirm this. The rise in gas prices reflects OPEC oil production cuts, which serves as a reminder that oil and other energy products are part of our Scarce Resource investing theme — there is only so much to be had, and production levels dictate supply.

As far as the year over year increase in health & personal care goes, it’s the same story — the Aging of the Population as Father Time is a tough customer to beat no matter how people embrace our Fountain of Youth investing theme. Finally, and certainly no surprise is the continued increase in Nonstore retail sales. Candidly, we see no slowdown in this Connected Society shift — all we need to do is look at the evolving shopping habits of the “younger” generation.

The two big declines were had were…. no surprise….. electronic & appliance stores, which fell 6 percent year over year, and department stores, which dropped 5.6 percent compared to February 2016.  With hhgregg (HGG) closing a good portion of its stores and JC Penney (JCP) recently announcing even more store closures, the results of these two categories, which are likely feeling the heat from Amazon (AMZN) in particular and others benefiting from the Connected Society tailwind, the results from these two categories is anything but surprising.

If we look at the three month rolling average on both a sequential and year over year basis, the leaders remained the same — building materials, gasoline stations, Nonstore retail and health & personal care. Behind each of these there is a clear thematic tailwind, even construction and housing, which is has historically been a beneficiary of the rising aspect of our Rise & Fall of the Middle Class investing theme. We’ll have a better sense of that with tomorrow’s February Housing Starts and Building Permits report.

And just in case anyone was holding out hope for electronics & appliance stores and department stores, the three-month rolling averages showed continued declines on both on a sequential and year over year basis. Nothing like a thematic headwind to throw cold water on your business.

The question to us is whether we will see more M&A chatter like we saw several weeks back with Macy’s (M) and more recently with Hudson Bay (TSE:HBC) being interested in Neiman Marcus. We can understand one company picking off well-positioned assets that might improve its overall customer mix, but we suspect there will be a number of companies left standing with no dance partners when this game of retail musical chairs is over. That means more companies going the way of Wet Seal than not, which means pain for mall REIT companies like Simon Property Group (SPG).

Before we go, we have to mention the piece by Tematica’s Chief Macro Strategist, better known on the Cocktail Investing Podcast as the High Priestess of Global Macro, Lenore Hawkins, which  called out the lack of weekly, year over year wage growth in February. Paired with higher prices, such as gas prices and others, that are leading to a pickup in reported inflation, it tells us our Cash-strapped Consumer investing theme has more room to go.

Hat tip to Lenore Hawkins, who added her special sauce and insights to this viewpoint. 

Note: Tematica’s subscription trading service, Tematica Pro, has a short position in SPG shares. 


Post IPO Thoughts on Snap Shares and the $34.7 Billion Market Cap Question

Post IPO Thoughts on Snap Shares and the $34.7 Billion Market Cap Question

Last Thursday, March 2, shares of Snapchat parent Snap Inc. (SNAP) went public at $17, well above the $14-$16 initial public offering range. The shares hit a high of $29.44 on Friday morning before closing the week out at $27.09. That quick gain of just under 60 percent was great for investors that were involved with the IPO, but it wasn’t quite the same for investors that entered into SNAP shares after the shares started trading on Thursday morning.

With SNAP shares now trading in the secondary market and the buildup of the IPO now behind us, the question to us is are SNAP shares really worth the current $34.7 billion in market capitalization? At that market valuation, the shares are trading at about 37 times EMarketer’s estimate for Snap’s 2017 advertising sales. As spelled to out in the S-1 filing, Snap’s Snapchat is free and the company generates revenue “primarily through advertising,” the same was true of Facebook (FB) and Twitter (TWTR).

Actually, that’s not THE question, but rather one of the key questions as we contemplate if there is enough upside to be had in SNAP shares from current levels to warrant a Buy rating? Odds are the IPO underwriters, which include Morgan Stanley (MS), Goldman Sachs (GS), JPMorgan Chase (JPM), and Deutsche Bank (DB), that made a reported $85 million in fees from the transaction, will have some favorable research comments on SNAP shares in the coming weeks.

While SNAP shares fit within the confines of our Connected Society investing theme and are likely to benefit from the shift in advertising dollars to digital and social media platforms like Facebook and Alphabet’s (GOOGL) Google and YouTube, our charge is to question using our thematic 20/20 foresight to see if enough upside in the shares exists to warrant placing them on the Tematica Select List?

Boiling this down, it all comes down to growth

The question when looking at Snap is, “Can it grow its revenue fast enough and deliver positive earnings per share so we can see at least 20 percent upside in the shares?”

Well, right off the bat the company’s user base of 158 million active daily users was relatively flat in the December quarter and grew just 7 percent between 2Q 2016 and 3Q 2016.  Assuming the company is able to continue to grow its user base, something that has eluded Twitter for the most part, it will still need to capture a disproportionate amount of the mobile advertising market to hit Goldman Sach’s forest that calls for Snap to increase its revenue fivefold by 2018.

Snap recorded $404.5 million in revenue last year, up from $58.7 million in 2015, so a fivefold increase would put 2018 revenue at more than $2 billion. IDC projects that mobile advertising spend will grow nearly 3x from $66 billion in 2016 to $196 billion in 2020, while non-mobile advertising spend will decrease by approximately $15 billion during the same time period.

While a fivefold increase in revenue catches our investing ears, we have to question Snap’s ability to garner such an outsized piece of the mobile advertising market when going head to head with Facebook and its several platforms, Google, Twitter and others. The argument that a rising tide will lift all boats will only go so far when all of those boats are vying for the same position in the monetization river.

There are other reasons to be skeptical, including users migrating to newer social media platforms or ones that have been updated like Facebook’s Instagram that launched Stories to better compete with Snapchat. Snap called this out as a competitive concern in its S-1 filing — “For example, Instagram, a subsidiary of Facebook, recently introduced a “stories” feature that largely mimics our Stories feature and may be directly competitive.” With good reason, because as Instagram Stories reached 150 million daily users in the back half of 2016, Snapchat’s growth in average daily user count slowed substantially. Part of that could be due to Snap’s reliance on the teen demographic, which even the company has noted is not “brand loyal.” We’re not sure anyone has figured out how to model teen fickleness in multi-year revenue forecasts.


Making things a tad more complicated is the recent push back on digital advertising by Proctor & Gamble’s (PG) Chief Marketer Marc Pritchard, who publicly expressed his misgivings with today’s digital media practices and, “called on the media buying and selling industry to become transparent in the face of ‘crappy advertising accompanied by even crappier viewing experiences.'” As Pritchard made those and other comments, a survey from the World Federation of Advertisers showed that large brands are reviewing contracts related to almost $3 billion of advertising spend on programmatic advertising, which automates digital ad placement. The question to be answered is whether ads are actually seen and this has led to a call for companies like Snap to follow Facebook, YouTube and have Snapchat’s ad metrics audited by the Media Rating Council.


One other wrinkle in the Snap investing story is the company has yet to turn a profit.

In 2016, while Snap’s revenue was just over $400 million, it managed to generate a loss off $514.6 million and per the S-1 it will need to spend a significant amount to attract new users and fend off competition. In reading that, the concern is user growth could be far slower — and expensive — than analysts are forecasting, which would impact advertising revenue growth like we’ve seen at Twitter. The thing is, new user growth for Snapchat already slowed in the back half of 2016 as newer messaging apps like Charge, Confide and Whisper have come to market.

When Snap finally does turn a profit, we could see the outsized P/E ratio lead value and growth at a reasonable price (GARP) investors to balk at buying the shares, which means Snap will be relying on growth investors. It amazes us how some investors love companies even though they are not generating positive net income, but balk at P/E ratio that is too high the minute they start to generate positive albeit rather small earnings per share. We get around that problem by using a multi-pronged valuation approach to determine upside and downside price targets.


Is Snap the Next GoPro?

While all those numbers and forecasts are important to one’s investment decision making process (we make that point clear in Cocktail Investing: Distilling Everyday Noise into Clear Investment Signals for Better Returns), we have a more primal issue with Snap. Back in late 2015, we shared our view that GoPro (GPRO) was really a feature, not a product. As we said at the time, we saw Yelp (YELP), Angie’s List (ANGI), Groupon (GRPN) and others as features that over time will be incorporated into other products — like Facebook’s Professional Services, those at Amazon (AMZN) or others from Alphabet’s Google, much the way point-and-shoot cameras were overtaken by camera-enabled smartphones and personal information management functions were first incorporated into mobile phones and later smartphones, obviating the need for the original Palm Pilot and other pocket organizers.

When GoPro shares debuted in June 2014, they were a strong performer over the following months until they peaked near $87, but 15 months after going public GPRO shares fell through the IPO price and have remained underwater ever since.

What happened?

We recall hearing plans for a video network of user channels at GoPro as well as the management team touting the company as an “end to end storytelling solution,” but over the last few quarters, we’ve heard far more about new product issues, layoffs, facility closures and falling unit sales.  In 2016, GoPro saw camera unit sell-through fall 12 percent year-over-year to 5.3 million units from approximately 6 million units in 2015.

In our view, what happened can be summed up rather easily — GoPro was and is a feature, not a standalone product. It just took the stock market some time to figure it out once the IPO blitz and glory subsided. While we could be wrong, we have a strong suspicion that Snap is more likely to resemble GoPro than Facebook, which is monetizing multiple platforms as it extends its presence with new solutions deeper into the lives of its users and has changed the way people communicate.

As investors, we at Tematica would much rather own innovators of new products and solutions that are addressing pain points or benefitting from disruptive forces and changing economics, demographics, and psychographics in the marketplace than companies that offer features that will soon be co-opted by other companies and their products. Following that focus on 20/20 foresight, we avoided GoPro shares that fell from $19.50 in December 2015 to the recent share price of $8.84.

GoPro 2-year Share Price Performance


And then there’s this . . . 

There is another consideration which is not specific to Snap, but is rather an issue that all newly public companies must contend with — the lock-up expiration. For those unfamiliar with it, the lock-up period is a contractual restriction that prevents insiders who are holding a company’s stock, before it goes public, from selling the stock for a period usually between 90 to 180 days after the company goes public. Per Snap’s S-1, its lock-up expiration is 150 days, which puts it in 3Q 2017. Given the potential that insider selling could hit the shares, and be potentially disruptive to the share price, we tend to wait until the lock-up expiration comes and goes before putting the shares under the full Tematica telescope. This isn’t specific to Snap shares, but rather it’s one of our rules of thumb.

We have a strong suspicion that Snap is more likely to resemble GoPro than Facebook, but we’ll keep an open mind during the SNAP shares lock-up period, after all, companies are living entities that can move forward and backward depending on the market environment and leadership team. Let’s remember too that it took Facebook some time to figure out mobile.

Finally, we aren’t so thrilled that none of the 200 million shares floated came with voting rights, leaving the two founders Evan Spiegel and Robert Murphy with total control of the company. We prefer seeing more direct shareholder accountability… but hey, that’s us.


The Market Climbs Higher, But Look at These Two Charts and It’s Ruh-Roh Time

The Market Climbs Higher, But Look at These Two Charts and It’s Ruh-Roh Time

As the stock market continued to get further and further out over its ski tips last week, as investors we have a split mind on the current state of things. On the one hand, we’re certainly enjoying the higher stock prices. On the other hand, we are mindful of the increasingly stretched market valuation. One of the common mistakes see with investors is they all too easily enjoy the gains, but tend not to be mindful of the risks that could wash those gains away.

Over the last few weeks, we here at Tematica have been pointing out the growing disconnect between the stock market’s valuation and the current economic environment. We have a snootful of data points that underscore our cautious stance in this week’s Monday Morning Kickoff, but we wanted to share two charts from our weekend reading that caught our cautious eye.

There have been some who call into question the use of Robert Schiller’s Cyclically Adjusted Price to Earnings (CAPE) ratio, but Tematica’s Chief Macro Strategist Lenore Hawkins does a pretty good job handling that criticism. Exiting last week the CAPE to GDP growth of 19.77 has far surpassed the 1999 peak and all points back to at least 1950. As we like to say when looking at data, context and perspective are key to truly understanding what it is we’re looking out. So here’s that context and perspective for the current CAPE to GDP reading —  it is over three times the average for the last 66 years. Going back to 1900, the only time today’s ratio was eclipsed was in 1933 and that reflected the Great Depression when GDP has been running at close to zero for nearly a decade.

Students of CAPE will point out that in order for the CAPE to GDP to fall back to more normalized levels, we either need to see a dramatic increase in GDP (not likely in the near-term) or we need to see a pullback in the CAPE. Here’s the thing, as Michael Lebowitz of 720 Capital points out, “if we assume a generous 3% GDP growth rate, CAPE needs to fall to 18.71 or 35 percent  from current levels to reach its long-term average versus GDP growth.” Based on the data we’re seeing, there is a rather high probability 2017 GDP is more likely to be closer to 2.5 percent than 3.0 percent per The Wall Street Journal’s Economic Forecasting Survey of more than 60 economists, which means to hit normalized levels, the CAPE would need to fall further than 35 percent.

As you ponder that and think on why it has us a tad cautious, here’s more food for thought:


Coming into 2017, forecasts called for the S&P 500 group of companies to grow their collective earnings more than 12 percent year over year, marking one of the strongest years of expected growth in some time. Granted energy companies are likely to be more of a contributor than detractor to earnings growth this year, but we as can be seen by the graph above, earnings expectations for the S&P 500 are already coming down for the current quarter. Those revisions now have year over year EPS growth for the collective at up just over 10 percent.

Are we getting data that shows the current quarter isn’t likely to break out of the low-gear GDP we’ve been seeing for most of the last few years?

Yep.

Are earnings expectations for 2Q-4Q 2017 still calling for 8.5 to 12.5 percent earnings growth year over year?

Yep.

Is it increasingly likely that President Trump’s fiscal policies won’t have a dramatic impact until late 2017 and more likely 2018?

Yep and yep.

The bottom line is we have the stock market melting higher, pulling a Stretch Armstrong-like move in terms of valuation even though earnings expectations for 2017 are starting to get trimmed back.

Yep, you can color us cautious at least for the near-term. While we continue to use our thematic foresight to ferret our companies poised to ride several of our thematic tailwinds, the current market dynamic has us being far more selective.

l