Assessing the Market as We Get Ready for 1Q17 Earnings Deluge

Assessing the Market as We Get Ready for 1Q17 Earnings Deluge

Despite yesterday’s move higher in the stock market, March to date has seen the Dow Jones Industrial Average move modestly lower with a larger decline in the Russell 2000. Only the Nasdaq Composite Index has climbed higher in March, bringing its year to date return to more than 9 percent, making it the best performing index thus far in 2017. By comparison, the Dow is up 4.75 percent, the S&P 500 up 5.35 percent and the small-cap heavy Russell 2000 up just 0.75 percent year to date.

So what’s caused the move lower in the stock market during March, bucking the upward trend the market enjoyed since Election Day 2016?

Despite the favorable soft data like consumer confidence and sentiment readings, investors are waking to the growing disconnect between post-election expectations and the likely reality between domestic economic growth and earnings prospects. Fueling the realization is the move lower in 1Q 2017 earnings expectations for the S&P 500, per data from FactSet, as well as several snafus in Washington, including the pulling of the vote for the GOP healthcare plan. These have raised questions about the timing and impact of President Trump’s stimulative policies that include infrastructure spending and tax reform.

We’ve been steadfast in our view that the earliest Trump’s policies could possibly impact the US economy was late 2017, with a more dramatic impact in 2018. On a side note, we agree with others that would have preferred to have team Trump focus on infrastructure spending and tax reform ahead of the Affordable Care Act. As we see it, focusing on infrastructure spending combined with corporate tax reform first would have boosted confidence and sentiment while potentially waking the economy from its 1.6 to 2.6 percent annual real GDP range over the last five years sooner. We’d argue too that that would have likely added to Trump’s political war chest for when it came time to tackle the Affordable Care Act. Oh well.


Evolution of Atlanta Fed GDPNow real GDP forecast for 2017: Q1


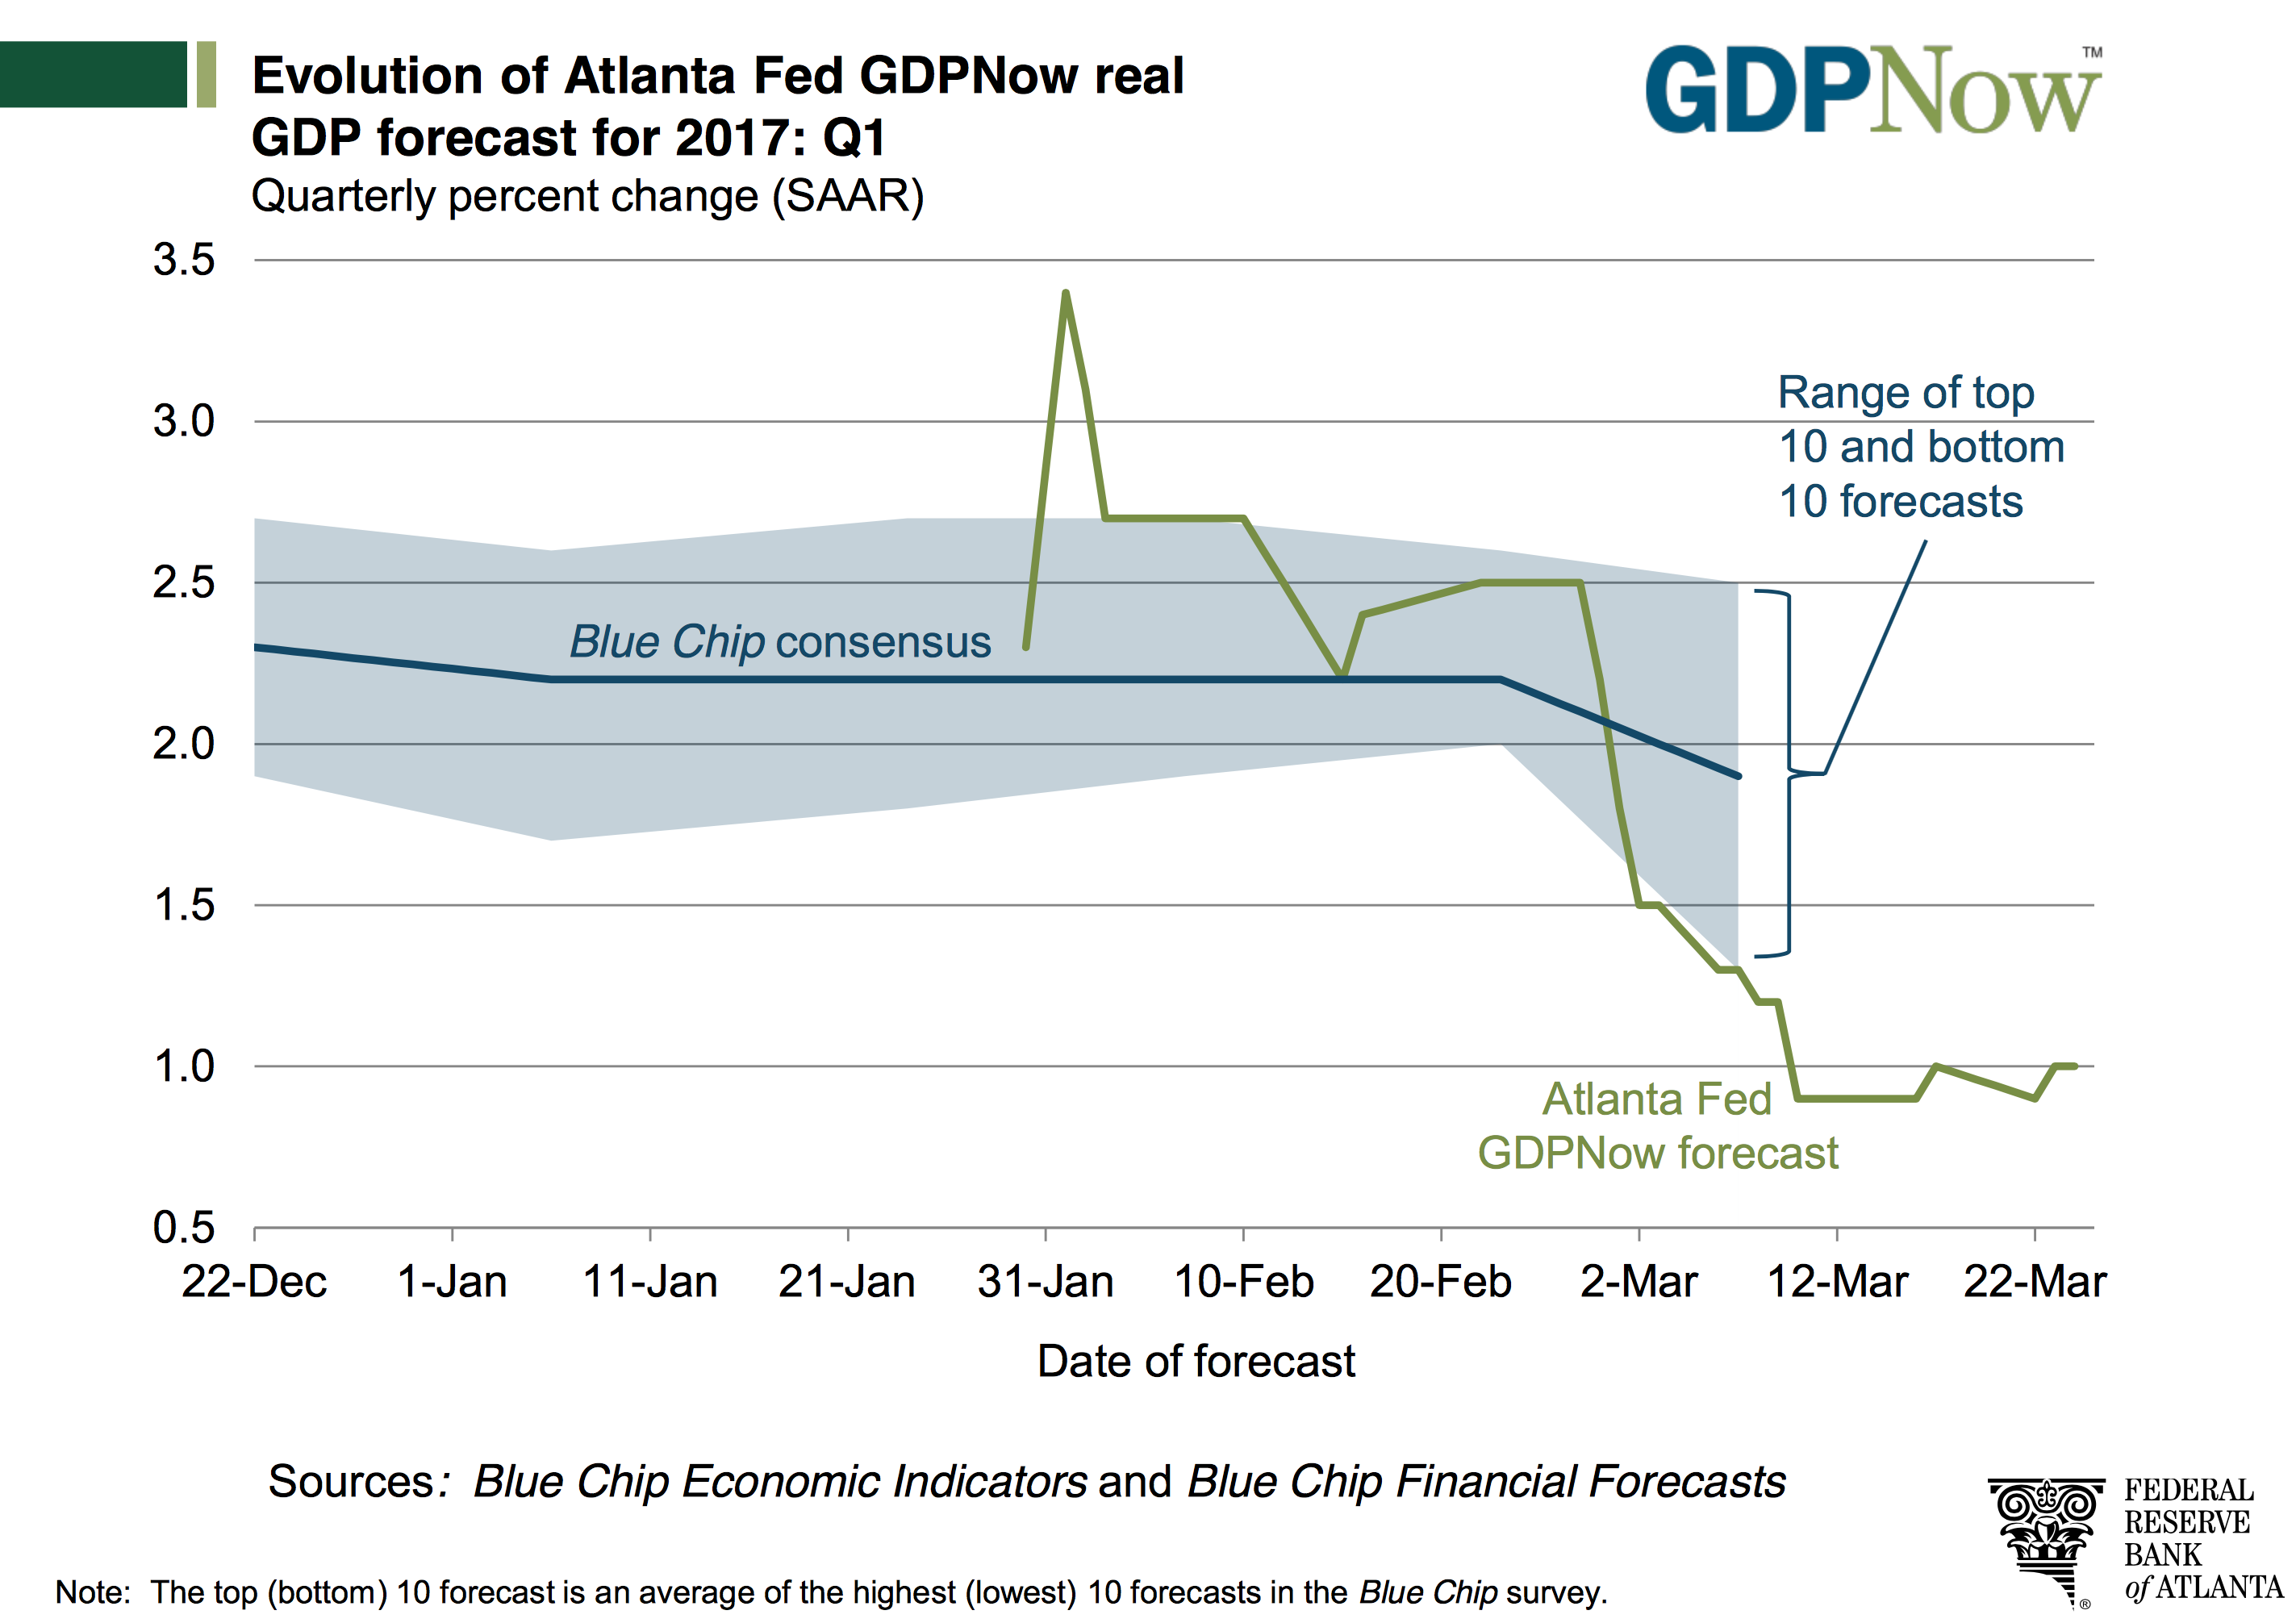
So here we are and the enthusiasm for the Trump Trade is being unraveled as growth slows once again. As depicted above, the most recent forecast for 1Q 2017 GDP from the AtlantaFed’s GDPNow sits at 1.0 percent compared to 1.9 percent for 4Q 2016 and 3.5 percent in 3Q 2016. Even a grade school student understands the slowing nature of that GDP trajectory. Despite all the upbeat confidence and sentiment indicators, the vector and velocity of GDP forecast revisions and push outs in the team Trump timing has led to to the downward move in S&P 500 EPS expectations for the current quarter and 2017 in full.

With Americans missing bank cards payments at the highest levels since July 2013, the delinquency rate for subprime auto loans hitting the highest level in at least seven years and real wage growth continuing to be elusive, the outlook for consumer spending looks questionable. Factor in the aging of the population, which will have additional implications, and it looks like the consumer-led US economy is facing more than a few headwinds to growth in the coming quarters. These same factors don’t bode very well for the already struggling brick & mortar retailers like Macy’s, Sears, JC Penney, Payless and others.

Now here’s the thing, currently, the S&P 500 is trading at 18x 2017 expectations —expectations that are more than likely to be revised down than up as the outlook for U.S. economic growth in the coming quarters is revisited. In three days, we close the books on 1Q 2017 and before too long it means we’ll be hip deep in corporate earnings reports. If what we’ve seen recently from Nike, FedEx, General Mills, Kroger and Target is the norm in the coming weeks, it means we’re more likely to see earnings expectations revised even lower for the coming year.

While it’s too early to say 2017 expectations will be revised as steeply as they were in 2016, (which started the year off with the expectation of a 7.6 percent increase year over year but ended with only a 0.5 percent increase following 4Q 2016 reporting), but any additional downward revisions will either serve to make the market even more expensive than it currently is or lead to a resumption of the recent downward move in the market. Either way, odds are there is a greater risk to the downside than the upside for the market in the coming weeks.

Buckle up; it’s bound to get a little bouncy.

Thematic Tailwinds and Headwinds Drive February Retail Sales 

Thematic Tailwinds and Headwinds Drive February Retail Sales 

This morning the US Department of Commerce published its February Retail Sales report, which was in line with expectations growing 0.1 percent compared to January. This report is always an interesting read due in part to the fact that we can look at the data a number of ways — month over month, year over year, and three-month comparisons on a trailing and year over year basis. As you can imagine, this can lead to quite a bit of confusion when trying to puzzle together exactly what the investing signal is coming out of that retail report noise.

Here’s our take on it featuring the thematic lens that we hang our hat at here at Tematica . . .

February 2017 vs. January 2017

Month over month retail sales climbed by 0.1 percent, in line with expectations. The four categories that saw faster spending growth than the average were furniture (+0.7 percent), building materials (+1.8 percent), health & personal care stores (+0.7 percent) and nonstore retailers (+1.2 percent). The sequential increase in building material demand, as well as furniture, fits with the mild winter weather that led to a pickup in construction employment and a stronger than seasonal pickup in housing starts.

The continued tick higher in health & personal care stores ties with our Aging of the Population investing theme. We continue to see this category rising faster than overall retail spending as the first baby boomers turn 70 this year with another 1.5 million each year for the next 15 years. The scary part is of these baby boomers, roughly only 50 percent have saved enough for retirement, which touches on our Cash Strapped Consumer investing theme.

Finally, we once again see Nonstore retailers taking consumer wallet share in February, which comes as no surprise as Amazon and other retailers continue to expand their service offerings and geographic footprints, while other traditional brick & mortar retailers focus on growing their direct to consumer business. In short, our Connected Society investing theme continues to transform retail.

Month over month weakness was had at electronics & appliance stores, clothing, and department stores. Compared to January gasoline station sales ticked down modestly as well, which we attribute to the essentially flat gasoline prices month over month per data from AAA.


February 2017 vs. February 2016

Year over year February Retail Sales excluding autos and food rose 5.9 percent led by a 19.6 percent increase in gasoline station sales, a 13.0 percent increase in Nonstore retail, a 7.3 percent rise in building materials, a 7.0 percent increase at health & personal care stores. Without question, the rise in gasoline station sales reflects the year over year 18 percent increase in gas prices per AAA data, while the milder winter we discussed earlier is likely pulling demand forward in construction and housing — we’ll look for February and March housing data to confirm this. The rise in gas prices reflects OPEC oil production cuts, which serves as a reminder that oil and other energy products are part of our Scarce Resource investing theme — there is only so much to be had, and production levels dictate supply.

As far as the year over year increase in health & personal care goes, it’s the same story — the Aging of the Population as Father Time is a tough customer to beat no matter how people embrace our Fountain of Youth investing theme. Finally, and certainly no surprise is the continued increase in Nonstore retail sales. Candidly, we see no slowdown in this Connected Society shift — all we need to do is look at the evolving shopping habits of the “younger” generation.

The two big declines were had were…. no surprise….. electronic & appliance stores, which fell 6 percent year over year, and department stores, which dropped 5.6 percent compared to February 2016.  With hhgregg (HGG) closing a good portion of its stores and JC Penney (JCP) recently announcing even more store closures, the results of these two categories, which are likely feeling the heat from Amazon (AMZN) in particular and others benefiting from the Connected Society tailwind, the results from these two categories is anything but surprising.

If we look at the three month rolling average on both a sequential and year over year basis, the leaders remained the same — building materials, gasoline stations, Nonstore retail and health & personal care. Behind each of these there is a clear thematic tailwind, even construction and housing, which is has historically been a beneficiary of the rising aspect of our Rise & Fall of the Middle Class investing theme. We’ll have a better sense of that with tomorrow’s February Housing Starts and Building Permits report.

And just in case anyone was holding out hope for electronics & appliance stores and department stores, the three-month rolling averages showed continued declines on both on a sequential and year over year basis. Nothing like a thematic headwind to throw cold water on your business.

The question to us is whether we will see more M&A chatter like we saw several weeks back with Macy’s (M) and more recently with Hudson Bay (TSE:HBC) being interested in Neiman Marcus. We can understand one company picking off well-positioned assets that might improve its overall customer mix, but we suspect there will be a number of companies left standing with no dance partners when this game of retail musical chairs is over. That means more companies going the way of Wet Seal than not, which means pain for mall REIT companies like Simon Property Group (SPG).

Before we go, we have to mention the piece by Tematica’s Chief Macro Strategist, better known on the Cocktail Investing Podcast as the High Priestess of Global Macro, Lenore Hawkins, which  called out the lack of weekly, year over year wage growth in February. Paired with higher prices, such as gas prices and others, that are leading to a pickup in reported inflation, it tells us our Cash-strapped Consumer investing theme has more room to go.

Hat tip to Lenore Hawkins, who added her special sauce and insights to this viewpoint. 

Note: Tematica’s subscription trading service, Tematica Pro, has a short position in SPG shares.