GDP and Corporate Growth

GDP and Corporate Growth

GDP and Corporate Growth

None of the four major components of the business cycle, (real income, sales, production and employment) have managed to get back to their 2007 highs, even now as we enter the fifth year of the recovery. This is truly a record, if an unfortunate one.

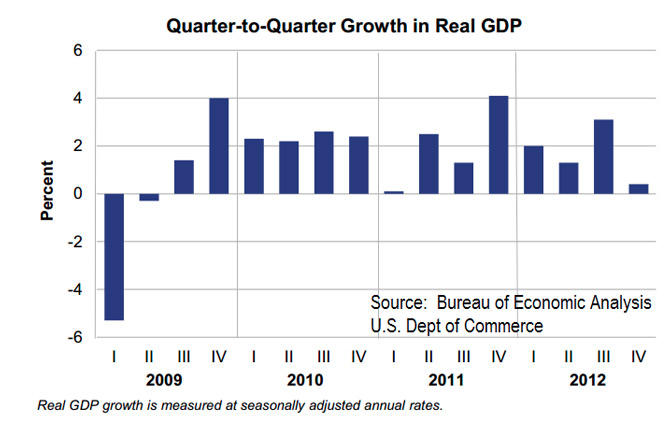
The chart above shows the continual stop and go pattern that has been GDP growth since the financial crisis. Never before in modern history has the U.S. experienced this many post-recession quarters without having at least one back-to-back 3% plus growth in GDP.  The first quarter of 2013 was reported on Friday April 26th to have grown by 2.5%, while the second quarter of 2013 is currently forecasted to be below 2%.

Corporate Earnings

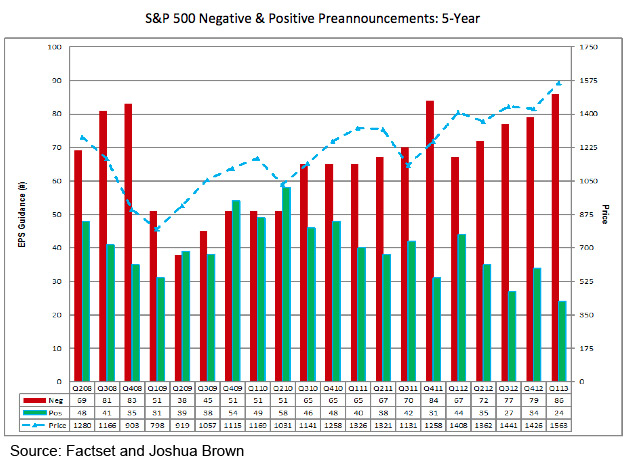
As we head into the first quarter’s earnings season, 78% of companies have issued negative earnings preannouncements, the highest percentage of companies issuing negative earnings guidance since FactSet began tracking the data in Q1 2006.

The chart above shows in red, the percent of negative preannouncements by quarter and in green the percent of positive preannouncements with the S&P in blue. This is a troublesome trend to say the least and has us watching the market movement carefully. Eventually, stock market growth must be supported by corporate earnings growth and the trend for the past 11 quarters has been fewer and fewer positive corporate earnings surprises, as this chart clearly illustrates. The quantitative easing objective of driving up stock prices in order to create a wealth effect that leads to consumers and businesses spending more is not translating into better than expected corporate earnings.


We've Hit The Tipping Point with Over 50% Not Paying Taxes

My friend Dan Mitchell, senior fellow at the Cato Institute, had a frightening blog post today.  According to the Ways and Means Committee, 51% of households paid no income tax in 2009.  Click here for his piece.

This is a dangerous tipping point as with over half of households paying no taxes, the incentives to increase government spending are horribly skewed in the voting population.  Why not vote for increased spending when it costs you nothing…. at least not immediately?   As we’ve seen across the world, the entire economy suffers when the government consumes too much of the economy, but that doesn’t always sink in when an individual is at the polling booth, looking for the easiest way to protect their own short-term interests.

Aside from the obvious moral hazard of this type of code, skewing the tax burden so heavily towards the higher income earners makes for vastly more volatile tax receipts than would result from a more broad-based system.  Higher income earners tend to have more volatile income levels, thus their annual tax payments vary more.  Government typically does not cut spending when there is a decline in tax receipts, but rather continues to increase expenditures year after year, regardless of receipts.  Simple math leads one to recognize that a system which generates volatile receipts and a government that tends to spend above the highest tax receipt level, will generate deficits more often than not thus growing national debt will be the name of the game.  This is not a sustainable system.

How and Why of Greek Debt

How and Why of Greek Debt

When a nation has more debt than it can manage, it has two options (1) inflate its way out by printing more money or (2) restructure the debt.

Typically the most politically feasible solution is to inflate.  Generally wages tend to keep up to some degree with inflation, so the employed feel as if they are getting a raise and don’t gripe too much.  Those in the population who have debts prefer inflation as the relative “cost” of their debt decreases over time, e.g. with 5% inflation, debt declines in real terms by 5% every year.  It is the savers who suffer most as they watch inflation eating away at what they’ve built – in a converse to inflation reducing debt, savings declines in value by 5% every year.  This is why inflation is often referred to as a hidden tax.

The Europeans cannot inflate their way out of too much debt for the PIIGS as the U.S. is way ahead of them in the race to the bottom and they have conflicting needs across countries.  A monetary union without a political, fiscal and cultural union is complicated at best.  So why the continued kick the can?  The largest banks (German Deutsche Bank, the French BNP Paribas, Société Générale and Crédit Agricole SA among many others) have not increased their reserve capital, which would dilute shareholders, and do not want to take losses on their significant holdings of PIIGS bonds.  The euphemistic “restructuring” of these bonds would by definition require some sort of write down in value for the banks.http://www.insidermonkey.com/blog/wp-content/uploads/2011/06/Who-holds-Greek-debt.jpg

Bank’s hold these bonds as assets on their balance sheets.  They are required to maintain a certain level of assets relative to the amount of loans they give.  If the value of their assets were to suddenly drop, they could find themselves in violation of the regulations concerning this ratio.  As you can imagine – that is not good for the banking sector and lending!  We saw the last time this occurred the credit markets effectively shut down, any type of borrowing was nearly impossible, and the engine of the global economy geared way down.

So how did the U.S. get out of the bog in which the Eurozone is currently mired?  In the Spring of 2009, the U.S. banks were eventually forced to raise hard common equity that was then used to absorb losses on loans.  The fixed income market did bottom out in the Fall of 2008, but when banks sought this equity, their stocks did not wither on the vine, albeit life wasn’t exactly rosy.  Rather than taking this approach, the International Monetary Fund (IMF), the European Central Bank (ECB) and the German and French banks are giving Greece just enough liquidity to roll their debt, not the permanent equity investments that were made here in the U.S.  The Euro approach is just a temporary patch on a cracking dam.  Only when the European banks raise equity, as we did here, and the PIIGS debt is restructured will there be a true resolution.

What does Fiscal or Monetary Policy mean?

What does Fiscal or Monetary Policy mean?

We hear a lot of talk about which government policies can help get the economy back on its feet. I thought I’d provide a quick cheat sheet on just what these various terms actually mean.

This chart shows the complete list of tools that the federal government has to affect the economy.  There are two main types of policy, monetary and fiscal.  When you hear monetary policy think Federal Reserve.  When you hear fiscal policy, think IRS and federal spending.

The Federal Reserve can alter two things to affect the economy, the Fed Funds rate and the Money Supply.

Interest Rates:  The Federal Funds target rate is the interest rate at which private depository institutions, (mostly banks) lend the funds they hold at the Federal Reserve to each other, generally overnight.  It can be thought of as the rate banks charge each other.  This target rate is identified in a meeting of the members of the Federal Open Market Committee which usually meets eight times a year.  The New York Fed affects this rate by trading government securities.

Money Supply:  The Federal Reserve typically alters the money supply by increasing or decreasing bank reserves.  (See prior post on Fractional Reserve Banking for details on bank reserves.)

Tax and Spend:  What else need be said?  Fiscal policy involves the government increasing or decreasing taxes and the amount of federal spending, which let’s face it, pretty much just goes up.

General Motors: Shame on you Ed Whitacre

Last night I watched the CEO of General Motors lie to the American people in a commercial that absolutely typifies the culture in Washington DC.  He stated that GM has repaid the TARP loan, “in full, with interest, five years ahead of schedule.”  Well now that sounds wonderful and aren’t we all just pleased as punch that the money the federal government could ill afford to give to GM was paid back “in full” so quickly?  Sadly, the fund were not paid back at all, and if fact GM is attempting to take even more money from taxpayers.

  • GM was given $49.5 billion by the federal government, $6.7 billion was a 7% loan with the remaining $42.8 billion going into a 60.8% equity stake.  (Canada gaive GM a $1.4 billion loan and “invested” $8.1 billion for an 11.7% equity position.  Together, the U.S. and Canada own a whopping 72.5% of GM!)


  • The $6.7 billion was paid back using funds from a government “working capital” escrow account containing $13.4 billion.  GM used a different TARP fund to pay back the original $6.7 billion loan… they just refinanced!


  • GM has applied to the Department of Energy for yet another $10 billion 5% interest loan to retool its plants for the CAFÉ standards.


Only a few media outlets are reporting this story for the ridiculous lie that it is.  Click here for a great piece by Shikha Dalmia at Forbes

For an economy to have a healthy investment climate, investors must be reasonably assured that the information they have been provided is accurate.  The American people own the majority of GM and the CEO of GM has just told one whopper of a lie to his shareholders.  Ed Whitacre, shame on you.  In any reasonable climate you would be fired, but in this world of half truths you are commended for telling people what they want to hear, even though the listeners know it is a lie.  Will this government sponsored deceit induce other CEO’s to lie to their shareholders?  As an investor, I become more and more wary of the accuracy of the information I am provided.  That is not the path to a robust economy.