Changes in Unemployment
Unemployment continues to be a drain on the economy and the ranks of those even searching for a job declines.
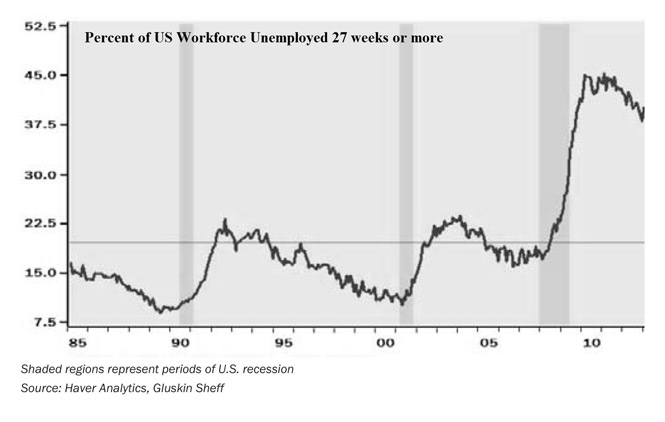
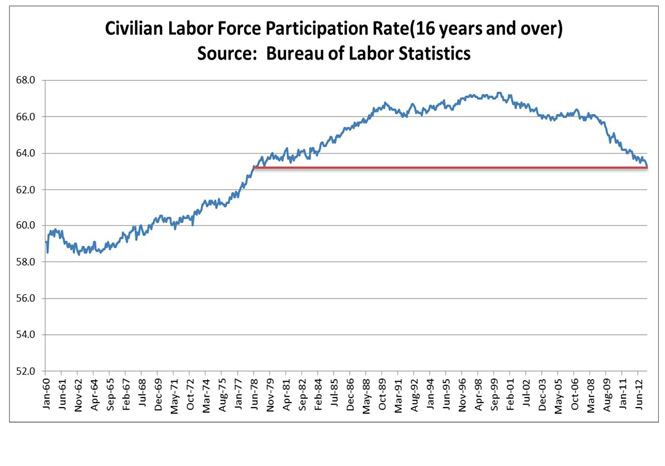
With such slow economic growth, it isn’t possible to get the unemployment situation to improve significantly, despite the attempts at upbeat headlines. On April 5th we learned that March experienced the biggest monthly increase in people dropping out of the labor force since January 2012, with 663,000 no longer looking for work. This means that we now have 90 million working age Americans who are not in the labor force. Of those, 6.5 million want a job and want to be in the labor force, (Bureau of Labor Statistics). The labor force participation rate has now dropped to 63.3% of the population, a level not seen since October 1978. The number of Americans officially unemployed has almost doubled since the market hit these levels in 2007 while the number of Americans on food stamps has risen to levels never before seen, with an almost an 80% increase since 2007. It is no wonder that consumer confidence continues to sit in recessionary territory. What is most troubling is that a full 40% of those unemployed have been long-term, (see chart below). Remember that the growth of our economy is dependent on the quality and quantity of labor and capital in the economy. With so many leaving the workforce and so many others out of work for an extended period, both quality and quantity are being materially reduced, which is a detriment to future growth prospects.