The Magic 8-Ball Market

The Magic 8-Ball Market

Last week ended with equity markets taking another dive that accelerated into Friday’s close as the trade war with China intensified heading into its eighteenth month with China announcing that it will impose retaliatory tariffs on US goods. The S&P 500 closed down 2.5% for the third time this month. After the close President Trump launched a twitter storm to announce additional retaliatory tariffs in response to China’s. So that’s going well.

Investors face challenging times as the major market movers have simply been words (tweets) coming from politicians and bureaucrats, the prediction of which is akin to assessing the next missive from a Magic 8-Ball.

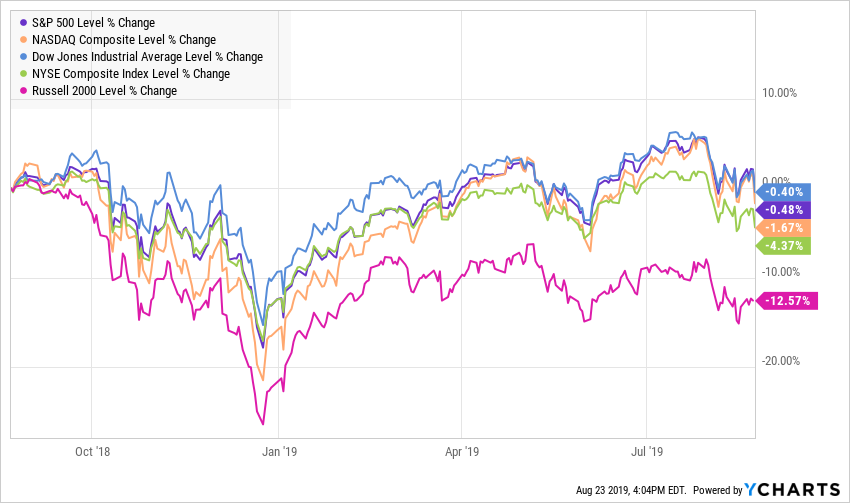
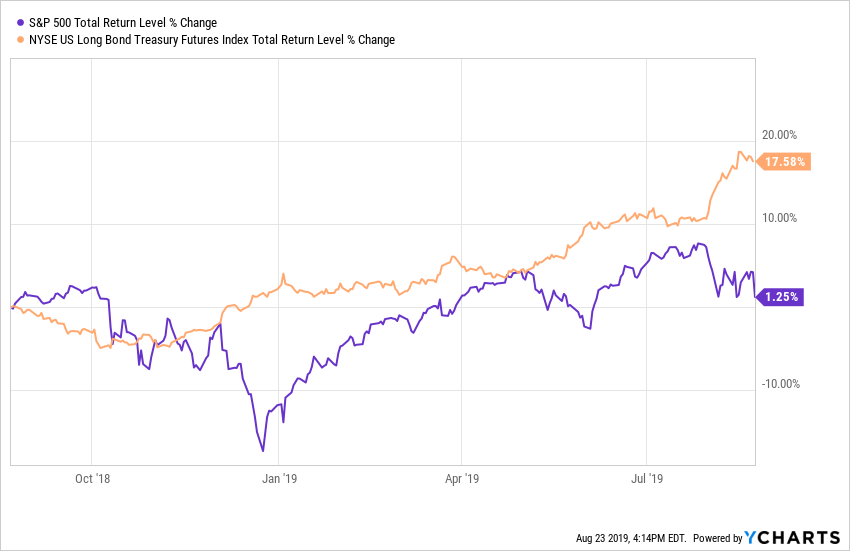
While many continue to talk about the ongoing bull market, the major US equity market indices have seen four consecutive weekly declines and are all in the red over the past year with the small cap Russell 2000 down well over 10%, sitting solidly in correction territory. On the other hand, this year has seen the strongest performance out of long-maturity Treasuries since at least 1987.
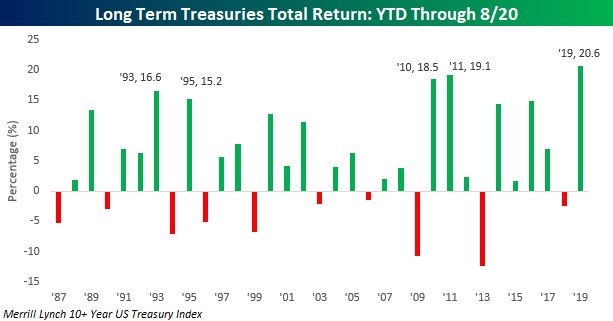
Source: Bespoke Investment Group

How many bull markets see the total return for the long bond outpace the S&P 500 by over 16%.
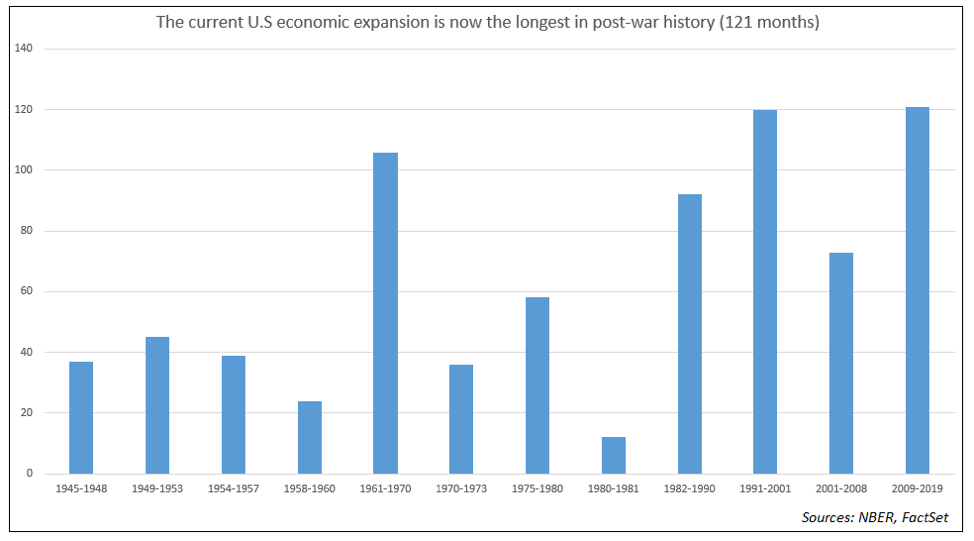
This comes at a time when the domestic economy is in it 121st month, the longest is post-war history, which means that many have not lived through a recession as an adult.

Yield Curve

As the adage goes, expansions don’t die of old age, but their footing becomes less sure over time and we are seeing signs of rockier terrain. One sign comes from the yield curve which has been flattening steadily since October 2018 with the spread between the 10-year and the 3-month falling from over 100 basis points to -39. The most widely watched part of the curve, between the 10-year and 2-year, has inverted four times in the past few weeks.
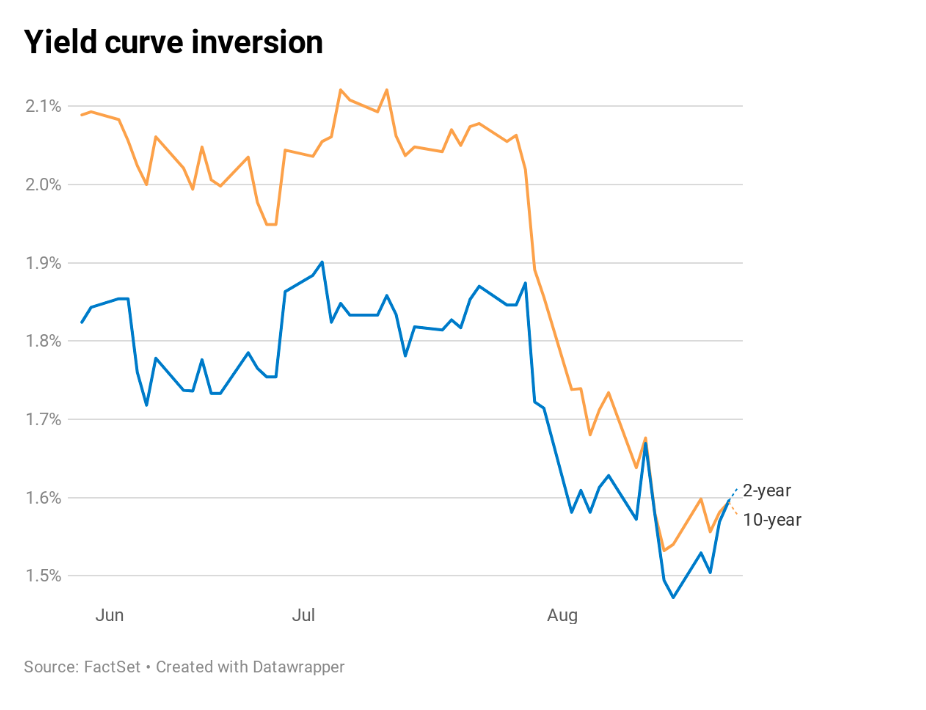

This 2-10 inversion is most closely watched as over the past 50 years it has preceded all seven recessions. Credit Suisse has found that on average a recession hit 22 months after the 2-10 inversion occurred.

The third of August’s four inversions came as Kansas City Federal Reserve President Esther George and Philadelphia Fed President Patrick Harker stated in a CNBC interview that they don’t see the case for additional interest rate cuts following the cut in July. Mr. Market was not looking to hear that.

This past week we also received the meeting minutes from the prior Fed meeting with led to July’s 25 basis point cut which gave the impression of a Fed far less inclined to cut than the market was expecting with most Fed participants seeing July’s cut as part of a recalibration but not part of a pre-set course for future cuts. Keep in mind that central bank rate cuts are a relative game and ECB officials have been signaling a high likelihood of significant accommodative measures at the September meeting, saying the ECB “will announce a package of stimulus measures at its next policy meeting in September that should overshoot investors’ expectations.”

Manufacturing

Another source of bumps on the economic road comes from the manufacturing sector, both domestic and international. A recent IHS Markit report found that the US manufacturing sector is in contraction for the first time in nearly a decade as the index fell from 50.4 in July to a 119-month low of 49.9 in August – readings below 50 indicate contraction.

According to the Institute for Supply Management, US manufacturing activity has slowed to a nearly three-year low in July. By August New Orders (a key leading indicator) had dropped by the most in 10 years with export sales falling to the lowest level since August 2009.

New business growth has slowed to its weakest rate in a decade, particularly across the service sector. Survey respondents mentioned headwinds from weak corporate spending based on slower growth expectations both domestically and internationally – likely caused by the ongoing trade war that got much, much worse this past week.

In a note to clients on August 11th, Goldman Sachs stated that fears of the US-China trade war leading to a recession are increasing and that the firm no longer expects a trade deal between the two before the 2020 US election. The firm also lowered its GDP forecast for the US in the fourth quarter by 20 basis points to 1.8%.

Global manufacturing has also been slowing, with just two of the G7 nations, Canada and France, currently showing expansion in the sector. In July, China’s industrial output growth slowed to the weakest level in 17 years.
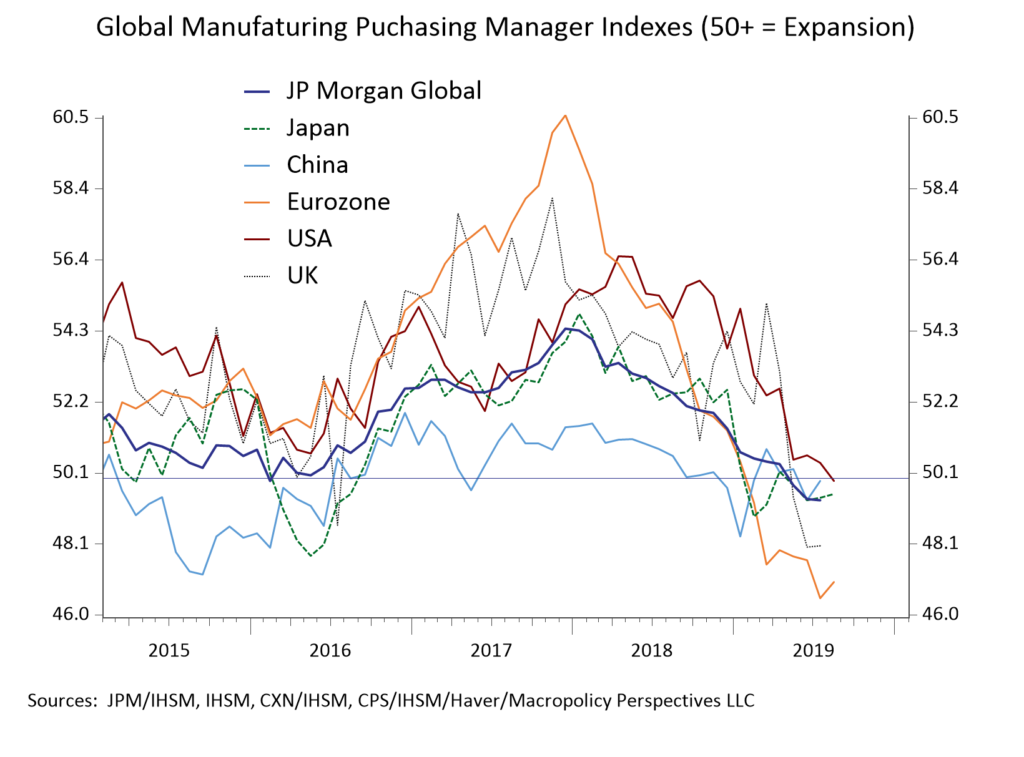
Germany is seeing the most pronounced contraction with its manufacturing PMI dropping from 63.3 in December 2017 to 43.6 this month. German car production has fallen to the levels last seen during the financial crisis.
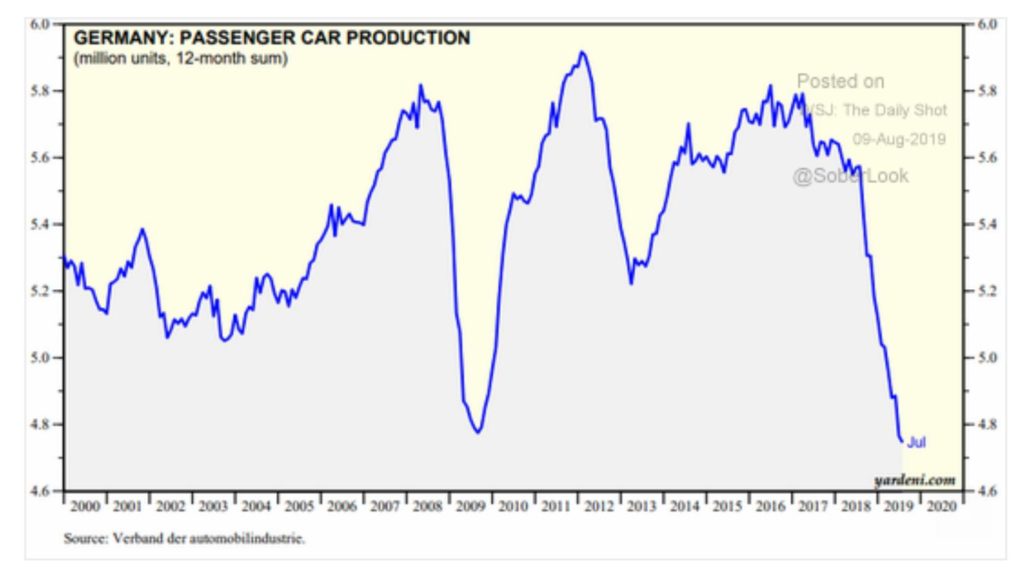
Overall, we see no sign of stabilization in global manufacturing as global trade volumes look to be rolling over, leaving the economy heavily dependent on growth in the Consumer and the Service sectors. Keep in mind that the last time global trade volumes rolled over like this was back in 2008.

The Consumer

The consumer is yet another source of bumps on the economic road. Ms. Pomboy’s tweet is perfect.
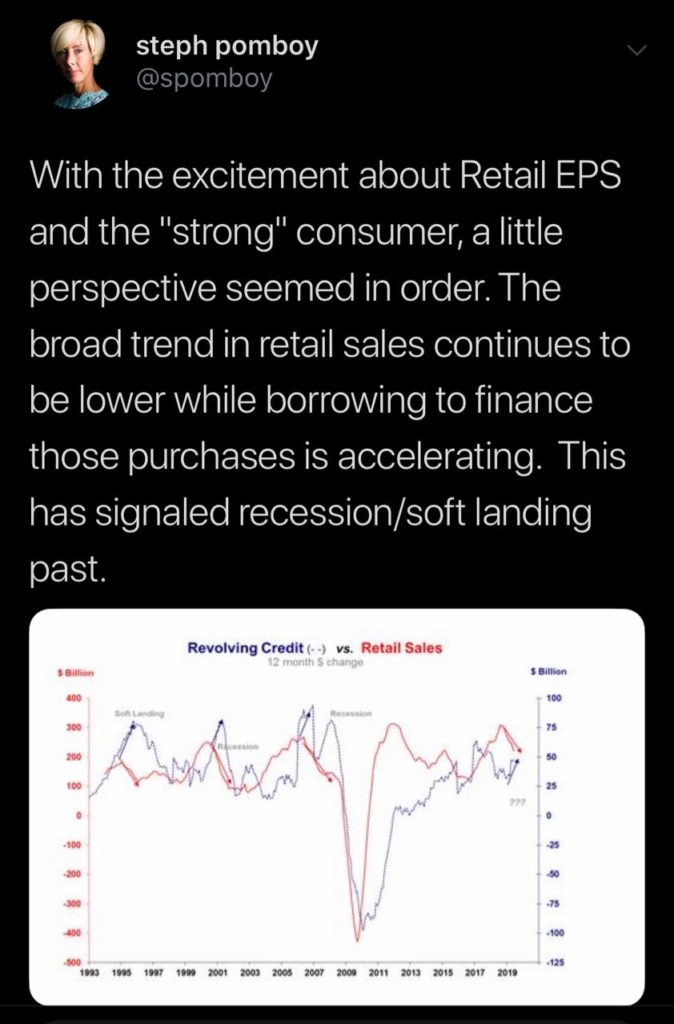
As for that debt, Citigroup recently reported that its credit-card delinquency rate had risen to 2.91% in July from 2.56% in June versus its three-month average of just 1.54%. With all the positive stock moves we’ve seen in retail, keep in mind that the story for many has been more about earnings than actual growth.

For example, Nordstrom (JWN) shares rose 21% after it delivered stronger-than-expected earnings, but that was off of weaker than expected revenue of $3.87 billion versus expectations for $3.93 billion. Nordstrom also slashed net sales guidance for the fiscal year as well as earnings guidance. Management forecast net sales for the year to decrease by about 2%. It previously estimated sales would be flat to 2% down. It also slightly lowered guidance on earnings per share to a range of $3.25 to $3.50, compared with the prior guidance of between $3.25 to $3.65. Did I mention shares rose 21%?

US Consumer sentiment fell to 92.1 in August, the lowest reading for 2019, versus expectations for 97 and down from 98.4 in July. If sentiment continues to degrade, how long will the consumer continue to load up credit cards in order to spend?

Debt

It isn’t just the consumer that is taking on more debt – yet more economic bumps. The federal government deficit rose by $183 billion to $867 billion during just the first 10 months of this fiscal year as spending grew at more than twice the rate of tax collections. The Congressional Budget Office expects the annual budget deficit to be more than 1 TRILLION dollars a year starting in 2022. Total public debt, which includes federal, state and local has reached a record 121% of GDP in 2019, up from 69% in 2000 and 43% in 1980.
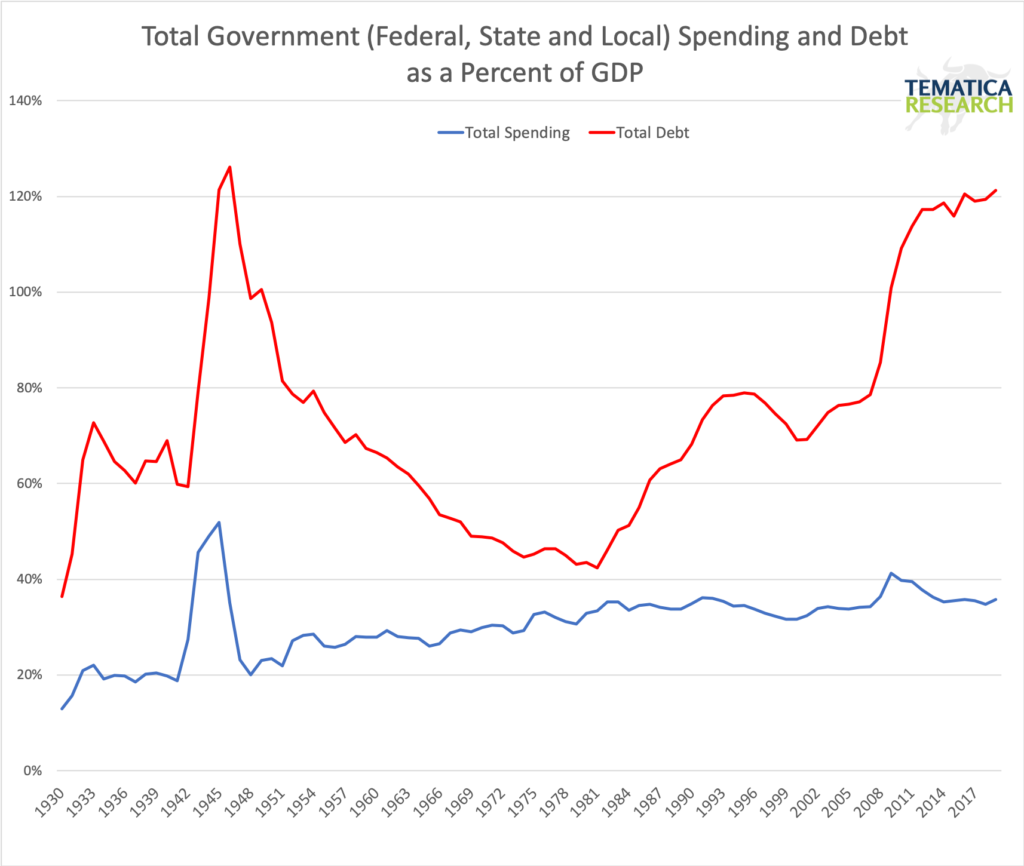
Keep in mind that debt is pulling resources out of the private sector and at such high levels, fiscal stimulus becomes more challenging in times of economic weakness. The only time debt to GDP has been higher was after WWII, but back then we had relatively young population and a rapidly growing labor force compared to today.

I’ve mentioned before that I am concerned with the strengthening dollar. Dollar denominated on balance sheet debt is over $12 trillion with roughly an additional $14 trillion in off-balance sheet dollar denominated debt – that’s a huge short USD position. The recent resolution of the debt ceiling issue means that the US Treasury now needs to rapidly rebuild its cash position as I had been funding the government through its reserves. This means that we will see a drain on global liquidity from the issue of over $200 billion in Treasury bills.

I’ve also written many times in the past concerning the dangers that lie in the enormous levels of corporate debt with negative yielding corporate debt rising from just $20 billion in January to pass the $1 trillion mark recently – more bumps on the road.

Bottom Line

As I said at the start of this piece, this expansion is the longest in post-war history which doesn’t itself mean a recession is imminent, but it does mean that the economy is likely to be more vulnerable. Looking next at the economic indicators we see quite a few that also imply a recession is increasingly likely.

The President’s twitter storm in response to China’s tariffs and the continually rising geopolitical uncertainties that create a strong headwind to any expansions in the private sector only increase risks further. Perhaps by the time you read this piece some part of the rapid escalation of the trade war will have been reversed, as foreign policy has become increasingly volatile day-to-day, but either way, the view from here is getting ugly.

Doubling Down on Digital Infrastructure Thematic Leader

Doubling Down on Digital Infrastructure Thematic Leader

Key point inside this issue

  • We are doubling down on Dycom (DY) shares on the Thematic Leader board and adjusting our price target to $80 from $100, which still offers significant upside from our new cost basis as the 5G and gigabit fiber buildout continues over the coming quarters.

We are coming at you earlier than usual this week in part to share my thoughts on all of the economic data we received late last week.


Last week’s data confirms the US economy is slowing

With two-thirds of the current quarter behind now in the books, the continued move higher in the markets has all the major indices up double-digits year to date, ranging from around 11.5-12.0%% for the Dow Jones Industrial Average and the S&P 500 to nearly 18% for the small-cap heavy Russell 2000. In recent weeks we have discussed my growing concerns that the market’s melt-up hinges primarily on U.S.-China trade deal prospects as earnings expectations for this year have been moving lower, dividend cuts have been growing and the global economy continues to slow. The U.S. continues to look like the best economic house on the block even though it, too, is slowing.

On Friday, a round of IHS Markit February PMI reports showed that three of the four global economic horsemen — Japan, China, and the eurozone — were in contraction territory for the month. New orders in Japan and China improved but fell in the eurozone, which likely means those economies will continue to slug it out in the near-term especially since export orders across all three regions fell month over month. December-quarter GDP was revealed to be 2.6% sequentially, which equates to a 3.1% improvement year over year but is down compared to the 3.5% GDP reading of the September quarter and 4.2% in the June one.  Slower growth to be sure, but still growing in the December quarter.

Before we break out the bubbly, though, the IHS Markit February U.S. Manufacturing PMI fell to its lowest reading in 18 months as rates of output and new order growth softened as did inflationary pressures. This data suggest the U.S. manufacturing sector is growing at its slowest rate in several quarters, as did the February ISM Manufacturing Index reading, which slipped month over month and missed expectations. Declines were seen almost across the board for that ISM index save for new export orders, which grew modestly month over month. The new order component of the February ISM Manufacturing Index dropped to 55.5 from 58.2 in January, but candidly this line item has been all over the place the last few months. The January figure rebounded nicely from 51.3 in December, which was down sharply from 61.8 in November. This zig-zag pattern likely reflects growing uncertainty in the manufacturing economy given the pace of the global economy and uncertainty on the trade front. Generally speaking though, falling orders translate into a slower production and this means carefully watching both the ISM and IHS Markit data over the coming months.

In sum, the manufacturing economy across the four key economies continued to slow in February. On a wider, more global scale, J.P. Morgan’s Global Manufacturing PMI fell to 50.6 in February, its lowest level since June 2016. Per J.P. Morgan’s findings, “the rate of expansion in new orders stayed close to the stagnation mark,” which suggests we are not likely to see a pronounced rebound in the near-term. We see this as allowing the Fed to keep its dovish view, and as we discuss below odds are it will be joined by the European Central Bank this week.

Other data out Friday included the December readings for Personal Income & Spending and the January take on Personal Income. The key takeaway was personal income fell for the first time in more than three years during January, easily coming in below the gains expected by economists. Those pieces of data not only help explain the recent December Retail Sales miss but alongside reports of consumer credit card debt topping $1 trillion and record delinquencies for auto and student loans, point to more tepid consumer spending ahead. As I’ve shared before, that is a headwind for the overall US economy but also a tailwind for those companies, like Middle-class Squeeze Thematic Leader Costco Wholesale (COST), that help consumers stretch the disposable income they do have.

We have talked quite a bit in recent Tematica Investing issues about revisions to S&P 500 2019 EPS estimates, which at last count stood at +4.7% year over year, down significantly from over +11% at the start of the December quarter. Given the rash of reports last week – more than 750 in total –  we will likely see that expected rate of growth tweaked a bit lower.

Putting it all together, we have a slowing U.S. and global economy, EPS cuts that are making the stock market incrementally more expensive as it has moved higher in recent weeks, and a growing number of dividend cuts. Clearly, the stock market has been melting up over the last several weeks on increasing hopes over a favorable trade deal with China, but last week we saw President Trump abruptly end the summit with North Korea’s Kim Jong Un with no joint agreement after Kim insisted all U.S. sanctions be lifted on his country. This action spooked the market, leading some to revisit the potential for a favorable trade deal between the U.S. and China.

Measuring the success of any trade agreement will hinge on the details. Should it fail to live up to expectations, which is a distinct possibility, we could very well see a “buy the rumor, sell the news” situation arise in the stock market. As I watch for these developments to unfold, given the mismatch in the stock market between earnings and dividends vs. the market’s move thus far in 2019 I will also be watching insider selling in general but also for those companies on the Thematic Leader Board as well as the Tematica Select List. While insiders can be sellers for a variety of reasons, should we see a pronounced and somewhat across the board pick up in such activity, it could be another warning sign.


What to Watch This Week

This week we will see a noticeable drop in the velocity of earnings reports, but we will still get a number of data points that investors and economists will use to triangulate the speed of the current quarter’s GDP relative to the 2.6% print for the December quarter. The consensus GDP forecast for the current quarter is for a slower economy at +2.0%, but we have started to see some economists trim their forecasts as more economic data rolls in. Because that data has fallen shy of expectations, it has led the Citibank Economic Surprise Index (CESI) to once again move into negative territory and the Atlanta Fed’s GDPNow current quarter forecast now sat at 0.3% as of Friday.

On the economic docket this week, we have December Construction Spending, ISM’s February Non-Manufacturing Index reading, the latest consumer credit figures and the February reports on job creation and unemployment from ADP (ADP) and the Bureau of Labor Statistics. With Home Depot (HD) reporting relatively mild December weather, any pronounced shortfall in December Construction Spending will likely serve to confirm the economy is on a slowing vector. Much like we did above with ISM’s February Manufacturing Index we’ll be looking into the Non-Manufacturing data to determine demand and inflation dynamics as well as the tone of the services economy.

On the jobs front, while we will be watching the numbers created, including any aberration owing to the recent federal government shutdown, it will be the wage and hours worked data that we’ll be focusing on. Wage data will show signs of any inflationary pressures, while hours worked will indicate how much labor slack there is in the economy. The consumer is in a tighter spot financially speaking, which was reflected in recent retail sales and personal spending data. Recognizing the role consumer spending plays in the overall speed of the U.S. economy, we will be scrutinizing the upcoming consumer credit data rather closely.

In addition to the hard data, we’ll also get the Fed’s latest Beige Book, which should provide a feel for how the regional economies are faring thus far in 2019. Speaking of central bankers, next Wednesday will bring the results of the next European Central Bank meeting. Given the data depicted in the February IHS Markit reports we discussed above, the probability is high the ECB will join the Fed in a more dovish tone.

While the velocity of earnings reports does indeed drop dramatically next week, there will still be several reports worth digging into, including Ross Stores (ROST), Kohl’s (KSS), Target (TGT), BJ’s Wholesale (BJ), and Middle-class Squeeze Thematic Leader Costco Wholesale (COST) will also issue their latest quarterly results. Those reports combined with the ones this week, including solid results from TJX Companies (TJX) last week should offer a more complete look at consumer spending, and where that spending is occurring. Given the discussion several paragraphs above, TJX’s results last week, and the monthly sales reports from Costco, odds are quite good that Costco should serve up yet another report showcasing consumer wallet share gains.

Outside of apparel and home, reports from United Natural Foods (UNFI) and National Beverage (FIZZ) should corroborate the accelerating shift toward food and beverages that are part of our Cleaner Living investing theme. In that vein, I’ll be intrigued to see what Tematica Select List resident International Flavors & Fragrances (IFF) has to say about the demand for its line of organic and natural solutions.

The same can be said with Kroger (KR) as well as its efforts to fend off Thematic King Amazon (AMZN) and Walmart (WMT). Tucked inside of Kroger’s comments, we will be curious to see what the company says about digital grocery shopping and delivery. On Kroger’s last earnings conference call, Chairman and CEO Rodney McMullen shared the following, “We are aggressively investing to build digital platforms because they give our customers the ability to have anything, anytime, anywhere from Kroger, and because they’re a catalyst to grow our business and improve margins in the future.” Now to see what progress has been achieved over the last 90 or so days and what Kroger has to say about the late-Friday report that Amazon will launch its own chain of supermarkets.


Tematica Investing

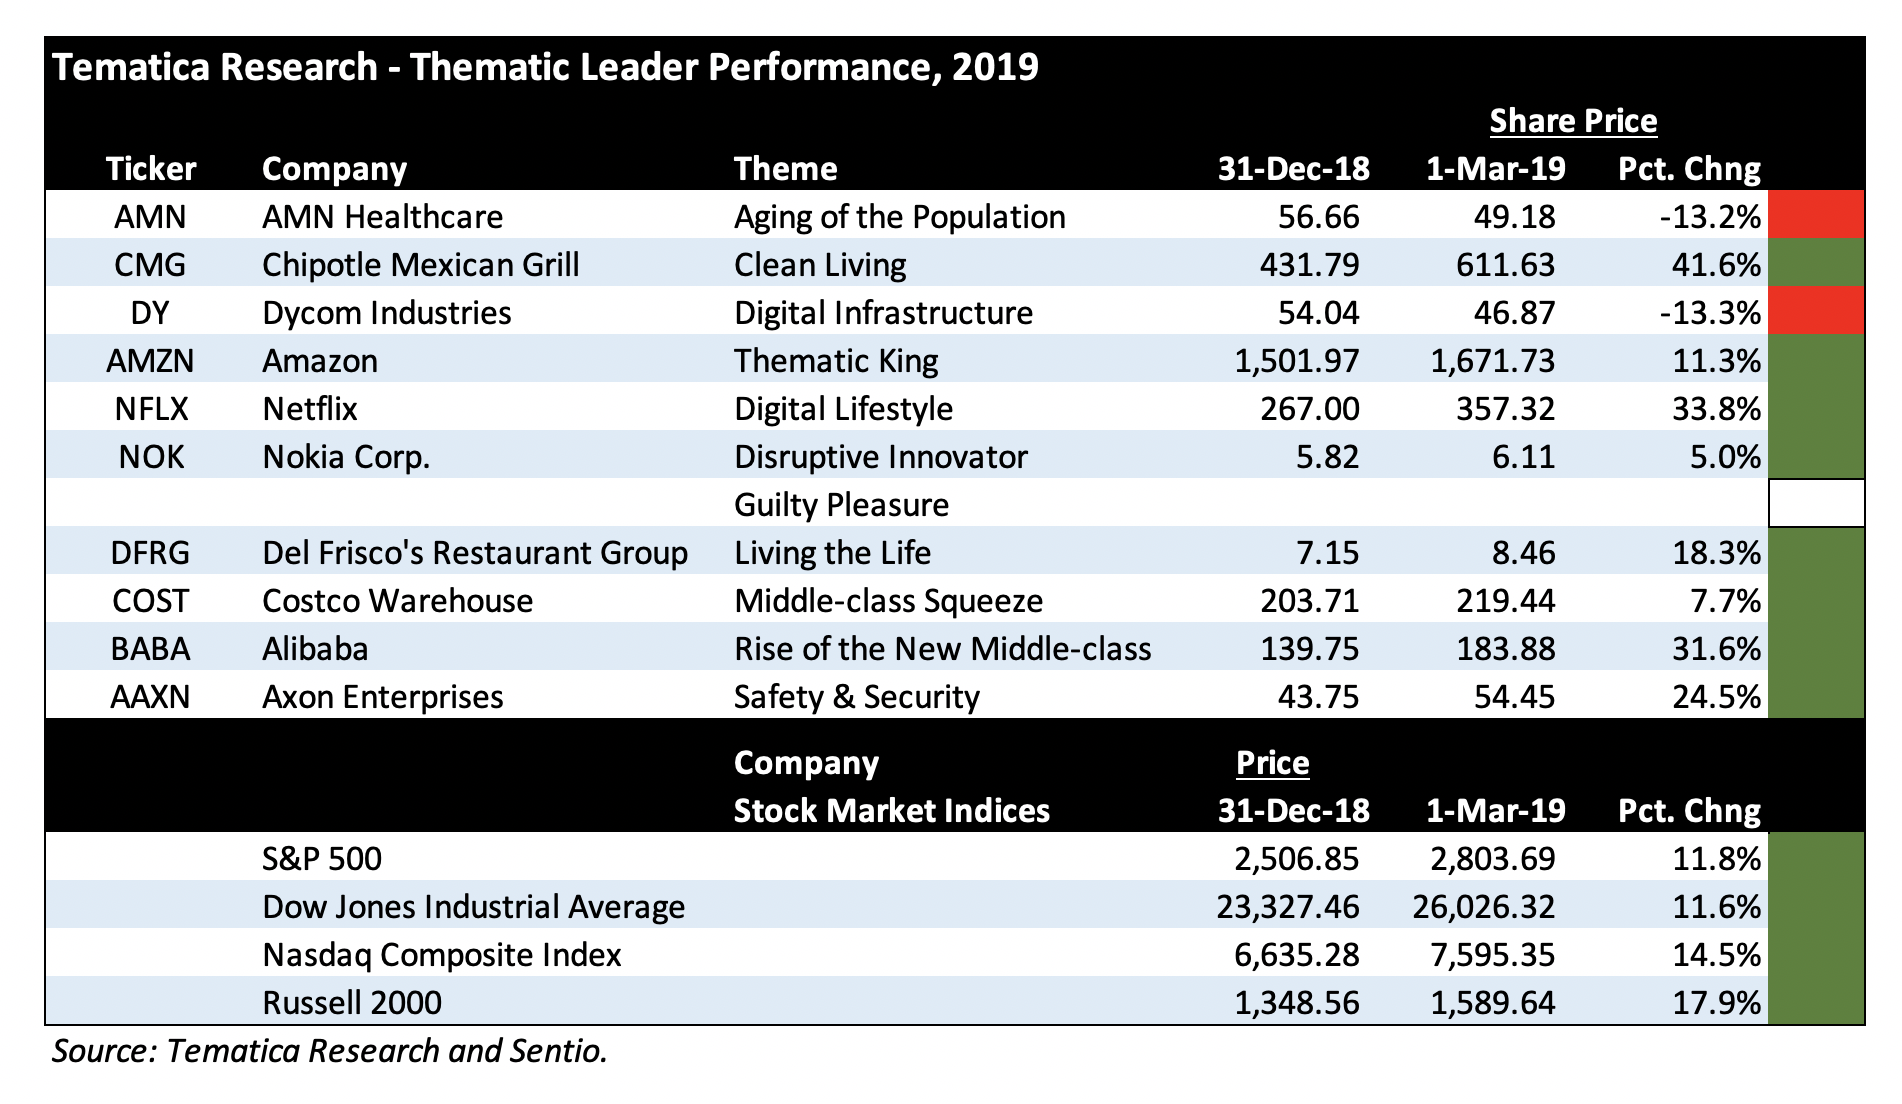
As you can see in the chart above, for the most part, our Thematic Leaders have been delivering solid performance. Shares of Costco Wholesale (COST) and Nokia (NOK) are notable laggards, but with Costco’s earnings report later this week which will also include its February same-store sales, I see the company’s business and the shares once again coming back into investor favor as it continues to win consumer wallet share. That was clearly evident in its December and January same-store sales reports. With Nokia, coming out of Mobile World Congress 2019 last week, we have confirmation that 5G is progressing, with more network launches coming and more devices coming as well in the coming quarters. We’ll continue to be patient with NOK shares.


Adding significantly to our position in Thematic Leader Dycom Industries

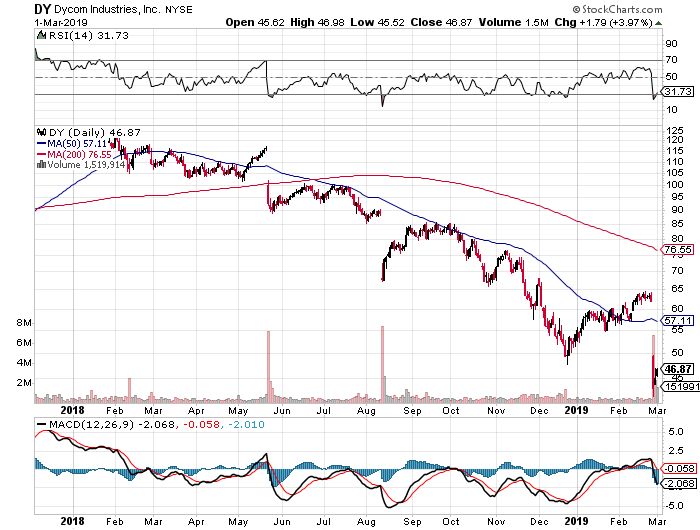
There are two positions on the leader board – Aging of the Population AMN Healthcare (AMN) and Digital Infrastructure Dycom Industries (DY) – that are in the red. The recent and sharp drop in Dycom shares follows the company’s disappointing quarterly report in which costs grew faster than 14.3% year over year increase in revenue, pressuring margins and the company’s bottom line. As we’ve come to expect this alongside the near-term continuation of those margin pressures, as you can see below, simply whacked DY shares last week, dropping them into oversold territory.


When we first discussed Dycom’s business, I pointed out the seasonal tendencies of its business, and that likely means some of the February winter weather brought some added disruptions as will the winter weather that is hitting parts of the country as you read this. Yet, we know that Dycom’s top customers – AT&T (T), Verizon (VZ), Comcast (CMCSA) and CenturyLink (CTL) are busy expanding the footprint of their connective networks. That’s especially true with the 5G buildout efforts at AT&T and Verizon, which on a combined basis accounted for 42% of Dycom’s January quarter revenue.

Above I shared that coming out of Mobile World Congress 2019, commercial 5G deployments are likely to be a 2020 event but as we know the networks, base stations, and backhaul capabilities will need to be installed ahead of those launches. To me, this strongly suggests that Dycom’s business will improve in the coming quarters, and as that happens, it’s bound to move down the cost curve as efficiencies and other aspects of higher utilization are had. For that reason, we are using last week’s 26% drop in DY shares to double our position size in DY shares on the Thematic Leader board. This will reduce our blended cost basis to roughly $64 from the prior $82. As we buy up the shares, I’m also resetting our price target on DY shares to $80, down from the prior $100, which offers significant upside from the current share price and our blended cost basis.

If you’re having second thoughts on this decision, think of it this way – doesn’t it seem rather strange that DY shares would fall by such a degree given the coming buildout that we know is going to occur over the coming quarters? If Dycom’s customers were some small, regional operators I would have some concerns, but that isn’t the case. These customers will build out those networks, and it means Dycom will be put to work in the coming quarters, generating revenue, profits, and cash flow along the way.

In last week’s Tematica Investing I dished on Warren Buffett’s latest letter to Berkshire Hathaway (BRK.A) shareholders. In thinking about Dycom, another Buffett-ism comes to mind – “Opportunities come infrequently. When it rains gold, put out the bucket, not the thimble.” Since this is a multi-quarter buildout for Dycom, we will need to be patient, but as we know for the famous encounter between the tortoise and the hare, slow and steady wins the race.

  • We are doubling down on Dycom (DY) shares on the Thematic Leader board and adjusting our price target to $80 from $100, which still offers significant upside from our new cost basis as the 5G and gigabit fiber buildout continues over the coming quarters.


As the pace of earnings slows, over the next few weeks I’ll not only be revisiting the recent 25% drop in Aging of the Population Thematic Leader AMN Healthcare to determine if we should make a similar move like the one we are doing with Dycom, but I’ll also be taking closer looks at wireless charging company Energous Corp. (WATT) and The Alkaline Water Company (WTER). Those two respectively fall under our Disruptive Innovators and Cleaner Living investing themes. Are they worthy of making it onto the Select List or bumping one of our Thematic Leaders? We’ll see…. And as I examine these two, I’m also pouring over some candidates to fill the Guilty Pleasure vacancy on the leader board.


Breaking down the ISM Manufacturing Report plus Paccar and Costco updates

Breaking down the ISM Manufacturing Report plus Paccar and Costco updates

Key points inside this issue

  • While the August ISM Manufacturing Report shows an improving economy, it also confirms inflation is percolating as well.
  • An earnings beat and robust outlook at heavy truck and engine company Navistar (NAV), keeps us bullish on Paccar (PCAR). Our PCAR price target remains $85.
  • Our price target on Costco Wholesale (COST) shares remains $230 heading into the company’s same-store-sales report after tonight’s market close.

This week we started to get our first firm look at the domestic economy for the month of August. The first piece of data was the ISM Manufacturing Index for August, which came in at 61.3, the highest reading in the last 12 months and a sequential improvement from 58.1 in July. In pulling back the covers on the index’s components, we find the forward-looking components – net orders and the backlog of orders – move up nicely month over month suggesting the manufacturing economy will continue to grow this month. The same, however, can be said for the Price component, which registered 72.1 for August. While down from July’s 73.2 figure, sixteen of the surveyed 18 industries reported paying increased prices for raw materials in August. With the August Prices reading well above the expansion vs. contraction line that is 50, the modest tick down in that sub-index does little to suggest the FOMC won’t boost interest when it meets later this month.

With regard to the report and the current trade wars, new export orders in August ticked lower to 55.2, down a meager 0.1 month over month. We’ll continue to monitor this and related data to assess the actual impact of the current trade wars for as long as they are occurring. As a reminder, by the end of this week, the US could impose tariffs on roughly half of all Chinese goods entering the country. Estimates put that figure at $200 billion, a step up from the $34 billion that had tariffs placed on them in July and the additional $16 billion last month. Should this latest round of tariffs go into effect, odds are we will see China follow suit with another round of its own tariff increases on US goods.

Drilling into the employment component of the ISM Manufacturing Report, it jumped to 58.5 in August, up from 56.5 in July. Given the historical relationship between this component and the Bureau of Labor Statistics (BLS) Employment Report – a reading in the ISM employment index above 50.8 percent, is generally consistent with an increase in the (BLS) data on manufacturing employment – odds are Friday’s Employment Report could surprise to the upside. To us, the real figure to watch inside that report, however, will be average hourly earnings to see how it stacks up against the data pointing to mounting inflation to be had in the economy. As we’ve said before, if wage growth lags relative to that data, it could put the brakes on the robust consumer spending we’ve seen in recent months.


An update on Paccar and a reminder on Costco Wholesale

Turning to the portfolio, this morning heavy truck and engine company Navistar (NAV) reported better than expected quarterly earnings due to continued strength in the heavy truck market. We see that as well as Navistar’s upsized heavy truck industry delivery forecast to 260,000-280,000 from the prior 250,000-280,000 as a positive for our Paccar (PCAR) shares. The same can be said from the recent July report on truck tonnage released by the American Trucking Association that showed an 8.6% year over year increase for the month, sequentially stronger than the 7.7% increase in June. The activity had with that ATA report suggest not only a pick up in the domestic economy, but the pain point of the current truck shortage continues to be felt, which bodes well for continued new order flow.

  • Our price target on Paccar (PCAR) shares remains $85.

After tonight’s close, Costco Wholesale (COST) will report its August same-store-sales figures, which we expect will continue the recent string of favorable reports. We’ll also be looking for an update on the number of open warehouses, a leading indicator for its high margin membership fee revenue stream. Based on the report, we will look to revisit our current $230 price target on COST shares.

  • Our price target on Costco Wholesale (COST) shares remains $230 for now.