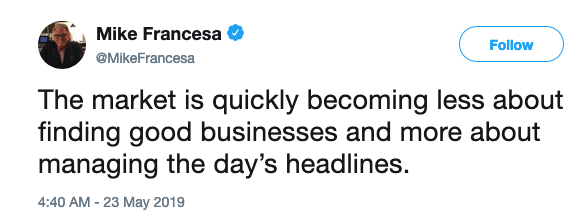
Turning Heads I Win, Tails You Lose Inside Out
For much of the current expansion, cycle investors have been forced taught to believe in a Heads-I-Win-Tales-You-Lose investing environment in which good economic news was good for equities and bad economic news was also good for equities. Good news obviously indicates a positive environment, but bad news meant further central bank intervention, which would inevitably raise asset prices.
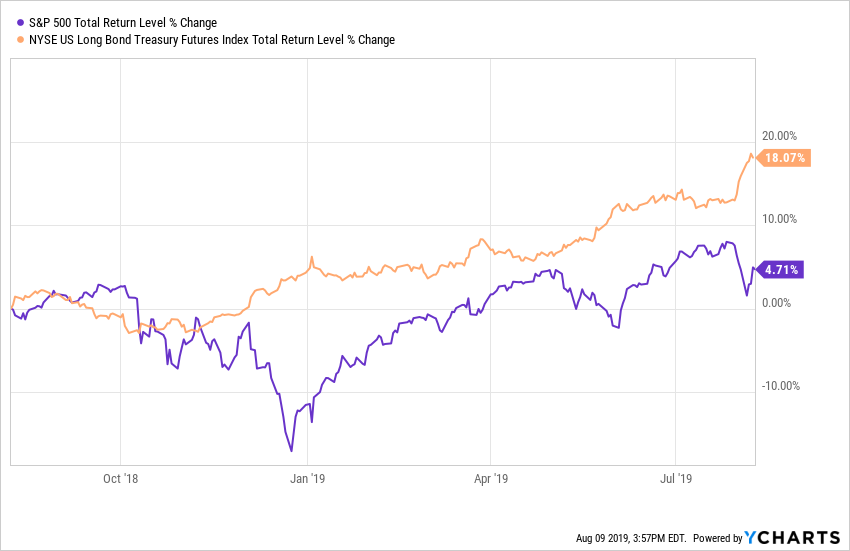
Those who didn’t buy-the-dip were severely punished. Many fund managers who dared to take fundamentals into consideration and were wary, or put on portfolio protection, saw their clients take their money and go elsewhere. An entire generation of market participants learned that it’s easy to make money, just buy the dip. That mode just may be changing as the past two weeks the major indices have taken some solid hits. Keep in mind that while the headlines keep talking up the equity markets, the total return in the S&P 500 has been less than 5% while the long bond has returned over 18%. Austria’s century bond has nearly doubled in price since it was first offered less than two years ago!
Earnings Season Summary
So far, we’ve heard from just under 2,000 companies with the unofficial close to earnings season coming next week as Wal Mart (WMT) reports on the 15th. The EPS beat rate has fallen precipitously over the past week down to 57.2%, which if it holds, will be the lowest beat rate since the March quarter of 2014. Conversely, the top line beat rate has risen over the past week to 57.4% which is slightly better than last quarter, but if it holds will be (excepting last quarter) the weakest in the past 10 quarters. The difference between the percent of companies raising guidance versus percentage lowering is down to -1.8% and has now been negative for the past four quarters and is below the long-term average.
With 456 of the 505 S&P 500 components having reported, the blended EPS growth estimate is now -0.72% year-over-year, with six of the eleven sectors experiencing declining EPS. This follows a -0.21% decline in EPS in Q1, giving us (if this holds) an earnings recession. The last time we experienced such a streak was the second quarter of 2016.
The Fed Disappoints
Last week Jerome Powell and the rest of his gang over at the Federal Reserve cut interest rates despite an economy (1) the President is calling the best ever, (2) an unemployment rate near the lowest level since the 1960s, at a (3) time when financial conditions are the loosest we’ve seen in over 16 years and (4) for the first time since the 1930s, the Fed stopped a tightening cycle at 2.5%. We have (5) never seen the Fed cut when conditions were this loose. They were looking to get some inflation going, Lord knows the growing piles of debt everywhere would love that, but instead, the dollar strengthened, and the yield curve flattened. Oops. That is not what the Fed wanted to see.
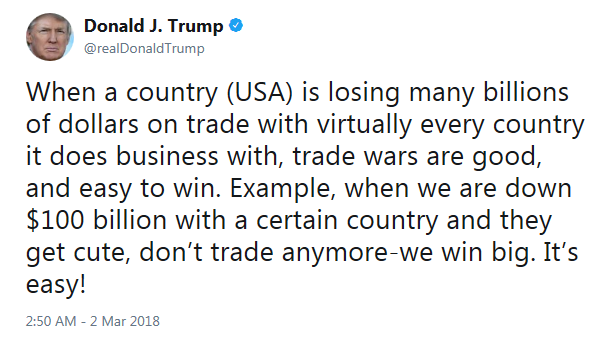
The President was not pleased. “What the Market wanted to hear from Jay Powell and the Federal Reserve was that this was the beginning of a lengthy and aggressive rate-cutting cycle which would keep pace with China, The European Union and other countries around the world,” he said in a tweet. “As usual, Powell let us down.”
The dollar’s jump higher post-announcement means that the Fed in effect tightened policy by 20 basis points. Oops2. The takeaway here is that the market was not impressed. It expected more, it priced in more and it wants more. Now the question is, will the Fed give in and give the market what it wants? Keep in mind that both the European Central Bank and the Bank of England are turning decisively more dovish, which effectively strengthens the dollar even further.
Looking at past Fed commentary, the track record isn’t exactly inspirational for getting the all-important timing right.
But, we think the odds favor a continuation of positive growth, and we still do not yet see enough evidence to persuade us that we have entered, or are about to enter, a recession.” Alan Greenspan, July 1990
“The staff forecast prepared for this meeting suggested that, after a period of slow growth associated in part with an inventory correction, the economic expansion would gradually regain strength over the next two years and move toward a rate near the staff’s current estimate of the growth of the economy’s potential output.” FOMC Minutes March 20, 2001
“At this juncture, however, the impact on the broader economy and financial markets of the problems in the subprime market seems to likely be contained.” Ben Bernanke, March 2007
“Would I say there will never, ever be another financial crisis? You know probably that would be going too far but I do think we’re much safer and I hope that it will not be in our lifetimes and I don’t believe it will be.” Janet Yellen, June 2017 (This one is going to be a real doozy)
This time around Fed Chairman Powell told us that what we are getting is a “mid-cycle policy adjustment.” Wait, what? We are now (1) in the longest expansion in history with (2) the lowest unemployment rate in over 50 years as (3) corporate leverage levels reaching record levels at a (4) time when more of it is rated at just above junk than ever before in history. This is mid-cycle? I’m pretty sure this one will be added to the above list as some serious Fed facepalming. Now I think these folks are incredibly bright, but they are just tasked with an impossible job and live in a world in which their peers believe they can and ought to finesse the economy. So far that theory hasn’t turned out all that well for anyone who doesn’t already have a good-sized pile of assets.
Domestic Economy (in summary because it is August after all)
- We are 3-year lows for the US ISM manufacturing and services PMIs.
- We are seeing a shrinking workweek, contracting manufacturing hours and factory overtime is at an 8-year low.
- Just saw a contraction in the American consumer’s gasoline consumption.
- American households just cut their credit card balances, something that happens only about 10% of the time during an expansion. Keep in mind that Q2 consumer spending was primarily debt-fueled when looking towards Q3 GDP.
- The Organization for Economic Co-operation and Development (OECD) Leading Economic Indicator for the US fell to a 10-year low in June, having declined for 18 consecutive months. A streak of this nature has in the past always been indicative of a recession. Interestingly that same indicator for China just hit a 9-month high.
- The Haver Analytics adjusted New York Fed recession risk model has risen from 50% in early January to a 10-year high of 80%.
Global Economy
- The IMF has cut world GDP forecasts for the fourth consecutive time.
- We have 11 countries so far in 2019 experiencing at least one quarter of shrinking GDP and 17 central banks are in cutting mode with Peru the latest to cut, the Royal Bank of Australia hinting at further cuts and Mexico and Brazil likely next in line.
- Some 30% of the world’s GDP is experiencing inverted yield curves.
- Over half the world’s bond market is trading below the Fed funds rate.
- Despite the sanctions on Iran and OPEC output cuts, WTI oil prices have fallen over 20% in the past year.
Europe
- The Eurozone manufacturing PMI for July fell to 46.5, down from 47.6 in June and is now at the lowest level since the Greek debt crisis back in 2012 as employment declined to a six-year low with a decline in exports. Spain came in at 48.2, 48.5 for Italy and 49.7 for France.
- Germany, long the economic anchor for the Eurozone and the world’s fourth-largest economy, has negative yields all the way out 30 years and about 40% of Europe’s investment-grade bonds have negative yields. The nation’s exports declined 8% year-over-year and imports fell 4.4% in June as global demand continues to weaken.
- France had its industrial production contract -2.3% in June versus expectations for -1.6%.
- Italy’s government is back in crisis mode as the two coalition ruling parties look to be calling it quits. Personally, I think Salvini (head of the League) has been waiting for an opportune time to dump his Five Star partners and their recent vote against European Infrastructure gave him that chance. The nation is likely heading back to the polls again at a time when Europe is facing a potential hard Brexit, so we’ve got that going for us.
- The UK economy just saw real GDP in Q2 contract 0.2% quarter-over-quarter. Domestic demand contracted -3%. Capex fell -0.5% and has now been in contraction for five of the past six quarters. Manufacturing output also contracted -2.3% in the worst quarter since the Great Financial Crisis.
Asia
- South Korean exports, a barometer for global trade, fell 11% year-over-year in July. The trade war between South Korea and Japan continues over Japan’s reparations for its brutal policy of “comfort women” during WWII.
- The trade war with China has entered the second year and this past week it looks unlikely that we will get anything sorted out with China before the 2020 election. The day after Fed’s rate decision Trump announced that the US would be imposing 10% tariffs on $300 billion of Chinese goods starting September 1st. In response, China devalued its currency and word is getting out that the nation is preparing itself for a prolonged economic war with the US. The rising tension in Hong Kong are only making the battle between the US and China potentially even more volatile and risky. Investors need to keep a sharp eye on what is happening there.
- Auto sales in China contracted 5.3% year-over-year in July for the 13th contraction in the past 14 months.
- Tensions are rising between India and Pakistan thanks to India’s PM Modi’s decision to revoke Kashmir’s autonomy.
US Dollar
When we look at how far the dollar has strengthened is have effectively contracted the global monetary base by more than 6% year-over-year. This type of contraction preceded the five most recent recessions. While the headlines have been all about moves in the equity and bond markets, hardly anyone has been paying attention to what has been happening with the dollar, which looks to be poised the breakout to new all-time highs.
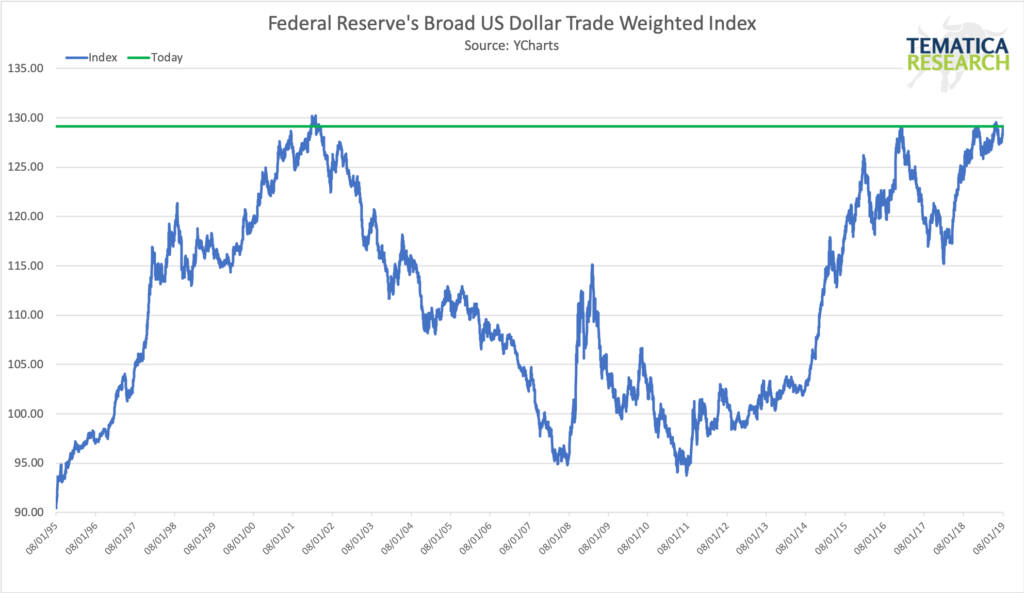
A strengthening dollar is a phenomenally deflationary force, something that would hit the European and Japanese banks hard. So far we are seeing the dollar strengthen significantly against Asian and emerging market currencies, against the New Zealand Kiwi and the Korean Won, against the Canadian dollar and the Pound Sterling (Brexit isn’t helping) and China has lowered its peg to the dollar in retaliation against new tariffs in the ongoing trade war. There is a mountain of US Dollar-denominated debt out there, which is basically a short position on the greenback and as the world’s reserve currency and the currency that utterly dominates global trade. As the USD strengthens it creates an enormous headwind to global growth.
The deflationary power of a strengthening US dollar strength in the midst of slowing global trade and trade wars just may overpower anything central banks try. This would turn the heads-I-win-tales-you-lose buy-the-dip strategy inside out and severely rattle the markets.
The bottom line is investors need to be watching the moves in the dollar closely, look for those companies with strong balance sheets and cash flows and consider increasing liquidity. The next few months (at least) are likely to be a bumpy ride.


