
Americans Racing to Stay in Place Thanks to Taxes & Healthcare
Recently the Bureau of Labor Statistics released the 2016 Consumer Expenditures report which showed that in 2016, the average household paid more in taxes than they spent on food and apparel – no wonder this “recovery” isn’t feeling all that recovered. While the average before-tax income rose just 17% over the 2013-2016 period, taxes rose 41%. If we look at just Federal Taxes the increase is 46%. That translates into 5.4% growth in before tax income per year versus 13.4% growth in Federal Taxes! Then those sages in D.C. wisely opine on the dangers of home prices rising faster than incomes – to quote Alanis Morissette, “Isn’t it ironic, don’t you think?”
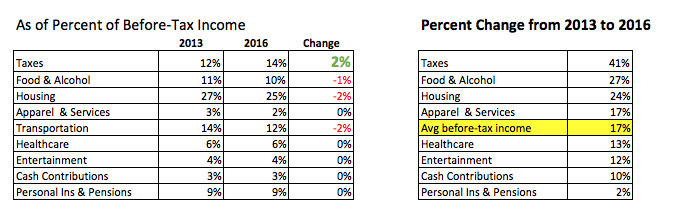
In fact, the biggest increase in expenditures for the average household from 2013 to 2016 was taxes – our Cash-Strapped Consumer, who is already facing stagnant wages and rising debt levels, is also feeling pain from the tax man and the doctor. While DC’s pocket book was growing faster than the American household’s, the national debt also managed to increase from 100.1% of GDP to 105.6% of GDP. Remember the days when a debt-to-GDP ratio of less than 55% was cause for heated debate on getting spending under control? But I digress…
The data we just looked at is averaged across all income levels, which can hide other trends – the joys of statistics. If we look at income levels by quintiles instead of mushed all together, we see something quite concerning, particularly if we break-out healthcare costs to show the costs for health insurance alone.
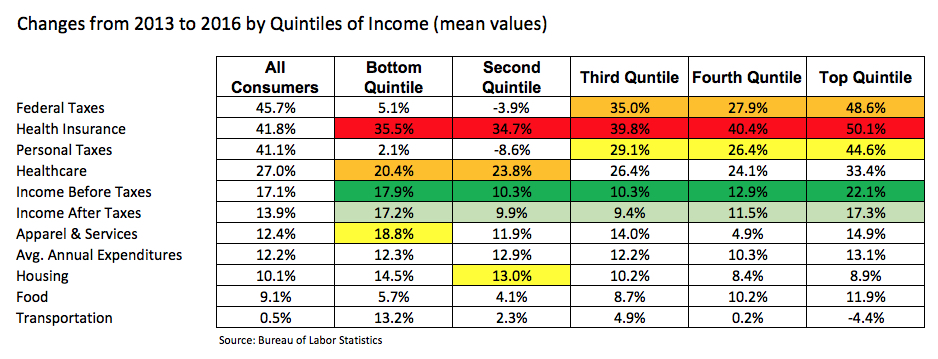
While expenditures on federal income taxes saw the largest increase for all consumers on average, if we look at increases by quintiles of income we see that for every income quintile, health insurance expenditures grew the most. Expenditures on health insurance rose between 34.7%, for the second quintile, to 50.1% for the top income quintile between 2013 and 2016. Note that this shift occurs because those in the bottom two quintiles, on average, receive money from the government, rather than paying taxes, which naturally reduces the overall average taxes paid.
As we look at our Aging of the Population investing theme, the dramatic increases in healthcare costs are concerning. This is a group that will experience significantly declining incomes as they head into retirement along with, for many, the increasing healthcare needs that are typically associated with more graying at the temples. If the price for those keeps rising, the already less-than-ideal nest egg that many of the Baby Boomers have to keep them in their golden years will be even more strained to make ends meet.
For the top three income quintiles (the top 60% of incomes), the second biggest increase in expenditures was federal taxes, with the top quintile experiencing a 48.6% increase in the federal taxes paid on average while incomes rose only 22.1% over the three years. For the top 60% of income earners, the third biggest expenditures increase was personal taxes, which includes states and local taxes.
The chart of incomes by quintile shows that expenditures for taxes and healthcare are growing materially faster than incomes. For an economy to survive let alone thrive, no one area of expenditure can continue to rise faster than incomes. We saw this during the last business cycle as home prices continued to rise much faster than incomes – at some point, households can no longer keep up with the expense, typically with profound consequences for the economy as a whole.
Many American families are feeling an awful lot like that hamster racing around on his wheel only to find he’s gained no ground.