

WEEKLY WRAP: Buying the Next Dip Might Not Be the Best Strategy
With the major portion of earnings season behind us, this week we are going to take a look at the vector and velocity of economic forces that will affect earnings in the coming quarters, but we first need to know where we are, before we can understand where we are likely to be heading. Much as they were for 1Q 2018, expectations for year over year earnings growth in the coming quarters is running rather high, but we are hearing more and more about rising costs and other inflationary pressures that could lead investor to revisit their profitability assumptions in the coming weeks and months.
In a typical business cycle, after a recession, the economy is saddled with excess capacity. Prices face serious downward pressure as supply is in excess of shrinking demand with households and corporations shifting away from consumption and expansion – most of the economy downshifts into survival mode. Capital expenditures are cut way back and monetary policy remains loose.
Midway through the cycle, the Fed shifts towards less accommodative monetary policy as the output gap closes with spare capacity shrinking and prices are no longer falling. Late in the cycle, there is typically no excess capacity with cost and price pressures rising. The Federal Reserve hikes rates, which either flattens or inverts the yield curve, creating debt service strains. Typically, the greatest pain is felt in those areas that benefitted most from the prior excesses in credit.
As we discussed on this week’s Cocktail Investing Podcast, at 107 months, we are now in the second longest economic expansion period in history, bested only by the dotcom boom-bust which lasted 120 months. For perspective, the average post-WWII expansion has lasted less than 60 months. This has also been the weakest growth period in U.S. history, averaging 2.1% GDP growth versus the prior eight expansion periods which averaged nearly twice that rate at 4.04%.
While this the second longest expansion in history, as the saying goes, no expansion ever died of old age. They die thanks to rate hikes and hello there, we are in a rate hike cycle with the most hawkish FOMC in years.
The real federal funds rate, (effective federal funds rate less core Personal Consumption Expenditure) has rarely ever been this low and we have never had the rate this low at this point in the economic cycle. This means that if the economy were to slide into a recession in the coming months, the Federal Reserve wouldn’t have nearly as much room for stimulus as is typical using its primary monetary policy tool, the funds rate. Remember that when considering why the Federal Reserve may be less-than-robust economic data, something we at Tematica have been talking about for some time.
The US federal government is also in a unique position, with annual budget deficits expected to be the largest ever outside of a recession or war. At the end of FY 2018, the gross US federal government debt is estimated to be $21.5 trillion, according to the Fiscal Year 2019 Federal Budget, putting debt as a percent of GDP close to 110% — a level also unprecedented outside of a war. About 50% of the US deficit last year was funded by foreign investors, but US foreign policy has been shifting toward a more “go it alone” strategy under the new administration. This raises concerns the US does not have lasting fidelity to international agreements it signs. This is a change to the playing field that could affect non-US interest in US government debt securities.
It isn’t just the government that is dealing with record levels of debt as we have a record high level of non-financial corporate debt as a percent of GDP of over 310%. The prior peak during the financial crisis reached a relatively paltry 271%.
We also have a record high 48% of investment grade corporate bonds rate BBB. That figure was at 30% just over ten years ago and at 25% in the 1990s. The net leverage ratio for those BBB borrowers is at a record 2.9x, well above the 1.7x level in 2000. In the coming years, we are going to see a significant amount of corporate credit coming due during a period of rising rates. By 2020, $1.92 trillion will have come due, with $2.92 trillion by 2021 and $4.0 trillion by 2022.
The Fed is raising rates as record levels of corporate credit will need to be rolled over during a period of rising budget deficits which means extra Treasury issuance in the context of increasing geopolitical tensions – talk about a quadruple whammy.
This week we also received the second quarter Federal Reserve’s Senior Loan Officer Survey which found Commercial and Industrial (C&I) lending standards at the easiest level since the first quarter of 2014 while at the same time, the net demand index has been falling from +2.9 (rising) to -7.0 (declining) for large firms and from +6.0 (rising) to -1.5 (declining) for smaller companies. Residential mortgage standards have been easing as well, the index falling from -3.0 (declining) to -3.6 (declining further) yet demand has declining from -15.0 to -17.6.
One area in which standards have been tightening has been in credit cards, which is no surprise given the increase in delinquencies and overall balances in recent quarters. Demand for the plastic has been falling from 0 to -9.6. Overall appetite for taking on new debt is declining in the private sector.
Despite easing lending standards, business loan demand has been weakening. Consumers aren’t looking to jack up their spending either via credit cards while rising rates and rising building costs are major headwinds to demand for mortgages.
We also have a record level of household net worth on an absolute basis, as a percent of personal disposable income and as a percent of GDP, this despite wage growth for the 82+% of the economy in the production and non-supervisory category that has been below average.
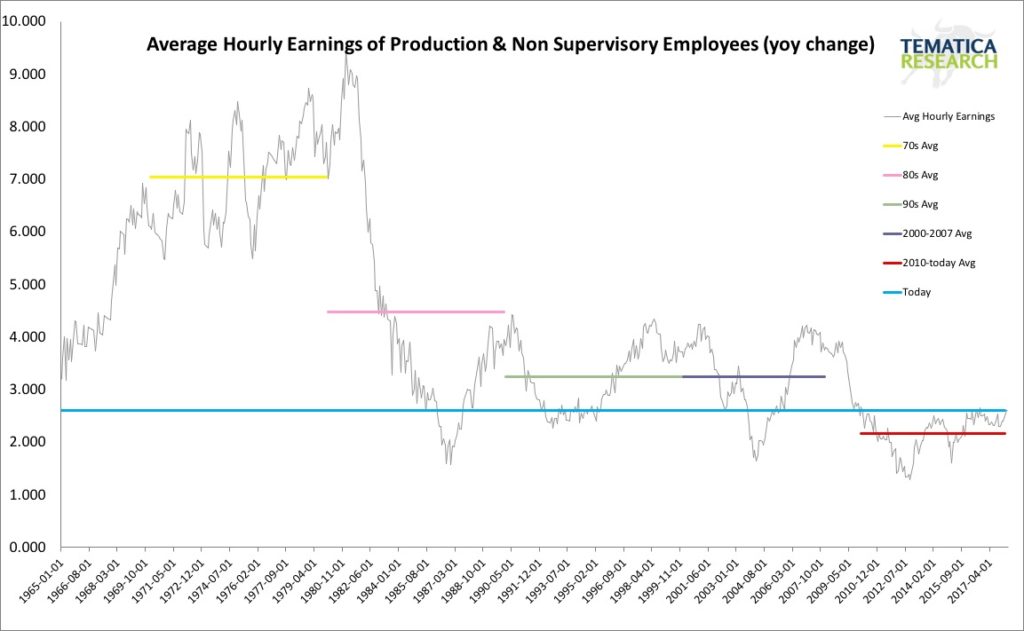
While wage growth remains low by historical standards, it is rising as the above chart shows and this month’s JOLTS report (Job Openings and Labor Turnover Survey) showed another record high in Job Openings at 6.55 million. The total available labor pool is around 10 million, yet we have that level of job openings while Hirings have been declining, down 86k in March after falling 63k in February – a sure indicator that companies are having a rough time finding the right person for the job. The decline in the level of Firings supports this, down 56k in March after falling 164k in February. More wage pressures are likely on the way.
The President’s decision to pull out of the Iranian nuclear accord means that the fifth largest oil producer in the world will see its sales sharply curtailed, putting upward pricing pressure on crude, which means upward pressures across the economy as energy is an input to pretty much everything. This comes at a time when businesses have already been facing higher input costs for everything from fuel to freight hauling and from raw materials such as steel and lumber to professional services.
Input prices have outstripped consumer prices since late 2016 and that trend looks to be accelerating. According to Wednesday’s data from the Labor Department, some pipeline costs are rising 2x to 3x the rate of consumer inflation. While the consumer price index is rising around 2.4%, intermediate prices for processed goods rose 4.7% in April (yoy) with transportation rising 6%, gasoline up 14.6% and steel mill products up 7.4%. Within transportation, costs for some refrigerated trucks hit 40-year highs last year, according to data from the US Agriculture Department. Tyson Foods (TSN), for example, estimated recently that rising freight costs will likely add an additional $250 million to its expenses. We suspect that investors are underestimating future margin pressures.
Companies are not only facing rising borrowing costs as the Fed hikes rates, but rising input costs ranging from wages to raw materials and services.
How Much Longer Can the Bulls Run?
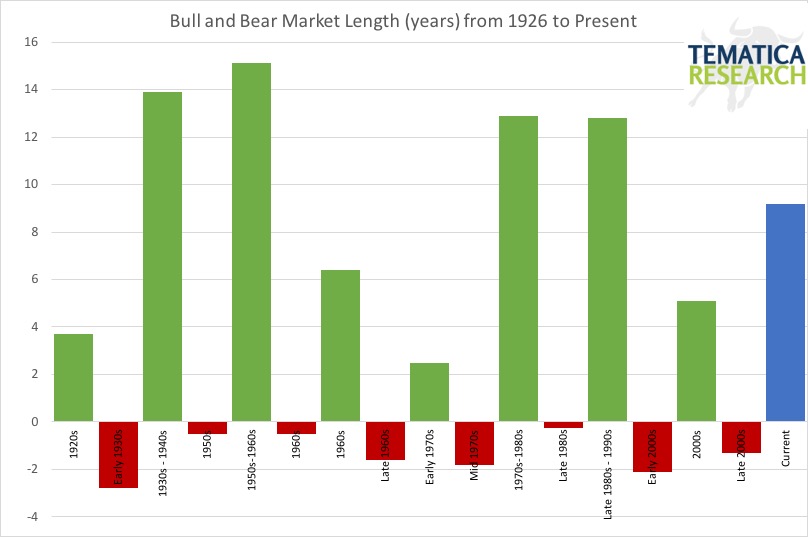
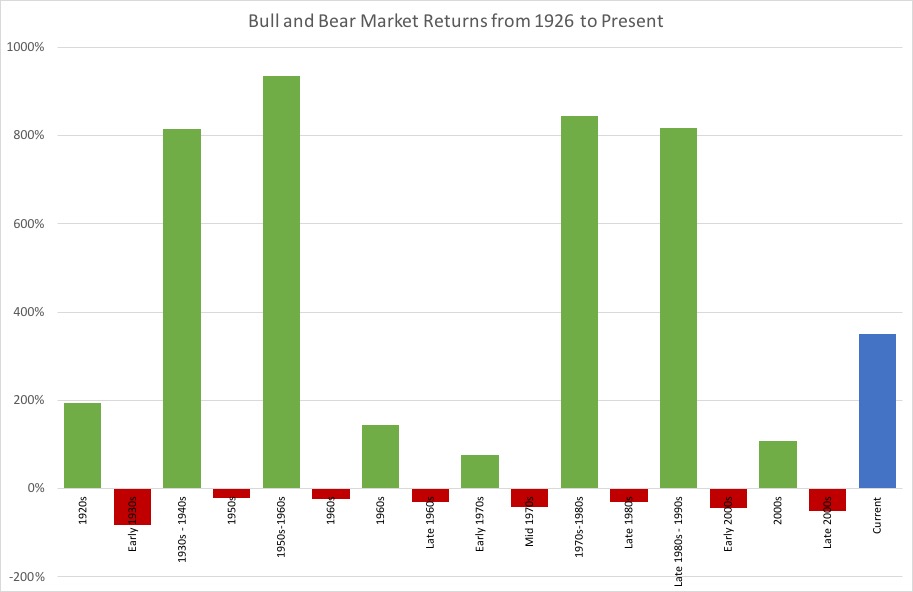
Looking at the market, we are now 9.2 years into the current bull market with the total return to date for the S&P 500 about 350%. The average bull market, going back to 1926, has lasted 9.0 years with an average cumulative return of 474%. The charts below, which present the length and total returns for each bull and bear market going back to 1926, which the years of bear markets inverted, shows that this current bull market is not exceptional either in terms of length nor total returns.
What is remarkable is what investors are willing to pay for earnings in light of an economy that has been anything but robust by historical standards in the context of rising cost pressures with minimal pricing power. The 10-year cyclically adjusted PE ratio is at levels outpaced only during the dot-com mania.
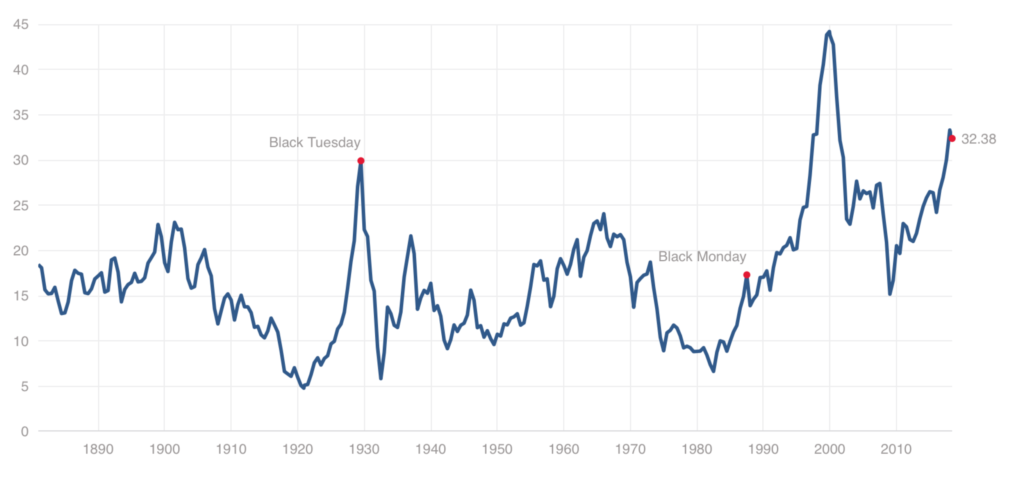
Shiller PE Ratio
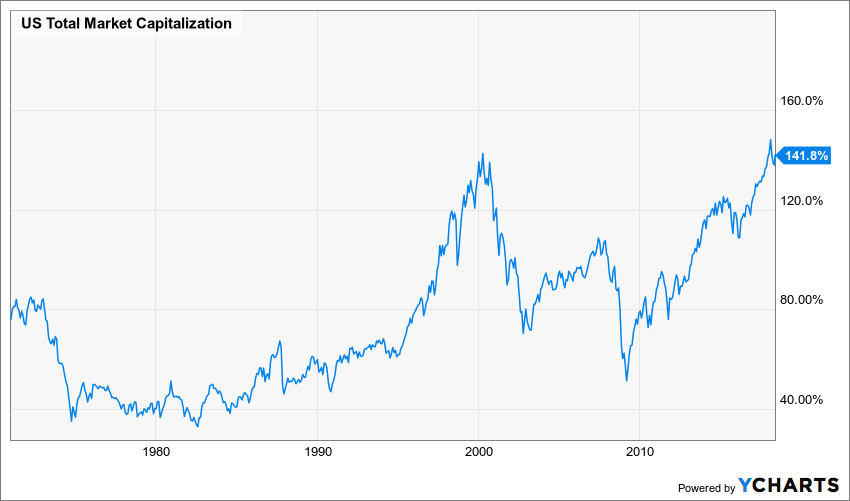
Total US market capitalization as a percent of has also reached a new high as a percent of GDP, even outpacing the heady days of the dotcom boom.
Putting it all together we have a historically pricey market at a time when costs are rising — from wages to borrowing to inputs and service — all while the supply of debt is increasing and a major buyer, the Fed, is no longer adding to its balance sheet, but rather reducing it. On top of that this has been a market in which “Buy the dip” has been strongly rewarded while value investing has been pummeled. Attempts at risk management have also been mostly brutally punished and we have about 3 million working in financial services who have never experienced a bear market.
The bottom line is market dynamics have fundamentally changed in a way that will likely catch many market participants off guard after having learned lessons in this bull market that may be past their time. We are in the later stages of the economic cycle and the bull market, which means this is a great time to put together your shopping list of those companies benefiting from major thematic tailwinds along with target entry prices so that you are ready to act when opportunities present themselves.