
WEEKLY WRAP: Fear and Volatility Have Left the Building
As we move into the final quarter of the year, equity markets are making new highs while the economy continues to chug along slowly. Warning signs for the markets are rising, yet so are signs of robustness in terms of breadth with a rising percent above their 50-day moving averages and indices relying less on those high fliers. At the same time, corporate debt and portfolio cash balances, as well as margin debt, give us ample cause for concern.
As equity indices continue to hit new all-time highs yet again this week, the Volatility Index (VIX) reached yet another new all-time low on Thursday, as shown in the chart below.
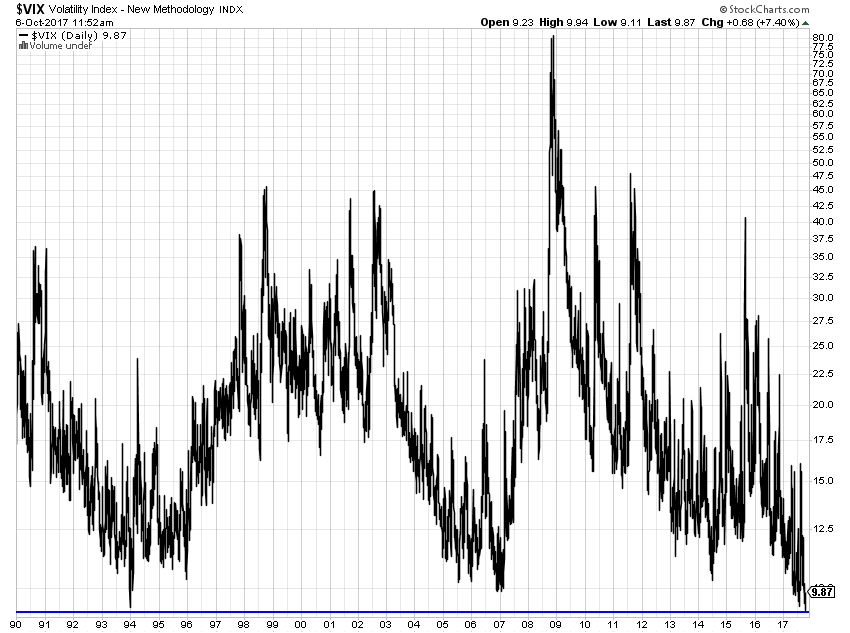
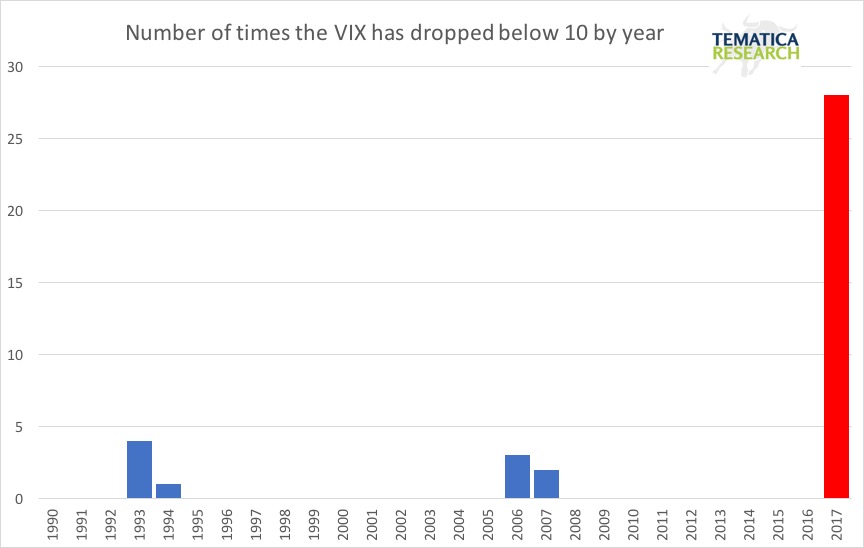
Fear has decidedly left the building, with 74% of the days the VIX has closed below 10.0 going all the way back to 1990 have occurred in 2017 alone. The year with the second greatest number of days the VIX closed below 10 was back in 1993, and that year saw a measly 4 occurrences versus the 28 we’ve witnessed so far in 2017. The record low levels in the VIX are related to the extremely low correlation between stocks in the S&P 500. If stocks don’t move together, then the index doesn’t move as much either – thus lower volatility.
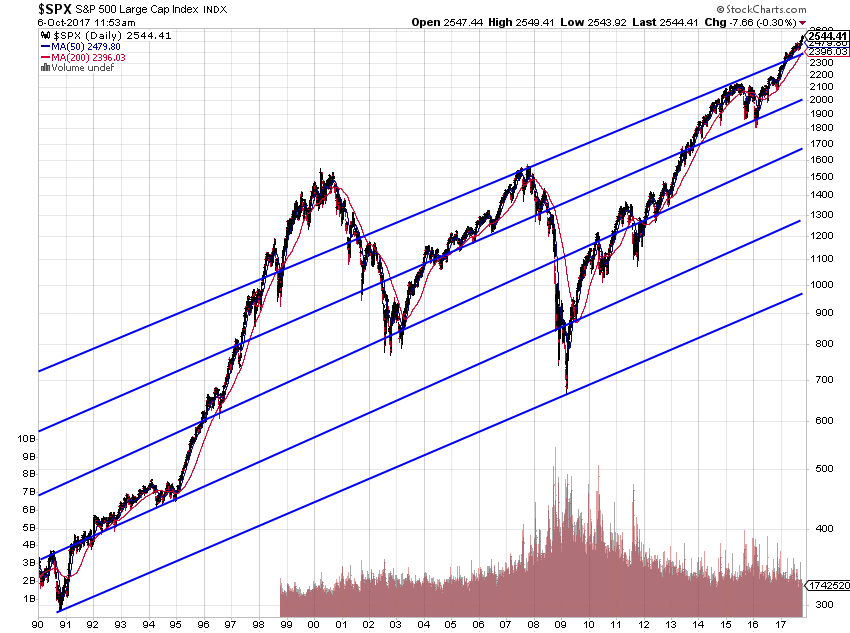
On the equity side, as of Thursday’s close, the S&P 500 posted its first 8-day winning streak since July 15th, 2013, hitting its sixth consecutive record high. This marks the longest record-setting streak since 1997, and we’d note the index has broken out above the highest band in its long-term up-channels as shown in the chart below. The last time we experienced such a break-out was during the dot-com frenzy and many of you likely remember how that ended. For reference, the S&P 500 lost over 55% from the peak reached in March of 2000 to the trough in March 2009.
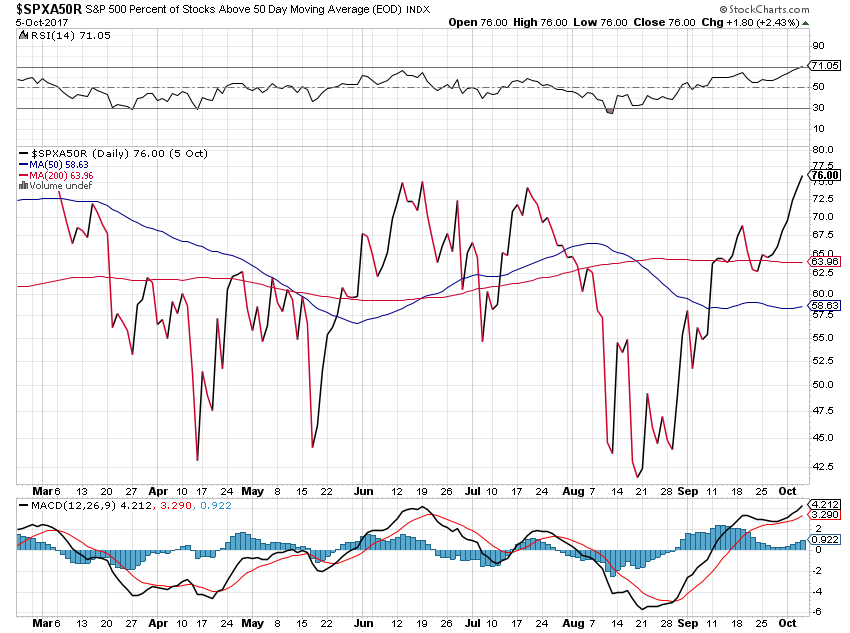
 While the market is shooting for the stars, market breadth for the S&P 500 has been expanding while the Russell 2000 breadth has been accelerating. The chart below shows the percent of stocks in the S&P 500 rising above their 50-day moving average has been improving significantly since late August.
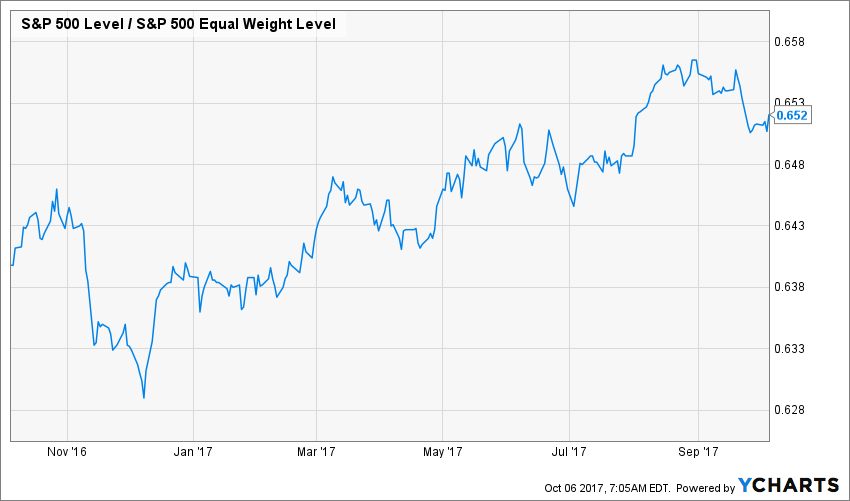
 Earlier this year equity indices were highly dependent on a small group of stocks, but since August, the FAANG trade – Facebook (FB), Apple (AAPL), Amazon (AMZN), Netflix (NFLX), Alphabet (GOOGL) – has been struggling while the overall indices have continued to move higher. The chart below shows the outperformance of the market cap weighted S&P 500 through late August, when the equal weight took over.
We continue to see a disconnect between the economic and political narrative and the markets, evidenced again on Thursday. As the House took an essential first step towards tax reform by adopting its version of the federal budget, the companies that pay the highest tax rates underperformed. We’ve seen this underperformance of those in the highest tax bracket for some time, which indicates that the market ebullience isn’t all about hopes for tax reform.
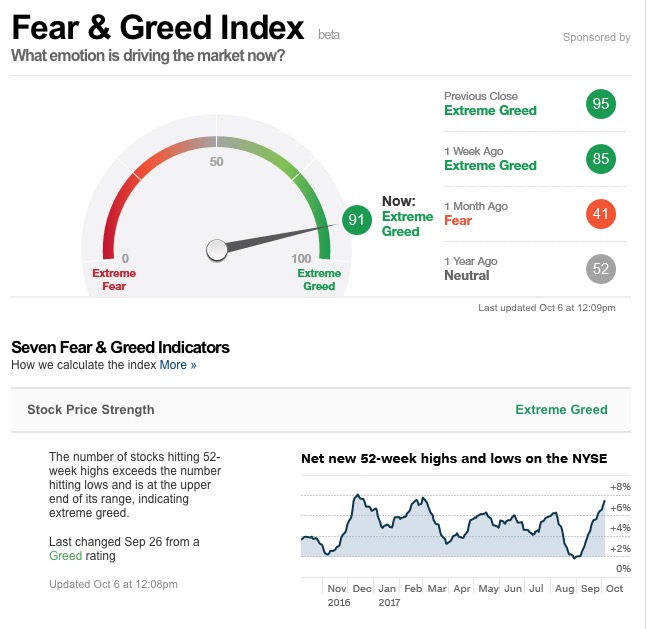
The CNN Money Fear and Greed Index is flashing some serious warning signs, with “Extreme Greed” levels, the likes of which we have not seen in years. Of the seven indicators that are used to calculate this indicator, six are in extreme greed territory. Investor sentiment is also flashing warning signs with the latest Investors Intelligence poll finding 3 times as many bulls as bears and Market Vane’s bullish sentiment has hit nearly 70%, which is right around a decade high. And we all remember what happened just about 10-years ago, right?
Overall the market has been priced at these levels just 10% of the time over the past 100 years. Expensive stocks can certainly get more expensive from here, but the underlying reality is downside risk continues to grow while upside potential shrinks.
Have we also mentioned that equity portfolio managers have cash balances at a record low ratio of assets and margin debt has been growing faster than market caps have expanded? Market leverage is rising with cash cushions are at record lows and that has us wondering who will be able to step in and do the buying to soften any pullback in the market? Recall the dotcom frenzy we mentioned above and the ensuing negative spiral as margin debt was called forcing investors to liquidate stocks in a falling market in an effort to raise funds.
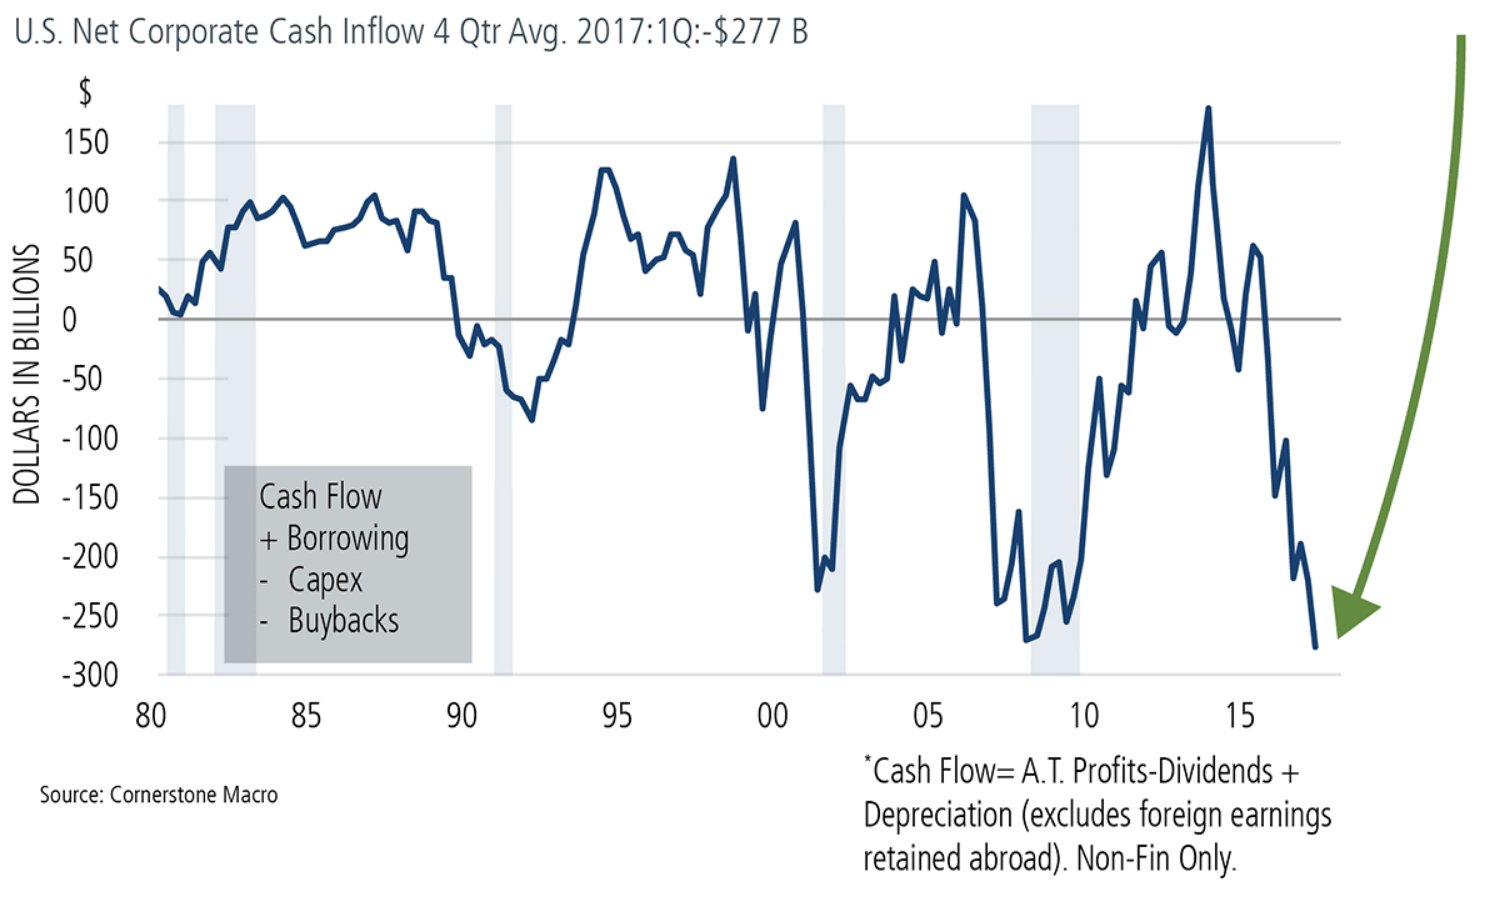
Portfolio managers aren’t the only ones with low cash levels, as U.S. companies are spending more cash than they are generating – yet another warning sign. From the first quarter of 2016 to the first quarter of 2017, U.S. corporation took in $1.9 trillion but spent $2.2 trillion on capex and buybacks, creating a net cash outflow of $300 billion – the largest on record.
Meanwhile, corporate debt as a percent of GDP is back up at its all-time highs.
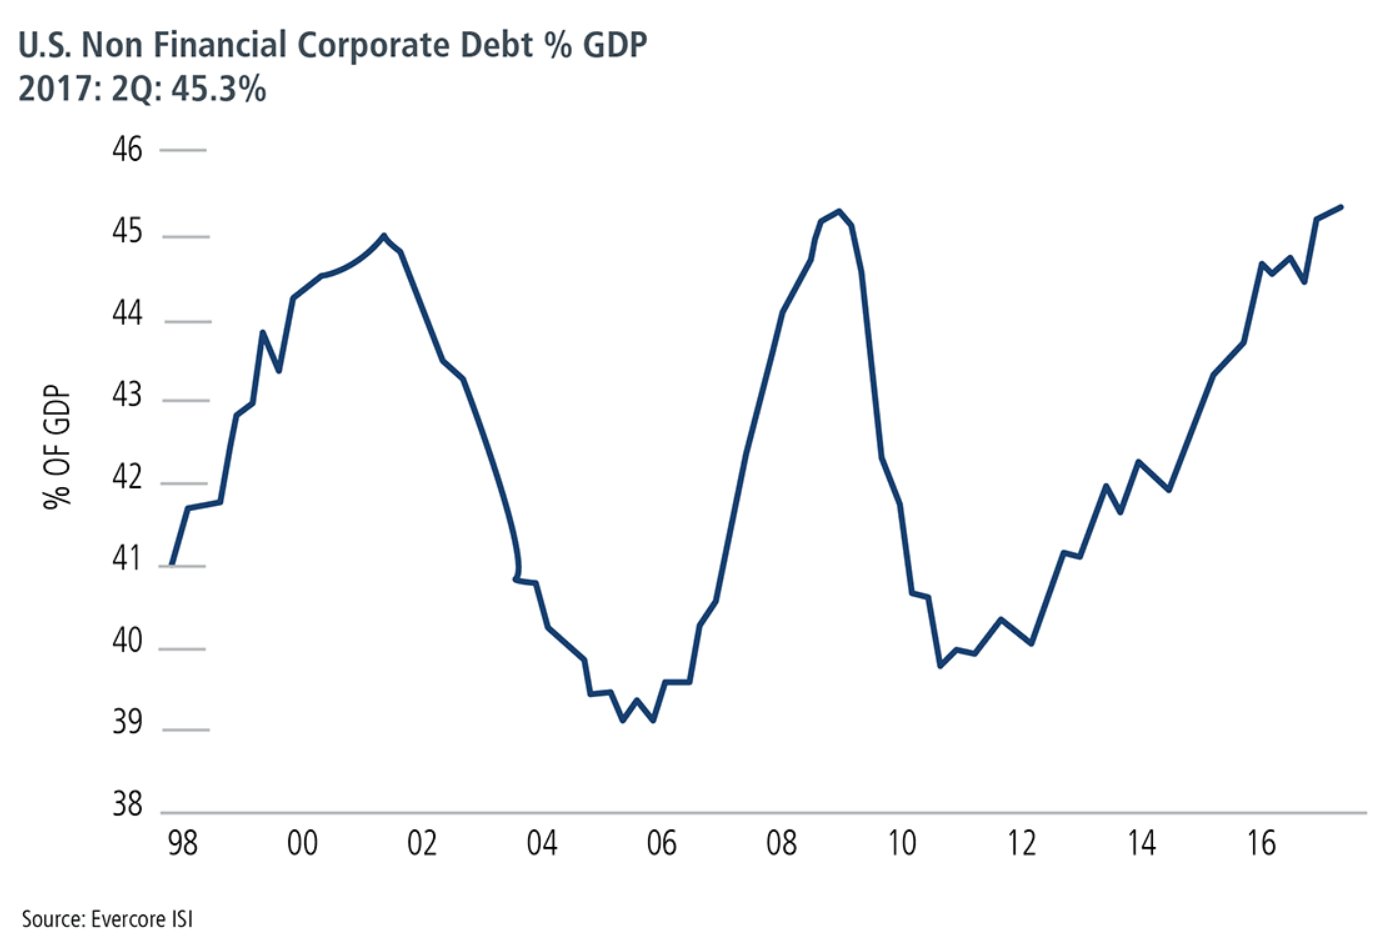
A good bit of that debt is maturing in the near-term and is likely to need to be rolled over. If interest rates rise, as the Fed is jawboning, that means a material margin squeeze in the coming year as interest expense rise. Corporate debt maturing in 2018 will be around $400 billion, with $600 billion in 2019 and likely about $800 billion by 2020.
No wonder the International Monetary Fund’s annual Global Financial Stability report warned that 22% of U.S. corporations are at risk of default if interest rates rise. As we at Tematica watch the Fed and what it may do when it comes to interest rates, we’ll be assessing the impact on EPS expectations for 2018-2020.
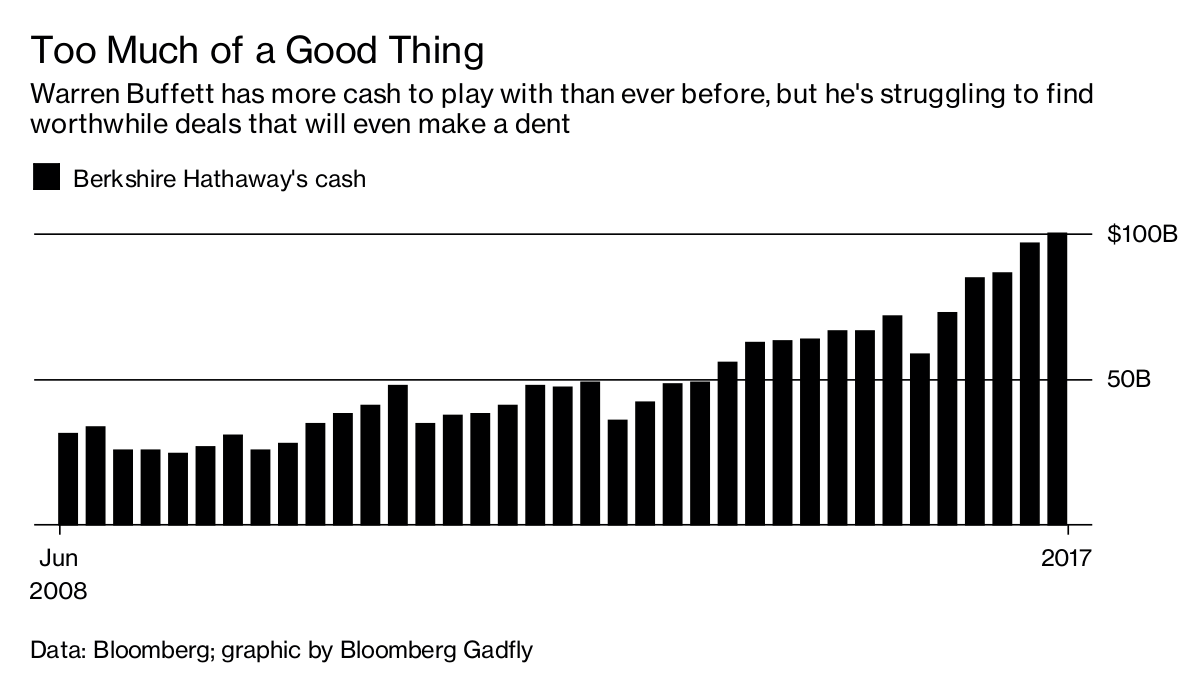
On the other end of the spectrum, a gentleman who has a track record of knowing when to buy companies shows his view of current market valuations as his firm, Berkshire Hathaway, sits on a record level of cash. Yes, you read that correctly – record cash levels.
On the economic side, we continue with the overall meh levels as we sit in the 100th month of this expansion – the third longest in history. If we make it to May 2018, it will be the second longest. This week we read conflicting reports from ISM and Markit on the Manufacturing and non-Manufacturing PMI data. While the jump in the ISM manufacturing index to a 13-year high looks fantastic on the surface, looking beneath the headlines we find why the two reports diverge. About 75% of the move in the ISM is due to a surge in delivery times, which typically would mean suppliers are inundated with orders – a good thing. In September that wasn’t the case though as the delays were a result of the disruption caused by the hurricane duo of Harvey and Irma. For the non-Manufacturing report, we saw a similar phenomenon, with 50% of the surge caused by such delays.
Taking a step back and looking at the big picture for the economy from some recent data points:
- Transportation statistics point to an okay, not great, but not weakening economy.
- Vehicle miles traveled has dropped a bit, recently, but are not indicating any major problems.
- Truck tonnage is growing at a slow, but decent pace and has been improving over the past few years.
- Air passenger miles growth statistics are solid.
- Air freight miles are strong – thank you Amazon (AMZN) and friends!
- Internal waterway tonnage is solid.
- Intermodal rail carload has been improving significantly, but overall rail carloads are not so rosy.
- Rail passenger miles are respectable.
- Manufacturing for durables and nondurables has been improving:
- New Orders for durables and nondurable goods have been improving since 2015 lows.
- Sales for both durables and nondurable goods have also been improving since 2015 lows.
- Inventory to Sales ratios for both durables and nondurables are off their 2016 peaks, but rising.
- Capex activity continues to rise as shipments for Capital Goods strengthens.
So like we said, the economy continues its “meh”performance level.
This morning we learned the impact of the hurricanes we faced in September as the economy shed 33,000 jobs – a sharp miss vs. the 90,000 job gain that was forecasted. Expect this to weigh on 3Q 2017 GDP forecasts, which have already moved lower, but odds are the Fed will see this as one of its “transitional” items, not a true reflection of the “not horrible” speed of the domestic economy. Shortly after the data was released, Dallas Fed President Robert Kaplan told CNBC that despite the weak September numbers, the labor markets are tightening and he is a voting member on the Federal Open Market Committee: translation – another rate hike in 2017 is still a go.
We continue to see equity prices stretch well above historical norms in an economy that is at best lukewarm. The last major market crash during the financial crisis was based on an excess of resources flowing into residential housing which caused all kinds of economic and market perversions. House flipping became a national pastime. This time around, all that quantitative easing doesn’t appear to have affected the real economy all that much as we don’t see any areas that have experienced exceptional price gains on a relative basis. Where we do see heady prices is in equity markets.
If history provides any lesson here, that means stock prices may be unusually vulnerable, much the way home prices were in the last business cycle. This cycle is long in the tooth, but we are all aware that no business cycle comes to an end simply due to old age. Since WWII that catalyst has mainly been the onset of a Federal Reserve tightening cycle and wouldn’t you know it, we’ve got just that in our windshield. Not only are we seeing tightening in the form of rate hikes, with a 73% chance of another in December, but we are also launching into Quantitative Tapering.
The bottom line is that upside potential continues to shrink while downside risks rise, making an emphasis on those areas benefiting from headwinds that can withstand, over the long-term, ebbs and flows of the economic cycle all that much more important.