
WEEKLY WRAP: At some point investors will have to pay the piper
The markets continued their record-setting trends of new highs and record low volatility this week. This comes despite continued signs that the economy has passed its peak for this cycle, even at a time when the geopolitical arena is anything but peaceful. Wednesday the Dow closed above 23,000 for the first time ever and as of Thursday’s close has made 51 new record highs in 2017. Global stocks hit new all-time highs Friday morning with Japan’s Nikkei 225 Stock Average up for the 14th consecutive day, matching the index’s longest winning streak on record.
While the market continues to melt higher, Thursday marked the thirty-year anniversary of Black Monday, the single worst one-day market crash in history when the Dow plunged 22.6% on volume that was nearly double the prior record. In the days leading up to Black Monday, the market had already lost 11%, which meant the Dow lost 34% in just ten trading days. In contrast, on October 10th, 2008, the single worst trading day during the financial crisis, the Dow fell just 7.9%.
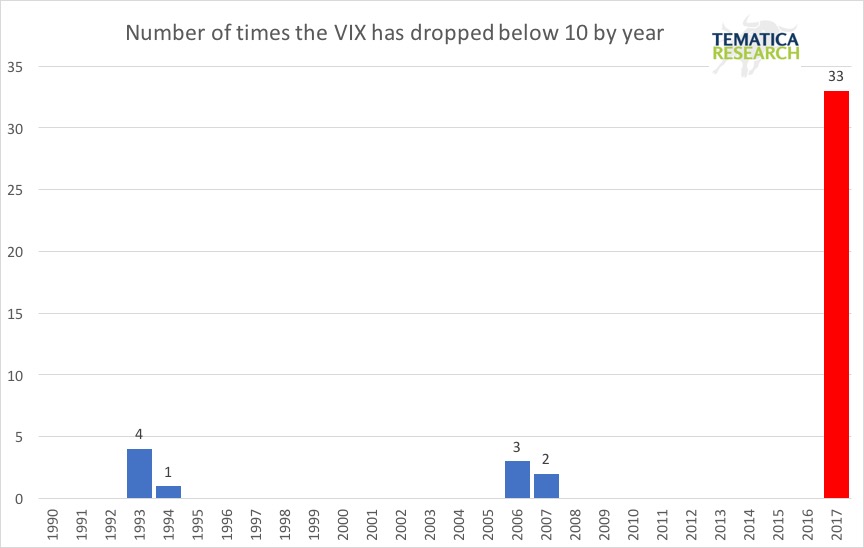
October has historically been the market’s most volatile month, yet October 2017 is on track to be the least volatile month in history. Yes, you read that right. Not only is this the least volatile October so far, but the least volatile month EVER! The Dow has not experienced a down-day of 1% or more in 43 sessions, with its average daily move this year in absolute terms less than half the norm. The chart below just gets more and more staggering with every passing week.
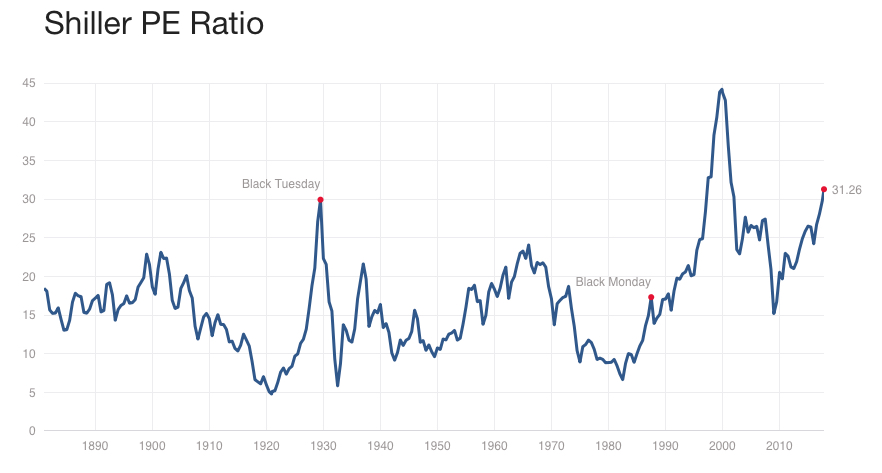
Valuations are also making records – while the S&P 500 is getting a nosebleed trading at more than 19.5x expected 2017 earnings, the Shiller Cyclically Adjusted PE ratio reaching 31.2, moving above the 1929 peak of 30. The only time this measure has been higher was when it reached 44.2 during the dotcom “this time it’s different” mania.
Thursday the S&P 500 opened down around 0.5%, but in the seemingly eternal melt up, managed to close at yet another new all-time high. As of that close, the S&P 500 has gone 349 trading days without a pullback of 3% or more. If the low volatility and melt up continues for just 22 more trading days, this will be the longest streak on record going back to 1928! The Dow’s 14-day relative strength index is at levels exceeded only 0.1% of the time in the past 100 years – talk about a high-altitude market– but we’ve been at such heady heights four other times since the November election. This year is one for the record books.
Thus far 3Q 2017 earnings have been good, but this morning reports from General Electric (GE), Proctor & Gamble (PG) and NCR Corp. (NCR) are poised to throw some cold water on things as we head into the earnings heavy next few weeks in a market that is arguably priced to perfection. As we’ve seen in the past, in times such as this, it doesn’t take much to jar investors and remove some of the steam that has been powering the market higher. The question being asked the last few weeks as the market has climbed higher has been, “What’s the catalyst that will take some wind out of the market’s sails?” More earnings reports like the ones we’ve gotten this morning are a likely candidate.
While equity markets are popping those champagne corks on a seemingly regular basis, Treasuries remain utterly unimpressed. The yield on the 10-year T-note is sitting right on its 200-day moving average with neither bulls nor bears making much impact in October. The Dow and S&P 500 continue to notch record high after record high, yet the highest yield the 10-year can rally to is a measly 2.3%. Imagine what a material drop in the markets could mean for yields!
We’d also like to point out that despite the cries from Inflationistas, the 10-year’s yield has been making lower highs throughout the year. The yield curve is also highly unsupportive of the inflation story, with the difference between the 10-year and 2-year rate hitting 75 basis points during the week. If we do get a hike in December, we’ll be just two hikes away from a flat curve and that is bound to get some chins wagging about the next and eventual downturn.
When we look at bond yields, let’s not forget that the nonfinancial debt-to-GDP ratio for the G20 countries peaked at 212% in 2007. Today it has reached a record high of 240%. Such a debt burden can’t help but have an impact on growth and yields. For example, a one percent increase in average interest rates is estimated to pull about 2.5% out of the domestic economy to cover debt service costs. And yet the Fed is looking like it is hell-bent on moving interest rates higher up to 4 times over the next 15 months even though it sees GDP in the range of 2.0%-2.2% in 2018-2019. That noise you hear is team Tematica scratching their collective heads.
The extraordinary conditions aren’t going unnoticed by investors. The Yale School of Management’s monthly investor sentiment survey of both individual and institution investors reveals there is rising concern in the markets – which is a relatively positive sign. According to the survey, confidence that the market would be higher a year from now peaked at just shy of 100% for institutional investors and over 90% for individual investors mid-year but has since dropped to below where it was prior to last year’s election. Both individual and institutional investors find today’s valuations the least attractive in the survey’s history going back to 2001. On the other hand, when the Barron’s Big Money poll finds that 87% of money managers expect tax reform within the next 12 months, we think there is still too much optimism.
That less optimistic investor sentiment is confirmed by the EPFR Global report that revealed investors pulled roughly a net of $36 billion out of U.S. stock mutual and exchange-traded funds in the third quarter. According to their report, in 2017 investors have on net pulled money out of such funds, despite the equity markets making new highs again and again. Where is the money coming from then to boost the major indices? In the second quarter, S&P Dow Jones Indices reported that companies in the S&P 500 bought back $120 billion worth of their own shares in the second quarter and look to have been on pace for something similar in the third, although the complete data has yet to be released. In 2016 foreign investors pulled $3.5 billion out of U.S. stocks but in 2017 through August, have put around $40 billion into U.S. equities.
Looking back on the Black Monday, unlike back then, this time we have a group of central bankers around the world vested in the stability of equity markets with a track record of providing a floor. Investors know this and have come to expect this. At some point, that faith will fail, but we are not seeing signs of that happening just yet.
On the economic front, we continue to see more evidence that we are post-peak in many sectors. Wednesday’s housing data was soft even if we take the impact of the recent hurricanes into account with housing starts down by 4.7% versus expectations for a decline of just 0.4%. Starts are now down in 6 of the past 7 months, having peaked in October 2016 and are today down over 15% from then. Multi-unit structures are down 35%. Permits were also down more than expected, declining 4.5%. The Architectural Billings Index, which tracks the trend in noncommercial construction activity fell to at 12-month low of 49.1 in September from 53.7 in August.
Industrial Production rebounded 0.3% in September after having fallen for two consecutive months, but the gains were mostly thanks to a 1.5% increase in utilities output thanks to the hurricanes. Industrial output looks to have peaked in June and has contracted at a 2.3% annual rate since then. Manufacturing activity appears to have peaked in April, declining 2.1% since then.
The markets may be steady eddy, but geopolitics are anything but with Brexit talks reportedly not making much progress, the Trump Administration’s hardline on NAFTA talks and North Korea apparently mere months away from having the ability to drop a nuclear bomb on mainland America. The continued uncertainty around Brexit impacts investment and growth plans for businesses in Europe and all this NAFTA talk affects capex plans back home. Keep in mind that the U.S. enjoys a trade surplus with its NAFTA partners when we look at combined goods and services and a recent report by ImpactECON found that the termination of NAFTA would likely cost Canada 125k jobs, the U.S. 256k jobs and Mexico 951k jobs.
The bottom line is that while we do not see signs that a recession is around the corner, the economic data rolling in continues to indicate that we are well past the 7th inning of this business cycle. At some point, the markets will have to pay the piper for their extended period of record high valuations and record low volatility, but we are not currently seeing the kind of euphoric sentiment that typically occurs in the run-up to a crash-worthy peak. In fact, the chorus calling for a crash in October was rather large, making a crash this month highly unlikely as the market is infamous for making fools out of as many people as possible.
This week’s news that the more dovish Jay Powell may be the next Federal Reserve Chair coupled with the Senate’s adoption of a $4 trillion fiscal 2018 budget resolution, (just barely passing at 51 to 49) has pushed the accelerator pedal for risk on. For those paying attention, now is the time to plan your exit strategy for when we do get the inevitable major pullback and put together your shopping list for when shares go on sale.