

WEEKLY WRAP: Will market insanity go beyond “What-the-heck” and deep into “You’ve-got-to-be-kidding-me”?
What a week, from passage of tax reform becoming more likely to Bitcoin going parabolic to the successful completion of the first phase of Brexit negotiations. And not to mention the heartbreaking images of the fires coming out of California — talk about a state that has been getting a serious beating in 2017.
The economic “soft” data continues to be more optimistic than the actual hard data, which paints a less robust economic picture that isn’t consistent with the story of an acceleration.
At the start of the week, early Monday morning, the markets were set to open up well in the green after the Senate managed to push its 479-page tax simplification bill. I just have to point out that only in D.C. is that a simplification, but then again this is the group that considers a reduction in the rate of growth a spending cut. By day’s end though, the market fell back into the red, despite the President’s assertion that tax reform would ignite the stock market.
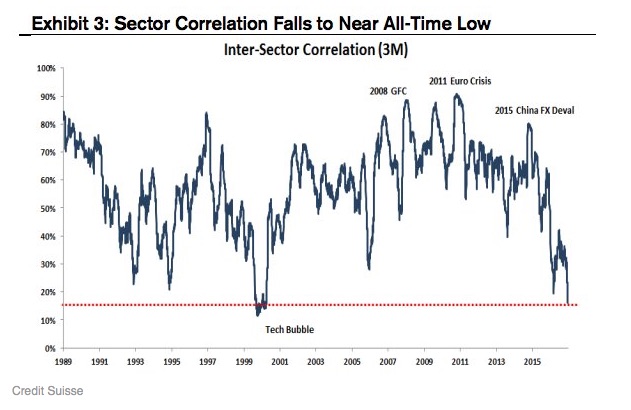
Tuesday the markets had the same reversal pattern, starting out strong only to fall into the close. By Thursday’s close, the major U.S. equity indices were in the red over the prior 5 trading days, with the small Cap Russell 2000 down over 1.5% as investors rotated into those sectors poised to benefit the most from the proposed tax reforms. We can see the magnitude of sector rotation as sector correlation falls to near all-time low.
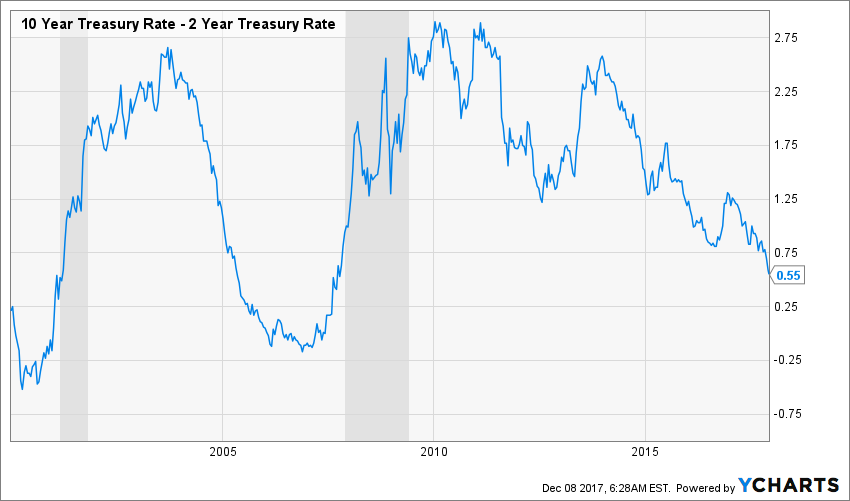
While equities have been mostly euphoric this year, the bond market isn’t expressing quite the same level of enthusiasm. The spread between the 10-year and the 2-year Treasury bonds continues to shrink as we see the yield curve flatten to a degree we haven’t seen since 2007 with the 2-year rising above 1.8% for the first time in a year this week as yields on longer-dated Treasuries decline. When I look at that yield curve, the unprecedented size of the Federal Reserve’s balance sheet, and the fact that U.S. Federal Debt is now over 100% of GDP, I get rather nervous when I realize that with the departures of Yellen, Fischer, Dudley and Tarullo from the Federal Reserve we are losing roughly 43 years of combined experience. Given my personal feelings about the tinkering the Fed has done with the economy in past decades, I’m not sure if this is a positive or a negative, but we’re about to have a team with little experience in charge of driving the massive tanker that is the Fed into unchartered territory and what is likely to be a much more volatile world in 2018.
But hey, TD Ameritrade’s Investor Movement Index, which is intended to track individual investor sentiment has reached a new all-time high, so there’s nothing to worry about, right?
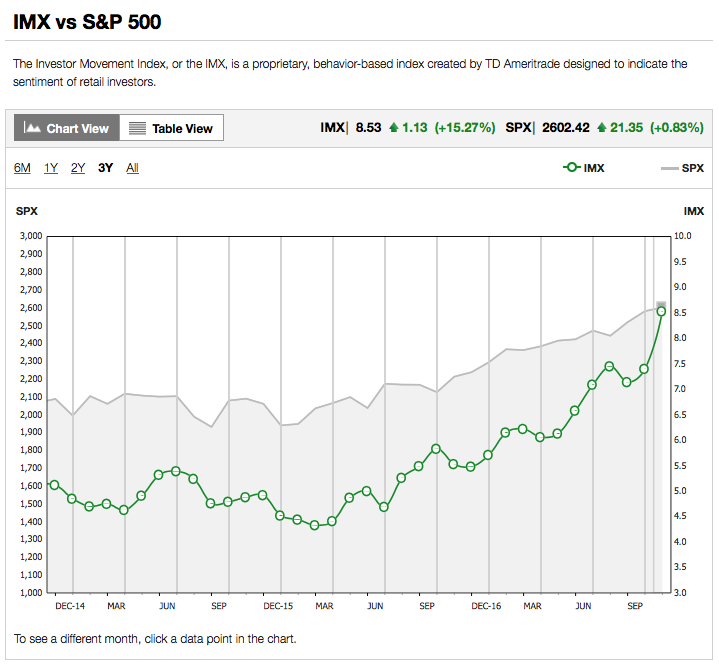
This certainly wouldn’t cause one to be on alert.
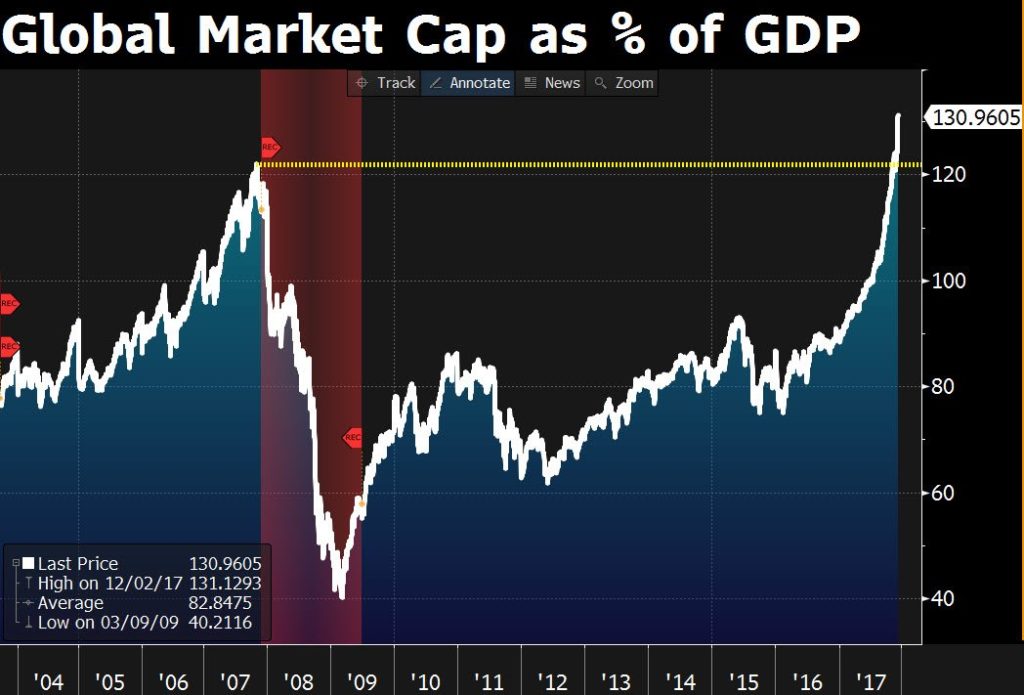
Nor ought this, hat tip to @JesseFelder.
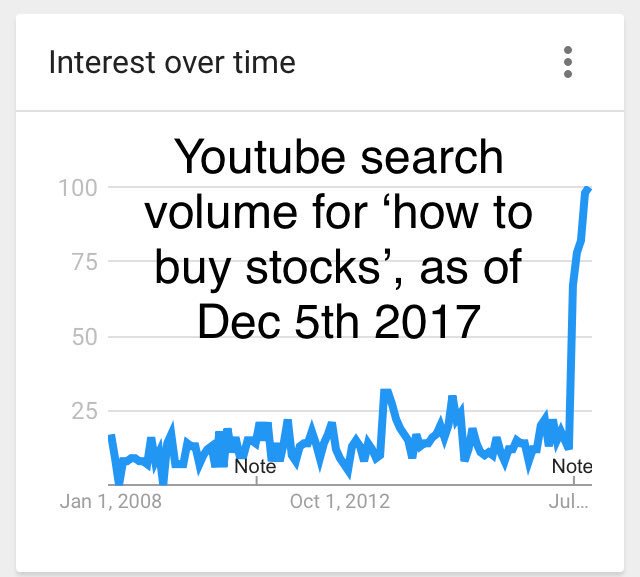
Meanwhile, as individual investor sentiment has exploded to the upside, a recent report by AAII found that “Cash allocations fell 1.2 percentage points to 13.9%. Cash allocations were last lower in December 1999 (12.0%).” Nope, no need for concern and no need to worry who will be left to buy stocks when the inevitable speed bump is hit? Yes, that was sarcasm.
Looking at the latest economic data, we see that while the popular refrain has been that the U.S. economy is experiencing material acceleration, the data simply doesn’t tell that story. What we have been seeing is improvements in net foreign trade and inventory levels. Those S&P 500 companies with over half of the revenue coming from international sales experienced a 13.4% increase in earning over the past year while those with less than half coming from outside the U.S. saw only a 2.3% increase in earnings. Inflation-adjusted final sales to domestic producers slowed to a 2% annual rate in the third quarter versus 2.7% in the second quarter. The average over the past four quarters is 2.3%.
Getting back the week’s economic data, the natural disasters related data blips that boosted September and October are receding as auto sales declined 3.5% sequentially in November to a 17.35 million annual unit rate versus expectations for 17.5 million. The ISM Manufacturing PMI dropped from October’s level to sit at 58.2 versus the 60.8 peak in September. Inventory investment component within the ISM has dropped to an 11-month low of 47 in November, down from 55.5 in August 52.5 in September and 48 in October.
Where’s that accelerating economy inducing businesses to build up their inventories?
Wednesday’s ISM Non-Manufacturing Index fell more than expected as the impacts of this Fal’s natural disasters wane, coming in at 57.4 versus expectations for 59.0. New Orders also declined month over month as did pricing pressure, though we doubt this will stay the Fed’s hand this month.
The IHS Markit service sector index also declined in November with its measure of Business Confidence sliding to a nine-month low – again, where’s that economic acceleration?
On a positive note, the number of first-time homebuyers has been rising steading quarter after quarter in 2017.
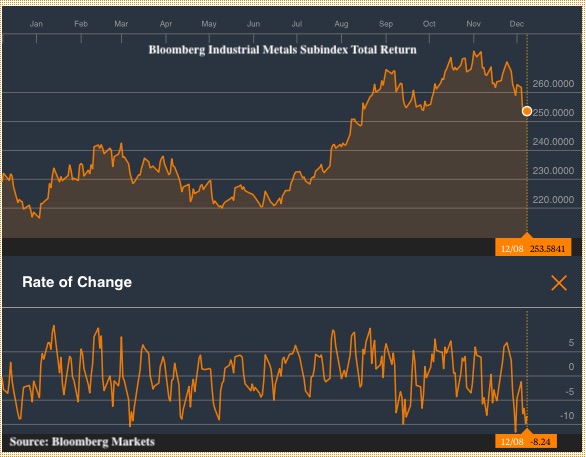
Moving beyond the U.S., the global acceleration we saw in 2017 appears to be weakening as Eurozone retail sales declined sharply in October, dropping to a 0.4% increase versus the prior 4.0% and expectations for 1.5% increase. We are also seeing the industrial metals rally that began towards the end of the second quarter looking to roll over.
Today’s jobs report revealed that income gains remain elusive as the 3-month moving average for hourly earnings for production and non-supervisory employees continues to decline. The workforce participation rate remained steady and is still well below the 2000 peak while the unemployment rate sits at the lowest level since 2000. In digesting the report in full, the stock market looks to be encouraged by the better than expected headline figure for today’s November Jobs report as well as average hourly earnings that rose 2.5% year over year, but — there had to be a “but” right? – we’ve seen far more spending due to rising borrowings over the last year and the 3-month moving average for hourly earnings for production and non-supervisory employees, which represents about 80% of employees, remains in a downtrend. With today’s jobs report poised to keep the Fed’s rate hike on the table, it likely means higher interest payments are coming in 2018 compared to 2017, taking a bite out of any enthusiasm we see in today’s November Jobs report.
I’ll close out this week’s wrap up with some food for thought on the level of sanity in the markets.
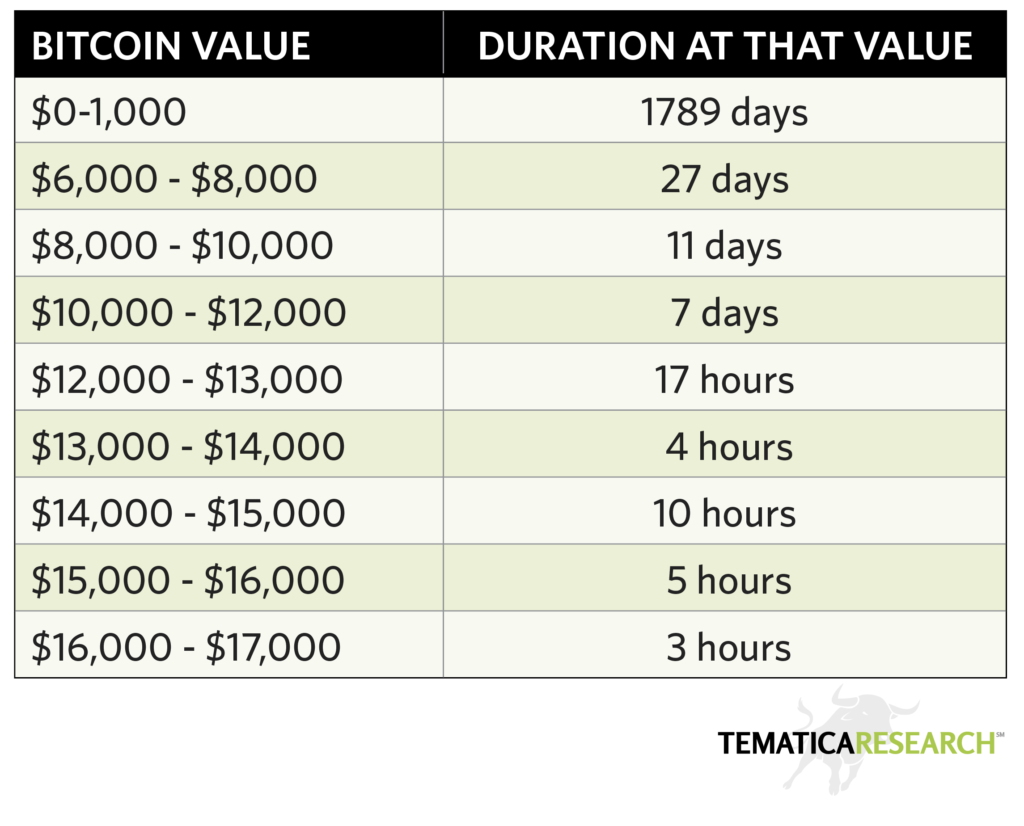
- This week, the cryptocurrency bitcoin went utterly parabolic., rising more than 40% this week alone. Is this an insane bubble, or as some claim, the pin to pop the fiat currency bubble? Only time will tell.
- In November, a painting of Christ by Leonardo da Vinci sold for a record $450 million at auction, a price that is 1.5 times more than the previous record holder of $300 million for Willem de Kooning’s painting “Interchange,” sold by the David Geffen Foundation to Kenneth Griffin. Asset price bubble anyone?
- The 7-year-old co-working startup WeWork this week became the biggest private office tenant in London, committing to paying about £815 million in rent, (around $1.1 billion). Holy cow!
- Veolia, a BBB-rated company, recently issued €500 3-year bond with a negative yield of -0.026%, the first time a BBB-rated issuer has ever issued bonds yielding less than zero. The offering was oversubscribed by over 4:1, because who doesn’t want to pay for the privilege of lending to a BBB!
These exceptional asset pricing events tend to be indicative of toppy markets. Can the major indices go higher? Of course, as market insanity can go well beyond what-the-heck and deep into you’ve-got-to-be-kidding-me for longer than anyone expects. That being said, these are signals that we are well into the later stages of this cycle so caution continues to be warranted.