

WEEKLY WRAP: The Market Stumbles for the First Time in a While
Last week the S&P 500 experienced its first down week in two months. This week we saw the market stumble for the first time in a while amidst weakening breadth and some poor earnings results. In particular, shares of General Electric (GE) plunged to a five-year low, hitting the major indices hard, with shares experiencing double digit declines after announcing below-consensus guidance for 2018 and cutting its dividend by 50%. Later in the week, Target (TGT) reported sales that beat expectations but margins declined and the company gave disappointing guidance for the holiday filled current quarter. We continue to see Target as a thematically lost company, and continue to favor Connected Society company Amazon (AMZN) and its delivery derivative United Parcel Service (UPS). Both of those companies are the Tematica Investing Select List.
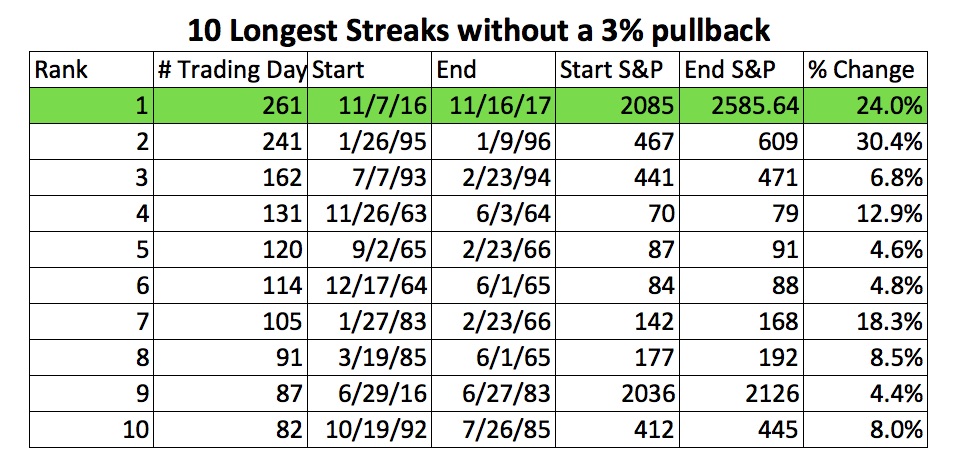
On Tuesday oil had its worst day since June and the U.S. dollar fell the most since September as yield curves flattened further after higher than expected Producer Price Index numbers for October. Thursday the S&P 500 ended its streak of 47 trading days in which the index closed at overbought levels as defined by closing 1+ standard deviations above its 50-day moving average. The markets experienced a brief buy-the-dip moment, with little follow through by Friday. It has now been 261 trading days since we’ve had a 3% or more pullback in the markets, the longest such streak in history.
Taking a step back, one can see that this pull back was inevitable. Over the past month, the major averages have high new highs while there were more stocks declining that advancing four times. The last time we saw that happen that many times was in 1999. On top of that, the past year has experienced the least volatile stock market in the past 53 years and trailing P/E ratios are at levels seen all of 8% of the time. Not quite the recipe we would like to have at Thanksgiving or any other time.
We believe that one of the major drivers of asset price appreciation since the financial crisis has been central bank liquidity, (the balance sheets for the central banks of the G4 stand at $15 trillion today) and those flows are changing. The annualized rate of growth in the G4 central bank balance sheets has downshifted from 20% at the recent peak to 10%. Looking forward, with the upcoming changes at the Federal Reserve and the new Chair of the European Central Bank likely to be less accommodative than the current Chair, Mario Draghi, we are likely to downshift all the way into a reduction of those balance sheets.
Despite a market that has experienced record levels of calm with declining breadth and richly priced stocks, bullishness abounds. The most recent fund manager survey from Bank of America Merrill Lynch found that the appetite for risk has reached a new high among money managers. While a record high 48% of respondents believe that equities are overvalued, (you don’t say) that FOMO (Fear of Missing Out) force is strong as 16% are taking above normal levels of risk. The latest Investors Intelligence poll found 64% bulls versus just 14% bears with cash balances well below historical norms.
One wonders if the majority of the pros surveyed have perhaps been doing a bit too much calming yoga lately with 56% describing the situation as “Goldilocks.” Seriously? Talk about complacency.
Let’s get real.
A recent study by Bankrate.com found that over the past 12 months 52% of American employees did not see their take-home increase either through a pay raise or a new, higher-paying job. For the older crowd, those 53 and older, 64% experienced no increase. At the same time, household debt has reached a new all-time high of $12.96 trillion in the third quarter of 2017 generated by a 0.6% increase in mortgages, 1% increase in student loans, 1.9% increase in auto loans, and a 3.1% increase in credit card debt. Yes, you read that right. Our Cash-Strapped Consumer investment theme was evident in the NY Federal Reserve’s quarterly assessment of consumer credit which revealed that this quarter saw the fastest year-over-year growth rate for credit card debt since the data has been tracked and mortgage debt grew at the fastest rate since the financial crisis.
Hold on a minute — credit card debt rose 3.1% in the past quarter, yet according to the Bureau of Labor Statistics latest jobs report average hourly earnings rose just 2.4% over the past year!
Real disposable personal income is rising at a 1.2% year-over-year pace and has been declining in three of the past four months. Remind me again why so many are obsessed with seeing retail sales grow and ignoring just how folks are paying for those new bobbles? Never mind that decade-low 3% personal savings rate.
Not to utterly beat this horse, but while I am at it, can someone explain how it makes sense that with the unemployment rate at multi-decade lows it also makes sense to be running substantial deficits?
Wasn’t deficit spending supposed to be what happens during the tough times?
If we have significant deficits now, what happens when we do get the inevitable recession?
Since I’m on a roll, let’s also note that total debt which includes households, businesses and government has gone from 225% of GDP at the 2007 peak to 250% of GDP today. Think about that as you read about the next Fed rate hike.
This week the October Retail Sales numbers were released and they were roughly in line with expectations, but we’ll point out that the data is pretty noisy thanks to the brutal string of natural disasters hitting the U.S. this Fall. We did note however that non-store sales, (essentially e-commerce) declined in October for the third months in that past five. We’ve only seen three declining months in the past two years. Total non-store sales are also growing slower this year than last. This sector has also seen its total share of sales decline from a record 11.0% in July to 10.72% in October. The last time the sector was down so much from a peak reading was in March 2004, so this is not a typical pullback. We are paying attention with one eye on the consumer and the other on holiday shopping forecasts.
The economic news this week pointed to higher than expected inflation with the Producer Price Index rising 0.4% in October versus expectations for a 0.1% increase. Later in the week, the Consumer Price Index saw the year-over-year trend softening to 2% after September’s 2.2%. We are seeing some signs of inflation in core CPI, which after having come in at or below 0.1% for five consecutive months, reached 0.2% in October and is running 1.77% year-over-year but at a 1.80% annualized rate over the past six months and a 2.43% annualized rate over the past three months – that’s acceleration and the Fed knows it. This tells me the December hike is looking more likely and adds credence to the market pricing it at 93% odds.
Back to that employment picture, in this week’s NFIB Small Business Economic Trends report we found that 52% of firms reported few or no qualified applicants for job openings in October – a high for this business cycle that speaks volumes for our Tooling & Retooling investing theme. We saw a cycle high with 20% of firms reporting that quality of labor was their biggest concern. Both of these levels were last seen in 1999 – another indicator that we are late in the cycle.
Internationally the data was a mixed bag. On Tuesday, we learned that China’s retail sales, industrial output and fixed asset investment growth all came in below expectations, which lead to Asian equity markets closing the day mostly lower with European stocks following suit. The U.S. opened the day weaker on this news as well. China has the third largest economy in the world as measured by GDP, after the United States and the Eurozone, so when it slows, it matters.
Things in Europe are looking a tad peachier as the situation in Spain with Catalonia is calming and those struggling Italian banks are making decent progress getting all those NPLs (Non-Performing Loans) off their books by selling them at below face value to those willing to take on the risks. German GDP rose 0.8% for 3Q (quarterly rate) versus expectations for 0.6%, reaching 2.8% year-over-year growth. That is a full 0.5% faster than the U.S.’s year-over-year pace. Italy’s year-over-year pace hit 1.8%, a pace not experienced in 6 years.
Back in the U.S., the big question will be how the differences between the House tax bill, upon which it just voted and passed, and the Senate Finance Committee’s version, which was just approved, will be reconciled. This will be no minor matter given the gaps on the Affordable Care mandate, State and Local tax deductions and the corporate tax cuts will be effective. Then there is that pesky partisan bickering that we all enjoy so much that will certainly add to the fireworks.
Putting it all together, we are seeing some promising signs of growth both in the U.S. economy and internationally, but that has yet to translate into meaningful household income gains. Debt continues to grow across the board from households to corporations to government in a rising rate environment – that’s a headwind to inflation and growth. U.S. companies continue to face headwinds to growth from lack of available skilled labor. Underlying market fundamentals have been weakening, yet investor sentiment remains strongly bullish amidst record high margin debt and low cash reserves.
Things are starting to get interesting.