

Weekly Wrap: Markets Get Blindsided
Coming into this week, market participants thought the big risk was going to be Federal Reserve Chairman Jerome Powell’s first Monetary Policy Report — or Humphrey Hawkins testimony as it used to be called — in front of Congress. Turns out, that wasn’t all that was to come from Capitol Hill.
Equity Markets — A Roller Coaster of a Week
Monday the markets opened with an enthusiastic risk-on mood. The Nasdaq Composite, Russell 1000 and S&P 500 all closed up more than 1.0%. The Russell 2000, (small cap stocks) continued to lag, gaining just 0.7%.
Then the punchbowl was pulled on Tuesday when new Fed Chair Jerome Powell gave his first testimony in front of Congress. The markets were not pleased. All the major equity indices lost more than 1% on the day.
As the markets digest Powell’s testimony Wednesday morning — something Chris Versace, Tematica’s Chief Investment Officer, and I focused on in this week’s Cocktail Investing Podcast — equities tried to muster some enthusiasm, but couldn’t pull it off. By the close of Wednesday’s trading, the Nasdaq lost -0.8%, Russell 1000 and S&P 500 lost -1.1% and the Russell 2000 fell -1.6%, as small-cap stocks continue to underperform – never a bullish indicator.
Not to be outdone by Powell, the big risk for markets this week arrived on Thursday when President Trump announced that the U.S. will implement import tariffs of 25% on steel and 10% on aluminum.
Did we mention that the seventh round of NAFTA negotiations have been going on this week in Mexico? Timing…
How did U.S. equities respond?
In response to the President’s comments, the Dow Jones Industrial Average, having gained more than 150 points earlier in the day, dropped 577 points closing down 1.7% from the prior day. The S&P 500 dropped briefly below its 100-day moving average, losing 1.3% on the day, the VIX rose over 13% and the S&P 1500 Steel Industry Group gained 3%. In general, Industrial companies fell on the news of tariffs, but those that would benefit, such as United States Steel Corp (X) and Nucor Corp (NUE) gained 5.7% and 3.5% respectively.
We saw something similar with Whirlpool (WHR) shares a few weeks back when the administration slapped tariffs on foreign washing machines. Those whose input costs would increase under these tariffs saw shares take a hit, with Ford Motor Co (F) and General Motors (GM) losing 3% and 4% respectively. Friday morning all the major U.S. indices opened well into the red.
Powell’s Pain
Whenever I feel like life is unfairly kicking the puddin’ out of me, I’m going to remind myself that on Powell’s first day as Fed Chair the Dow Jones Industrial Average was hit with its biggest one-day point drop ever and the VIX had its largest one-day percentage gain in history. After his testimony on Tuesday, the markets again took a dive, which continued into Wednesday. Thursday morning Secretary
Thursday morning Secretary Powell spoke before the Senate Finance Committee and after his prepared remarks, he noted that “We don’t see any strong evidence yet of a decisive move up in wages. We see wages, by a couple of measures, trending up a little bit, but most of them continuing to grow at about two and a half percent. Nothing in that suggests to me that wage inflation is at a point of acceleration.”
In contrast to Powell’s testimony earlier in the week, these comments were a hell of a lot less hawkish. In response, the Dow, S&P 500 and Nasdaq all shot up to session highs.
Then Trump spoke.
I feel like sending Jerome some muffins or a fruit basket.
Of course, not to be outdone by Trump, Putin had to throw his hat into the ring this week by announcing in his annual state of the nation address that the Russian military has developed nuclear-capable weapons that can render defense systems useless.
To recap, we now have on the table a potential trade war brewing, (according to Australia, the European Union, Mexico, China and Brazil), and now talk of a restart to the Cold War?
At least the weather has been mild. Yes, that was sarcasm.
Leverage and the Game of Chicken the Market is Playing
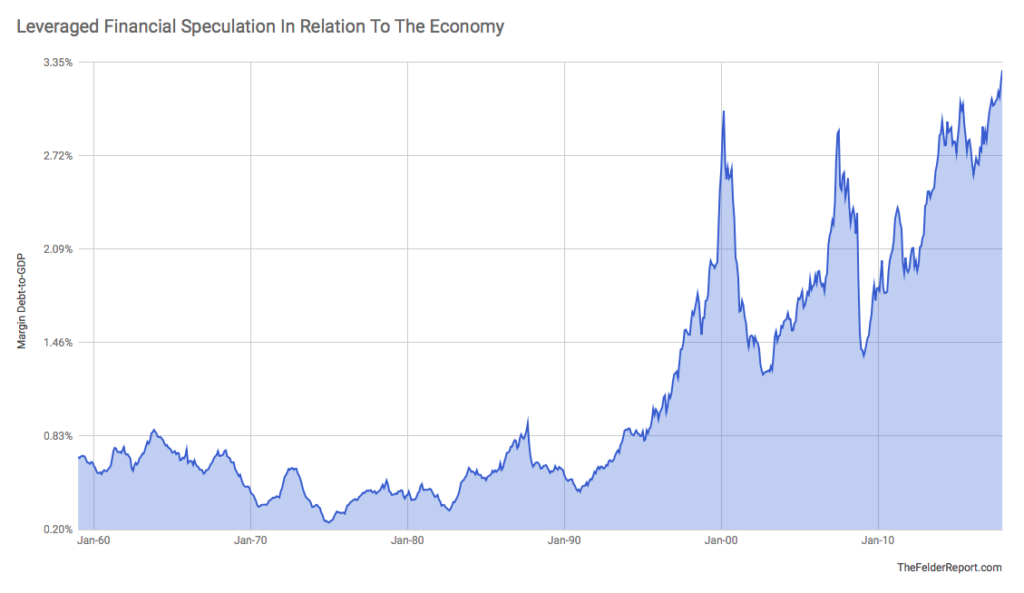
With all those sparks flying, one has to wonder about the market kindling in the form of margin debt, which has again reached record highs. Now some have pointed out that as a portion of market cap, margin debt doesn’t look all that impressive. I think that is some seriously flawed math as it utterly negates the importance of breadth and the effect of leverage.
If some portion of investors borrow more every day to buy shares, then obviously, share prices will continue to rise. This becomes a game of chicken that lasts right up until enough folks stop playing the leverage game and are no longer there to keep pushing prices up. Then all hell can break loose as the run-up was based on a dwindling volume of investors simply increasing leverage.
Instead, we like to use margin debt as a percent of GDP, which ties it to the real economy. Margin debt relative to GDP has exceeded the levels reached in 2007 and even the sky-high valuations of 2000, giving us the most highly leverage market relative to GDP in history. (Hat tip to Jessie Felder of the Felder Report for this chart.)
Total Market Capitalization as a percent of GDP reached a new all-time high of 152.4% before the February correction outpacing even the 146% from the dotcom bubble. This is even more concerning when you consider that the number of publicly listed companies has fallen from the peak of 8,090 in 1996 to 4,331 as of 2016 (latest date for which data is available from the World Federation of Exchanges).
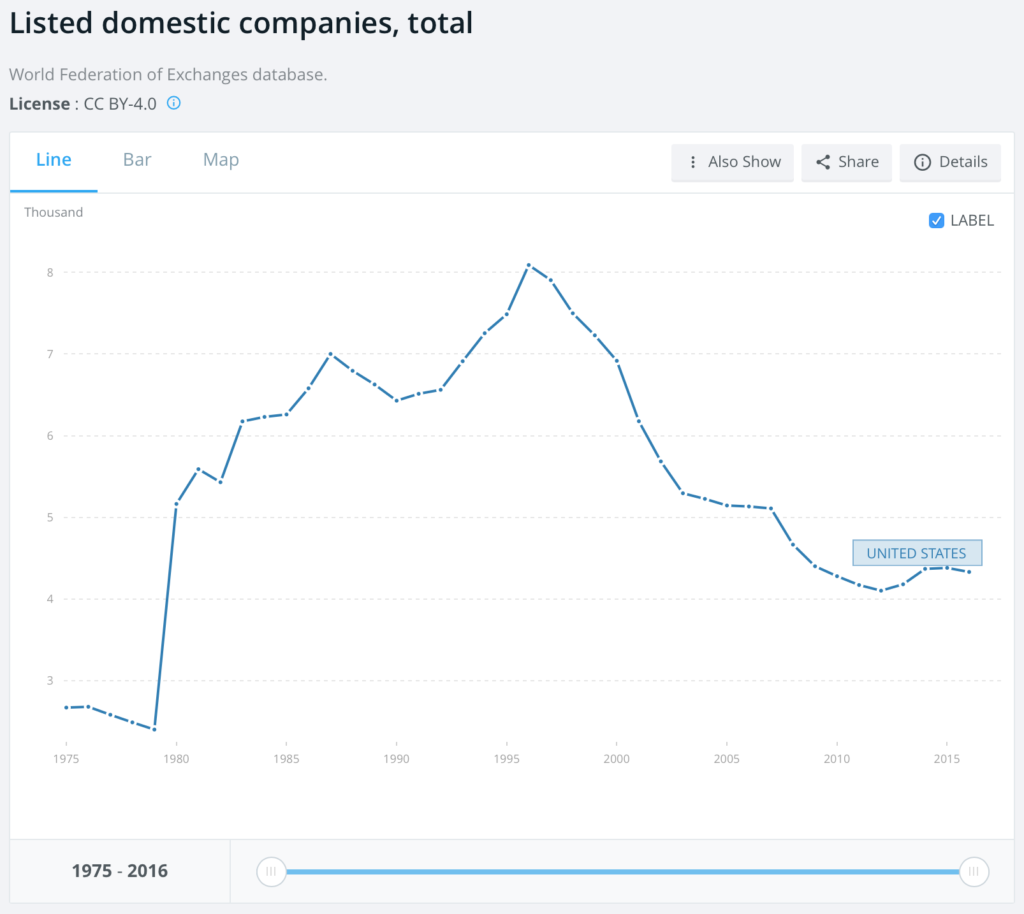
As the data above shows, the number of publicly traded companies has declined by almost 50% while market cap as a percent of GDP has gone from less than 90% at the end of 1996 to over 150%!
That couldn’t possibly have anything to do with the suppressed interest rate policies that allow the very big to borrow at ultra-low or even negative interest rates – oy vey!
While market cap relative to GDP is not a useful timing metric, it does give a good idea of what overall market returns are likely when it reaches extreme levels. In the 15+ years between the March 2000 market cap to GDP peak to the next peak in June 2015, the S&P 500 gained all of around 40% and the Nasdaq Composite just over 4% – ouch. While that 40% move may sound like a big number, keep in mind it’s over 15 years, which means very modest returns on an annualized basis.
Bonds are Not Sitting on the Bench Anymore
While much of the focus this week in the news has been on equities, Tuesday a $60 billion auction of four-week Treasury bills were priced to yield 1.495%, the highest rate since September 2008. Another $22 billion auction of 52-week priced at 2.02%, which is the highest rate since the reintroduction of the 52-week in June 2008. Recall how we’ve shared our concern that increases in consumer spending have been driven primarily by rising household debt levels? That’s getting more expensive.
Sentiment around bonds has been so negative that the Commodity Futures Trading Commission’s weekly Commitment of Trader’s Report for February 20 revealed that Treasury futures short contracts on the 10-year reached over 4x the average and a record high going back to 1992. Thursday the 10-year Treasury yield dropped 6 basis points to 2.8%, the biggest one-day decline since September 5th. We may be seeing a giant short squeeze here.
The Good and the Bad in the Economic Data
Aside from all the fireworks this week, the economic data continues to deliver mixed results.
The Good:
- Dallas Fed manufacturing beat expectations for 30.0 at 37.2 in February. As a side note, the Inflation Index came in much stronger, rising from 33.5 in January to 39.8 in February. Haven’t seen it this high since May 2011.
- February’s ISM Manufacturing report beat expectations by rising to 60.8 from last month’s 59.1 versus expectations for a decline to 58.7. In fact, February’s reading was the strongest since May 2004. While the headline is a beat, in reality, this report is a bit of a mixed bag because as we dig into the details, two of the only three categories (out of eleven) that declined month-over-month were Production and New Orders. Those tend to be leading indicators, so we prefer to see them improving and we also don’t like seeing that the Priced Paid component rise to its highest level since May 2011. The market is already skittish when it comes to any hints of inflation and this isn’t going to help.
- On the other hand, Core PCE Inflation came in as expected at 1.5%.
- Eurozone Producer Prices rose less in January, up +1.5% versus expectations for +1.6%. The measure has mostly been declining since September when it reached 2.9%, then 2.5% in October, 2.8% in November, then down to 2.2% in December. This measure is not showing signs of rising inflationary pressures.
The Bad
- The Citibank Economic Surprise Index (CESI), which measures expectations versus the actual data coming in, fell into negative territory for the first time in 18 months as expectations continue to be overly optimistic.
- The Chicago Fed National Activity Index (CFNAI) surprised to the downside in January at +0.12, the worst level in five months, versus expectations for +0.25. On top of that December was revised down as well, from +0.27 to +0.14. On top of that, the diffusion index for CFNAI is indicating decaying breadth.
- Japan’s factory output fell by the most in around 7 years in January with Industrial Production falling 6.6% versus expectations for a 4% contraction.
- New home sales were weaker than expected… again… declining -7.8% month-over-month versus expectations for an increase of +3.5%. The annualized pace has dropped to a 5-month low and is 1% below January 2017. The weakness was more concentrated in the south, so we’ll be watching next month to see to what degree this was weather-related. While some tried to blame it on the weather, we’ve now seen new homes sales miss expectations in four of the last six months – sounds like something more than just the weather.
- Aside from the new tariff headwind hitting the auto sector, Thursday’s release showed that auto sales in February fell below 17 mm SAAR. The first two months of 2018 have seen auto sales at the weakest pace since 2015 – another signal that we are likely in the later stages of the business cycle. Given that durable goods consumption is an important factor in GDP, the over 15% annualized decline in auto sales from 2017 will present a headwind for Q1 growth.
The auto sales data confirmed our Cash-Strapped Consumer and Middle-Class Squeeze investing themes. While the luxury brands had a great month, the major brands that appeal to the majority of the country had a tough month. Porsche, Audi and BMW saw year-over-year sales increase by 21%, 12.4% and 7.5% respectively while General Motors, Ford, Honda and Hyundai were hit with 6.9%, 6.9%, 5% and 13.1% year-over-year sales declines respectively.
- From Thursday’s Personal Income and Outlays report for January, Real Personal Spending slowed -0.1% in January, but what was more frustrating was that the annual figures that show real Disposable Personal Income rose just 1.2% in 2017, less than the 1.4% in 2016 while Personal Consumption Expenditures rose 2.7%, the same as in 2016. Disposable income rose less than in 2016 while outlays continue to grow faster. Remember those rising interest rates?
The bottom line is the economic data continues to paint a mixed picture while geopolitical risks are rising in the context of a market that has been priced for Goldilocks. Toto, I have a feeling we aren’t in 2017 anymore.