
Was last week the perfect storm that finally opened investor eyes?

DOWNLOAD THIS WEEK’S ISSUE
The full content of The Monday Morning Kickoff is below; however downloading the full issue provides detailed performance tables and charts. Click here to download.
Over the last few months, the market has consistently shrugged off rising concerns and questions, climbing to record high after record high. Amid escalating tensions with North Korea last week however, came the largest single day drop in the market since May. In this week’s Monday Morning Kickoff we dig into how the confluence of economic data, earnings reports and geopolitical unrest came to a head and what could be in store for investors as we move into September, traditionally the market’s worst performing month of the calendar.
Despite concerns of rising valuations and a mismatch between US growth prospects and earnings expectations, the markets had climbed fairly steadily throughout the second quarter and into the current quarter. That was, of course, until last week when we saw a change in market sentiment as North Korea and its weapons development took center stage. Those headlines and the back-and-forth between the Trump White House and North Korea clearly shifted the market’s attention and brought about a heightened level uncertainty.
Amid that refocus, we saw a number of high profile earnings reports that missed their respective Wall Street targets, including Macy’s (M), JC Penney (JCP), Kohl’s (KSS) Snap (SNAP) and Blue Apron (APRN) among others. We also received further domestic economic data on the inflation front that calls into question the Fed’s rate hike timing, and it’s the September debut of its balance sheet unwinding. The net result of all the political and economic news of last week led all the major U.S. stock indices to fall 1.1 to 1.5 percent.
Let’s share some context and perspective on that move – per data from Alliance Bernstein that dates back to 1928, the S&P 500 falls 5 percent or more every 10 weeks and the index falls 10 percent every 33 weeks. Looking back on the stock market of today, it has been more than a year since the last 5 percent downdraft in stocks and more than 76 weeks since the stock market suffered a 10 percent loss.
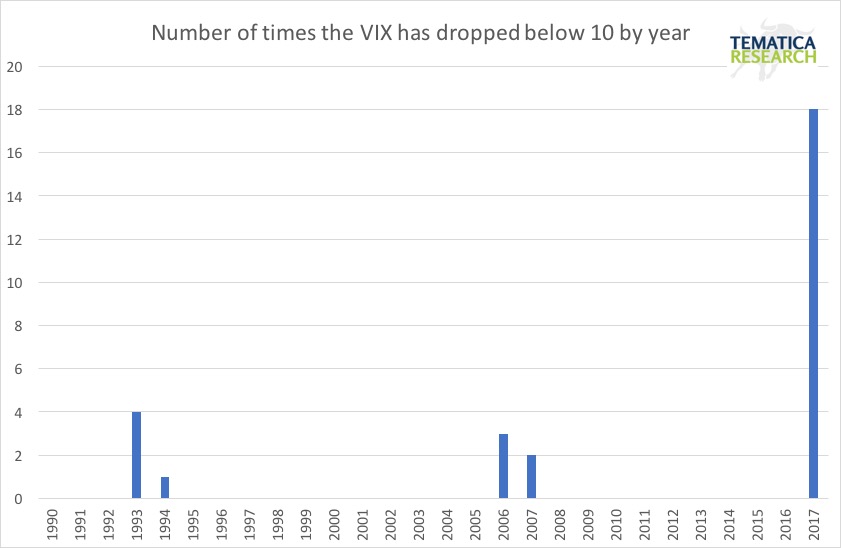
Last Thursday the markets experienced their steepest decline in three months, with the CBOE S&P 500 Volatility Index (VIX) hitting its highest level since the election, rising 44 percent in just one day. By Friday’s close, the volatility index had risen over 60 percent during the week and stocks had experienced their second worst week of the year.
Bear in mind, over the past decade, the U.S. stock market on average has experienced a 5 percent pullback in August. So far this year has seen the calmest period in terms of daily movements in 53 years. Volatility has been so suppressed that the inverse VIX ETFs are now the world’s 34th most actively traded investment vehicle, having more than doubled in price in 2017 through August 4th. The chart below shows just how astounding the low volatility has been in 2017 relative to years past.
Given the run the market has had thus far despite the mounting concerns we’ve raised in prior issues of the Monday Morning Kickoff, on our Cocktail Investing Podcast and with subscribers of Tematica Investing, we’re not surprised by the market action last week. Candidly, we suspect prudent investors are using the current U.S. – North Korea standoff to book gains and build cash ahead of September.
Why September? Not only is September historically speaking one of the most challenging months for the stock market, it’s also when we are now expected to get the Trump Administration’s initial tax reform plan at the same time Congress is forced to deal with the debt ceiling and perhaps we see the Fed charter a path it has never been on before as it starts to reduce its balance sheet.
September is also a month that will be filled with investor conferences, at which we expect companies will shed some light on how their businesses are shaping up during the current quarter and the back half of the year. Remember, expectations for earnings growth in the second half of the year for the S&P 500 group of companies has been and remains high. Per FactSet:
- For 3Q 2017, analysts are projecting earnings growth of 5.2 percent and revenue growth of 4.9 percent;
- For 4Q 2017, analysts are projecting earnings growth of 11.2 percent and revenue growth of 5.3 percent.
What those figures don’t tell you is EPS growth for the S&P 500 group of companies in the second half has been revised lower to 7.5 percent vs. the first half of 2017. That’s down from more than 10 percent expected growth as we launched into 2Q 2017 earnings season.
What Can We Look Forward to for the Back Half of the Year?
The current consensus price target for the S&P 500 is 2,705.48, roughly 11.0 percent above Friday’s market close. If the market were to hit both 2017 and 2018 EPS expectations that call for 10 to 11 percent earnings growth each, the S&P 500 would be trading at 20.5x and 18.5x, respectively.
The first question is how will those companies deliver such EPS growth as the current recovery moves even longer in the tooth?
While some will point to potential Trump policies and reforms, our view is that sentiment is shifting away from the Trump Bump euphoria we saw in late 2016 and the first quarter of 2017 to “let’s see what gets done and what it looks like”. In other words, everything now hinges on what policies are actually passed and when.
Here at Tematica, we believe the bloom is off the rose and before too long other analysts and economists will be saying “show me.” The longer it takes for those details to emerge and be put in place, the greater the odds of downward EPS and GDP revisions.
Here’s another thing to consider: the current “lack-of-reward” that is gripping the stock market.
Around 2,500 companies have reported earnings so far this season and while EPS growth for the S&P 500 companies has been over 10 percent — the strongest performance since Q4 of 2011 — there has been little, if any, reward given to those stock prices. In fact, out of the 2,500 companies that have reported, their stock has lost on average over 0.8 percent on its earnings day and most have continued to fall even after their initial earnings reaction day.
According to analysis by Bespoke Investment Group, companies that have beaten earnings estimates have averaged a minor gain of 0.81 percent on their earnings reaction days. Those that missed EPS estimates, on the other hand, have been hit with an average one-day drop of 3.6 percent. In the days following the initial earnings reaction day, investors have been selling, regardless of the company’s performance, with stocks that have beaten EPS falling an average of 2.6 percent since their reaction day. Those that missed their EPS estimates, in a bizarre contrast, have declined less, falling just 2.0 percent!
When have we seen this lack-of-reward phenomenon before? Well, just before the 2000 and 2007 market peaks. Here at Tematica, there are just way too many bulls for our comfort; Market Vane puts them around 70 percent with Investors Intelligence reporting 4 to 1 bulls to bears. Looking at the 11,100 ratings on the stocks that comprise the S&P 500, 49.2 percent are Buy ratings vs. 5.3 percent Sell ratings with the balance being Hold ratings. This bullishness is playing out in margin debt, which is soaring at a 20 percent annual rate, a typical late stage signal. The Dow closed the week ending August 4th having made 8 consecutive record highs, with a total of 34 record closes in 2017, again what we typically see as markets near their tops.
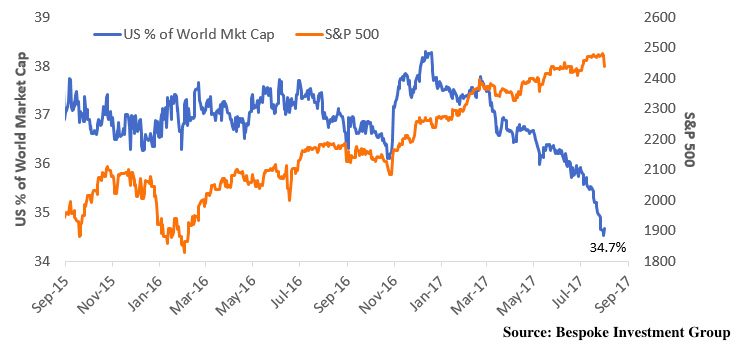
From an international perspective, the U.S. stock market looks a bit different, with the U.S. stock market capitalization as a percent of the world’s dropping significantly in 2017, which may account for why despite the record highs in the Dow, U.S. stocks have seen an astounding 7 consecutive weeks of net outflows amounting to more than $22 billion. The story of the U.S. stock market has been more about a falling dollar, with the S&P 500 in the red in euro terms for 2017. Friday’s weaker than expected CPI put further downward pressure on the dollar as expectations for further Fed hikes are getting pushed out later.
Major consumer-oriented companies have been giving us some warning signs on the economy.
Procter & Gamble (PG) CFO reported that growth in their U.S. markets has slowed from under 2 percent in 2016 to flat-lining in Q2 2017.
Colgate-Palmolive (CL) reported revenue from oral, personal and home care products fell 4 percent in the most recent quarter.
Consumer staples provider Kimberly-Clark (KMB) reported that it now expects to see next-to-no growth in the coming quarter versus earlier 1 to 2 percent growth forecasts, with their CEO stating that the near-term environment has become more challenging.
Turning to the Week Ahead
We expect the weekend’s political events will dictate how the week starts off out of the blocks. That will soon be followed by the July retail sales report, which we’ll be eyeing for continued confirmation of our Connected Society investment theme as well as overall consumer spending trends. As a reminder, over the last several months we’ve seen that report miss expectations more often than surprise on the upside — not a good sign for a consumer-led economy.
The reality is that consumer spending has been driven in large part by credit expansion, rather than rising income. The savings rate has fallen from 6.3 percent two years ago to 5.1 percent last year and is now down to 3.8 percent. Without increased borrowing, real consumption expenditures would have grown only around 1 percent year-over-year. Now that we see credit growth slowing, increasing spending is tougher.
Last week we heard Fluor CEO David Seaton comment that, “…the current market environment is perhaps the worst I’ve seen in my 30-plus years. The market has contracted since 2014. The good news is that we’re starting to see prospects come back in some of our end markets including mining.” We’ll be watching Wednesday’s Housing Starts and Building Permits for data to support his optimism. Thursday we’ll be pouring through Capacity Utilization and Industrial Production reports for more data points on the economy’s vector and velocity.
Taken together, these data points should help solidify the early view on third-quarter GDP. Currently, the forecast range for GDP during the current quarter spans from 2 percent on the low end to 3.5 percent on the high end. Our suspicion is that, much like we saw in the first half of the year, as more data comes in, we’re apt to see the Atlanta Fed’s 3.5 percent forecast deteriorate to something closer to the NY Fed’s 2 percent forecast. Again, that’s our suspicion, but as always we’ll let the data talk to us.
Also this week, we’ll get the July FOMC minutes. Even though expectations for the next rate hike continue to slip — data from the CME Group (CME) now shows just a 36 percent chance of a rate increase by the end of the year, down from 47 percent last Thursday and 54 percent a month ago — we’ll be sure to read them with an eye for the Fed unwinding its balance sheet as soon as September. We expect that unwinding to have a tighter monetary policy bent to it, and that means we’ll be watching not only the start of it, but the overall pace of that unwinding and what it may mean for the domestic economy.
Thematic Earnings On Tap This Week
On the earnings front, we have a number of earnings reports that we’ll be watching from a thematic perspective. For our Food with Integrity investing theme, we’ll be digging into the results from Sysco (SYY) to see how its product mix has skewed to better-for-you foods. Given the recent Connected Society linkage between Nike (NKE) and Amazon (AMZN), we’ll see how Dick’s Sporting Goods (DKS) and Foot Locker (FL) aim to respond.
With retail earnings in focus last week and this week, we’ll be assessing the state of the Rise aspect of our Rise & Fall of the Middle Class investing theme alongside our Cash-Strapped Consumer theme as we parse comments from TJX Companies (TJX), Ross Stores (ROST), Target (TGT) and Wal-Mart (WMT). With Wal-Mart in particular, we’ll be zeroing in on its digital commerce efforts, looking to see if the company is effectively leveraging its acquisition of Jet.com as well as any clues on how it may respond to the Amazon-Whole Foods (WFM) tie up.
On the Affordable Luxury front, we’ll be sifting through overall revenue at Coach (COH) and Estee Lauder (EL) to get a read on the geographic demand factors associated with our Affordable Luxury investment theme.
One of the key reports for the Tematica Select List will be Applied Materials (AMAT), given its position in the organic light emitting diode equipment market. It’s pretty well known that the organic light emitting diode display industry is capacity-constrained ahead of Apple’s adoption of the technology with the next iPhone model. That new iPhone is rumored to be currently in production ahead of its debut in several weeks, so new order data at Applied will tell us how much longer it will take until industry capacity catches up to overall demand.
For those unfamiliar with what’s going on with organic light emitting diode displays, it’s a new technology that is replacing existing LCD technologies in a variety of applications, ranging from smartphones to TVs and wearables. The power of this emerging technology has brought several of the players in its adoption into view of our Disruptive Technologies investment theme.
Given that Apple is now adopting OLED technology, a clear signal that it is ready for prime time, we expect it to rapidly adopted in the next few years, which should make shares of Universal Display (OLED) move like shares of Cree (CREE) did in 1999-2000 and 2009-2010, when its light emitting diode (LED) technology was adopted into smartphones and then TVs. We’ve raised our price target on OLED shares several times since adding it to the Tematica Select List last October, and odds are we’ll be doing it again if the demand dynamics play out as we see them in the back half of 2017.
Finally, Tematica’s Chief Investment Officer Chris Versace recently returned from Singapore where he experienced first-hand why Alibaba (BABA) is one to watch, not only for our Connected Society investment theme, but also our Cashless Consumption one as well. More on that can be heard in our recent Cashless in Singapore podcast. We’ll be tuning into Alibaba’s earnings report to gauge not only Connected Society adoption outside the US, but the company’s plans to expand its footprint and offering much like Amazon (AMZN).