Interest Rates and National Debt

Interest Rates and National Debt

Interest-Rates-and-National-Debt
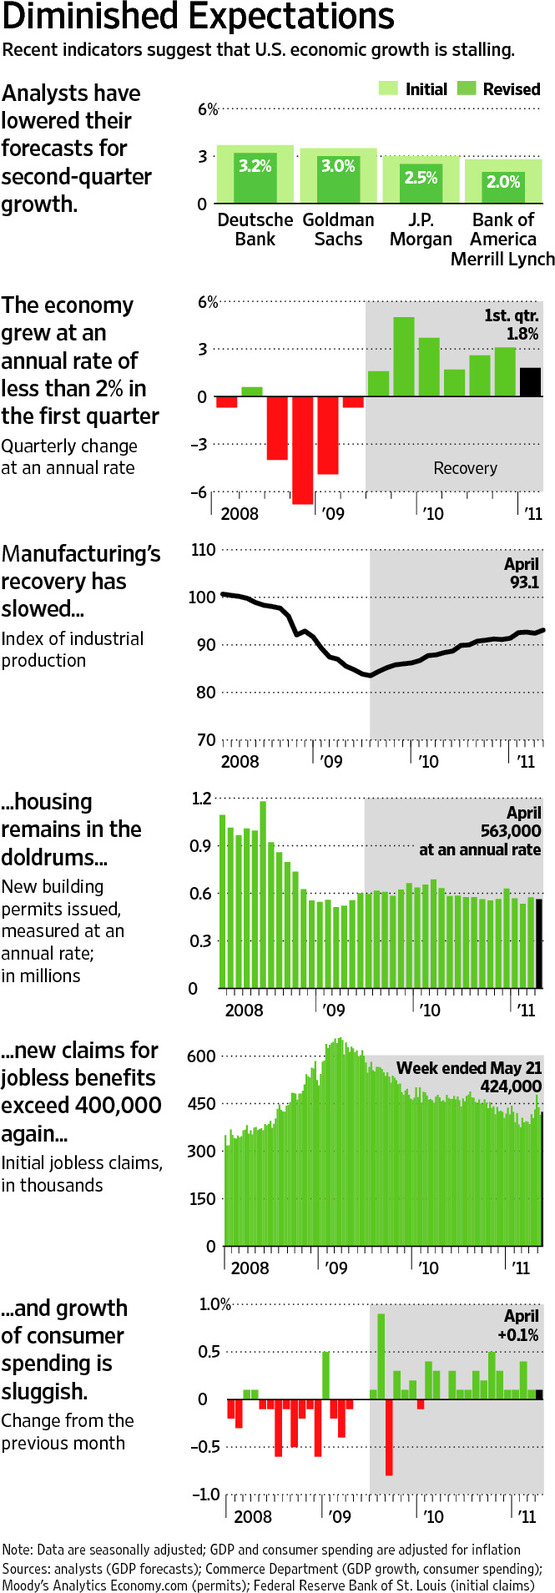
The Federal Reserve has been under considerable pressure to provide details for just how it will control all the excess liquidity that it has created through quantitative easing. The Fed’s balance sheet, which can roughly be thought of as a proxy for the potential money supply, is almost 2.4 times the size it was in 2007. Last month I discussed how excess bank reserves have skyrocketed to nearly $1.7 trillion after having historically averaged near zero since the inception of the Federal Reserve. The Fed has argued that it will be able to slowly raise interest rates and carefully reign in those excess funds to prevent rampant inflation. This is something that has never in history been accomplished, so there is no clear roadmap for how to do this successfully, but for argument’s sake, let’s assume that the Fed is indeed capable. The question then becomes, “How will rising interest rates affect the economy and investing?” One of the largest impacts of rising interest rates will be on the financials of the federal government. The chart above shows the U.S. National Debt from 1950 to 2012 (left hand axis) and the annual deficit/surplus (right hand axis). The current national debt is over $16 trillion. Over the past 5 years, the annual deficit has averaged $1.4 trillion. The national debt as a percent of GDP is almost double what it was in 2007. The annual deficit is 9 times the size it was in 2007. The recent sequester cuts sent D.C. into apoplectic fits with dire warnings of impending doom, however those “cuts”, according to the Congressional Budget Office, represented a decrease in the amount of spending increase that is less than the total increase, which means there will still be an increase in net spending after the sequester, (see Congressional Budget Office “Final Sequestration Report for Fiscal Year 2013” published March 2013). Given the emotional hoopla and doomsday rhetoric, it is reasonable to assume that the current level of deficit spending is unlikely to decrease significantly anytime soon.

The current 10 year Treasury interest rate is about 1.8%. It reached its lowest level in July 2012 at 1.53% and the highest rate was 15.32% in September 1981 when Paul Volker put the kibosh on inflation. The historical average rate has been about 4.6%. The current annual interest payment on the debt is just over $220 billion. If interest rates were to rise to only the historical average of 4.6%, that would be an increase of 2.8%, which would be an increase of nearly $110 billion, if we assume for simplicity that all the new issuance is a 10 year terms. (The reality is that some would be shorter term, some would be longer, and this is just meant to give an approximation to illustrate the magnitude of the impact.) That means interest expense on the debt would increase a whopping 50% in the next year. If the deficit spending continued at about the same rate for the next 6 years, annual debt interest payments would become the government’s costliest expense by 2020. For every year that we continue to deficit spend, increasing the national debt, the magnitude of the impact of rising interest rates increases.

That puts the Federal Reserve into quite a pickle if the economy does in fact gets some legs and inflation ignites. Don’t raise rates and face punishing inflation. Raise rates and D.C. is going to be put under even more pressure to reduce spending. No wonder Chairman Ben Bernanke has been giving subtle indications that he isn’t keen on yet another term as Chairman!

Federal Reserve and National Debt

It took the federal government around 200 years to accumulate a trillion dollars in debt. Within the following decade it tripled that number, then doubled it again in just twelve years, and doubled it again in another 8 years. Overall the national debt has increased sixteen-fold in just 30 years. Incidentally, this period coincides with the complete delinking of the U.S. currency to the gold standard.

So how are we managing all this debt? In 2013 the Federal Reserve will buy approximately 90% of the country’s issuance of Treasuries and mortgage bonds! That’s one way to explain how a nation facing such a growing mountain of debt, a slowing to stalling economy, and a paralyzed political process is able to maintain such incredibly low interest rates. Treasuries have long been used as the standard for the risk-free rate. With only 10%
of the issuance to float freely in the market, the Fed is able to generate considerable demand for this “risk-free” asset class, driving prices up, which means driving interest rates down.

The massive distortions from the various Quantitative Easing programs have damaged the market mechanisms for understanding the true price of risk, which gives markets an understanding of the appropriate cost of capital. A market that no longer can obtain this information has a big problem, because mispricing of risk leads to misallocation of capital.

The proverbial saying goes that markets love to climb a wall of worry. We’ve seen corporate earnings and revenue growth slow sharply through the past year, with corporate guidance for future performance continuing to be rather grim, yet equities have had quite a run. This is due to expanding P/E multiples as we discussed in last month’s newsletter. This expansion is 85% correlated to the Fed’s ongoing balance sheet expansion, as it is now adding about $85 billion of relatively secure fixed income securities to its $3 trillion portfolio on a monthly basis. Such an enormous level of buying in the markets, leaving only 10% of new issuance available for purchase, is forcing investors into other assets, pushing up prices.

How is this level of Fed activity going to end? David Rosenberg of Gluskin Sheff described the situation well by saying,

“I am concerned over the unintended consequences of these experimental policy measures that have no precedence, but perhaps these consequences lie too far ahead in time from a ‘tactical’ sense, but we should be aware of them. The last cycle was built on artificial prosperity propelled by financial creativity on Wall Street and this cycle is being built on an abnormal era of central bank market manipulation.” January 17th, 2013.

Bottom Line: When one looks over the past 12 years of active Federal Reserve monetary policy in which we experienced repeated bubbles followed by painful pops, why does anyone believe this time will be different? Particularly when this time we experienced monetary activism on an unprecedented scale: we are truly in uncharted waters.

Debt Ceiling – what most get wrong

The Debt Ceiling is a cap set by Congress on the amount of debt the federal government can legally borrow. The cap applies to debt owed to the public, (meaning anyone who buys U.S. bonds) plus debt owed to federal government trust funds such as those for Social Security and Medicare.  The limit was first set in 1917 at $11.5 billion.  Previously, Congress had to sign off every time the federal government issued debt.

The ceiling is currently set at $14.294 trillion. The debt blew past that mark on the morning of May 16.  By taking various measures like suspending investments in federal retirement funds, Treasury Secretary Tim Geithner has been able to bring total debt down enough to allow the government to continue borrowing until Aug. 2.

If the debt ceiling is not raised, it is unlikely that the Federal government would default on bond or Social Security payments, but rather implement some other combination of spending cuts and/or tax increases.

Currently the federal government spends $1.4 trillion more than it receives in tax revenue.  Without an increase in the debt ceiling, the federal government would have to cut this much in spending which would mean that approximately 9.3% of GDP ($1.4 trillion / current GDP of about $15 trillion) would be withdrawn from the Federal government’s spending in the economy.

You’ve may have seen economists and politicians go into apoplectic fits over how this means an immediate 9.3% reduction in GDP, which would clearly be disastrous for the economy.  This is another example of Keynesian math gone wrong as the money that would have been borrowed by the government to fund this excess spending would not just disappear into thin air.  Does it really make sense that we have two options, the government borrows and then spends $1.4 trillion OR that $1.4 trillion ceases to exist?  Those funds would still exist and likely be invested or spent elsewhere – potentially generating even more than $1.4 trillion in the economy.

That being said, given the magnitude of cuts that would be required, we believe it is unlikely that Congress will not raise the limit at some point, however it could possibly do so after the August 2nd deadline.  In fact, the markets would likely prefer a delay in raising the limit that is accompanied by a credible plan to reduce the deficit and the national debt, versus an increase that is not accompanied by any credible plan.  Think of it this way, you lent money to your neighbor a few years back and now see that he is simply digging himself deeper into debt.  Would you rather have him continue getting new credit cards just to pay you the interest on your loan or would you prefer to have him miss a payment or two while he develops a reasonable way to cut his spending so that you are confident that not only will you get your interest payments, but also your principal?

Bottom Line:  Be wary of the overly simplistic math used in most of the media these days.  The slogan, “If it bleeds it leads,” is alive and well and financial Apocalypse headlines make for sensational copy and help politicians garner valuable air time.

The Debt Ceiling – What Most Get Wrong

The Debt Ceiling is a cap set by Congress on the amount of debt the federal government can legally borrow. The cap applies to debt owed to the public, (meaning anyone who buys U.S. bonds) plus debt owed to federal government trust funds such as those for Social Security and Medicare.  The limit was first set in 1917 at $11.5 billion.  Previously, Congress had to sign off every time the federal government issued debt.

The ceiling is currently set at $14.294 trillion. The debt blew past that mark on the morning of May 16.  By taking various measures like suspending investments in federal retirement funds, Treasury Secretary Tim Geithner has been able to bring total debt down enough to allow the government to continue borrowing until Aug. 2.

If the debt ceiling is not raised, it is unlikely that the Federal government would default on bond or Social Security payments, but rather implement some other combination of spending cuts and/or tax increases.

Currently the federal government spends $1.4 trillion more than it receives in tax revenue.  Without an increase in the debt ceiling, the federal government would have to cut this much in spending which would mean that approximately 9.3% of GDP ($1.4 trillion / current GDP of about $15 trillion) would be withdrawn from the Federal government’s spending in the economy.

You’ve may have seen economist and politicians go into apoplectic fits over how this means an immediate 9.3% reduction in GDP, which would clearly be disastrous for the economy.  This is another example of Keynesian math gone wrong as the money that would have been borrowed by the government to fund this excess spending would not just disappear into thin air.  Does it really make sense that we have two options, the government borrows and then spends $1.4 trillion OR that $1.4 trillion ceases to exist?  Those funds would still exist and likely be invested or spent elsewhere – potentially generating even more than $1.4 trillion in the economy.

That being said, given the magnitude of cuts that would be required, we believe it is unlikely that Congress will not raise the limit at some point, however it could possibly do so after the August 2nd deadline.  In fact, the markets would likely prefer a delay in raising the limit that is accompanied by a credible plan to reduce the deficit and the national debt, versus an increase that is not accompanied by any credible plan.  Think of it this way, you lent money to your neighbor a few years back and now see that he is simply digging himself deeper into debt.  Would you rather have him continue getting new credit cards just to pay you the interest on your loan or would you prefer to have him miss a payment or two while he develops a reasonable way to cut his spending so that you are confident that not only will you get your interest payments, but also your principle?

Bottom Line:  Be wary of the overly simplistic math used in most of the media these days.  The slogan, “If it bleeds it leads,” is alive and well and financial Apocalypse headlines make for sensational copy and help politicians garner valuable air time.

How and Why of Greek Debt

How and Why of Greek Debt

When a nation has more debt than it can manage, it has two options (1) inflate its way out by printing more money or (2) restructure the debt.

Typically the most politically feasible solution is to inflate.  Generally wages tend to keep up to some degree with inflation, so the employed feel as if they are getting a raise and don’t gripe too much.  Those in the population who have debts prefer inflation as the relative “cost” of their debt decreases over time, e.g. with 5% inflation, debt declines in real terms by 5% every year.  It is the savers who suffer most as they watch inflation eating away at what they’ve built – in a converse to inflation reducing debt, savings declines in value by 5% every year.  This is why inflation is often referred to as a hidden tax.

The Europeans cannot inflate their way out of too much debt for the PIIGS as the U.S. is way ahead of them in the race to the bottom and they have conflicting needs across countries.  A monetary union without a political, fiscal and cultural union is complicated at best.  So why the continued kick the can?  The largest banks (German Deutsche Bank, the French BNP Paribas, Société Générale and Crédit Agricole SA among many others) have not increased their reserve capital, which would dilute shareholders, and do not want to take losses on their significant holdings of PIIGS bonds.  The euphemistic “restructuring” of these bonds would by definition require some sort of write down in value for the banks.http://www.insidermonkey.com/blog/wp-content/uploads/2011/06/Who-holds-Greek-debt.jpg

Bank’s hold these bonds as assets on their balance sheets.  They are required to maintain a certain level of assets relative to the amount of loans they give.  If the value of their assets were to suddenly drop, they could find themselves in violation of the regulations concerning this ratio.  As you can imagine – that is not good for the banking sector and lending!  We saw the last time this occurred the credit markets effectively shut down, any type of borrowing was nearly impossible, and the engine of the global economy geared way down.

So how did the U.S. get out of the bog in which the Eurozone is currently mired?  In the Spring of 2009, the U.S. banks were eventually forced to raise hard common equity that was then used to absorb losses on loans.  The fixed income market did bottom out in the Fall of 2008, but when banks sought this equity, their stocks did not wither on the vine, albeit life wasn’t exactly rosy.  Rather than taking this approach, the International Monetary Fund (IMF), the European Central Bank (ECB) and the German and French banks are giving Greece just enough liquidity to roll their debt, not the permanent equity investments that were made here in the U.S.  The Euro approach is just a temporary patch on a cracking dam.  Only when the European banks raise equity, as we did here, and the PIIGS debt is restructured will there be a true resolution.

Q1 Dissapointed, Q2 to repeat?

Q1 Dissapointed, Q2 to repeat?

After the disappointing growth in the first quarter of 2011, many economists believed that the economy would pick up in the second quarter.   At Meritas we looked at the trends in housing (still dropping), employment (fewer employed today than in 2000), income (declining real wages) the credit markets (little expansion), and government spending (fiscal stimulus to decline) and just couldn’t see how the math could possibly work to generate a robust second quarter.  Looks like the economists were wrong, as well an many of the big banks.

JPMorgan revised down their estimate to a 2.5% GDP growth rate from 3%, while Bank of America Merrill Lynch cut theirs to 2% from 2.8%.  Deutsche Bank also cut its forecast to 3.2% from 3.7%.

According to the study by Carmen Reinhart and Kennneth Rogoff, “This Time is Different,”  growth rates are typically subdued after a financial crisis versus a recession induced by other factors.  In addition, when countries reach high levels of debt to GDP ratio, near the 1:1 level as exists in the U.S. and most of the developed countries, GDP growth suffers.

Until employment and housing show significant improvements (and the two are clearly related), we don’t expect to see consistently strengthening growth rates.

An Alternative To Increasing Taxes

I hear politicians and pundits talking about the massive federal debt and assume that the only way to deal with the problem is to raise tax rates.   Raising rates in tough economic times can be very damaging to the economy and may in fact, result in lower tax receipts as tax payers can shift their behavior in response to higher taxes.  Dan Mitchell of the Cato Institute put together a video on the subject.

The Rahn Curve

As I head off to Las Vegas for an exceptionally inspiring conference called FreedomFest, I thought I’d leave you with a great video from my friend Dan Mitchell about the Rahn Curve, (developed by Richard Rahn) which graphically illustrates the relationship between the size of government and the economic success of a country.  On the one extreme, anarchy is incredibly expensive and suppresses productivity.  On the other extreme, an large government, with onerous tax burdens is also debilitating for an economy.  As an investment advisor I watch the direction the nation is taking, as over the long-run that will affect overall GDP and investment opportunities.  We are currently on a disconcerting trajectory of government expansion, with increasing sovereign debt and onerous rules and regulation to control and limit the growth of business.  While Europe moves away from Keynesian economics as they realize the consequence of entitlement programs they cannot afford, we continue to expand ours.

The First Step is Admitting You Have a Problem

The First Step is Admitting You Have a Problem

This morning as I eagerly gulped down some much needed coffee and tried to read the Journal through my bleary eyes, I realized that I just might want to cut back on the caffeine.  That got me thinking about how the first step is acknowledging the problem.


Apparently America is also acknowledging that it has an addiction that has historically fired the economy up like my morning fix, but we seem to now be in the dreaded 2pm crash.  A recent Gallup poll shows that Americans are finally worried about the magnitude of the federal debt.  We can only hope that this awareness translates into political pressure to curb spending and address both the current mountain of debt and the tsunami of unfunded liabilities racing towards us.