Weekly Issue: While Most Eyes Are on the Fed, We Look at a Farfetch(ed) Idea

Weekly Issue: While Most Eyes Are on the Fed, We Look at a Farfetch(ed) Idea

Key points inside this issue

  • The Fed Takes Center Stage Once Again
  • Farfetch Limited (FTCH) – A fashionable Living the Life Thematic Leader
  • Digital Lifestyle – The August Retail Sales confirms the adoption continues


Economics & Expectations

The Fed Takes Center Stage Once Again

As we saw last week, the primary drivers of the stock market continue to be developments on the U.S.-China trade front and the next steps in monetary policy. As the European Central Bank stepped up its monetary policy loosening, it left some to wonder how much dry powder it had remaining should the global economy slow further and tip into a recession. Amid those concerns, along with some discrepancy among reports that President Trump would acquiesce to a two-step trade deal with China, stocks finished last week with a whimper after rebounding Wednesday and Thursday.

We continue to see intellectual property and national security as key tenets in negotiating a trade deal with China. We will watch as the lead up to October’s next round of trade negotiations unfolds. Given the Fed’s next two-day monetary policy meeting that begins on Tuesday and culminates with the Fed’s announcement and subsequent press conference, barring any new U.S.-China trade developments before then, it’s safe to say what the Fed says will be a key driver of the stock market this week.

Leading up to that next Fed press conference, we will get the August data for Industrial Production and Housing Starts as well as the September Empire State Manufacturing Index. Paired with Friday’s August Retail Sales report and last Thursday’s August CPI report, that will be some of the last data the Fed factors into its policy decision.

Per the CME Group’s FedWatch tool, the market sees an 82% probability for the Fed to cut interest rates by 25 basis points this week with possibly one more rate cut to be had before we exit 2019. Normally speaking, parsing the Fed’s words and Fe Chair Powell’s presser commentary are key to getting inside the central bank’s “head,” and this will be especially important this time around. One of our concerns has been the difference between the economic data and the expectations it is yielding in the stock market. Should the Fed manage to catch the market off guard, odds are it will give the market a touch of agita.

On the earnings front

there are five reports that we’ll be paying close attention to this week. They are Adobe Systems (ADBE), Chewy (CHWY), FedEx (FDX), General Mills (GIS) and Darden Restaurants (DRI). With Adobe, we’ll be examining the rate of growth tied to cloud, an aspect of our Disruptive Innovators investing theme. With Darden we’ll look to see if the performance at its full-service restaurants matches up with the consumer trade-down data being reported by the National Restaurant Association. That data has powered shares of Cleaner Living Thematic Leader and Cleaner Living Index resident Chipotle Mexican Grill (CMG) higher of late, bringing the year to date return to 82% vs. 20% for the S&P 500. Chewy is a Digital Lifestyle company that is focused on the pet market serving up food, toys, medications and other pet products. Fedex will not only offer some confirmation on the digital shopping aspect of our Digital Lifestyle investing theme it will also shed some light on the global economy as well.


Farfetch Limited – A fashionable Living the Life Thematic Leader

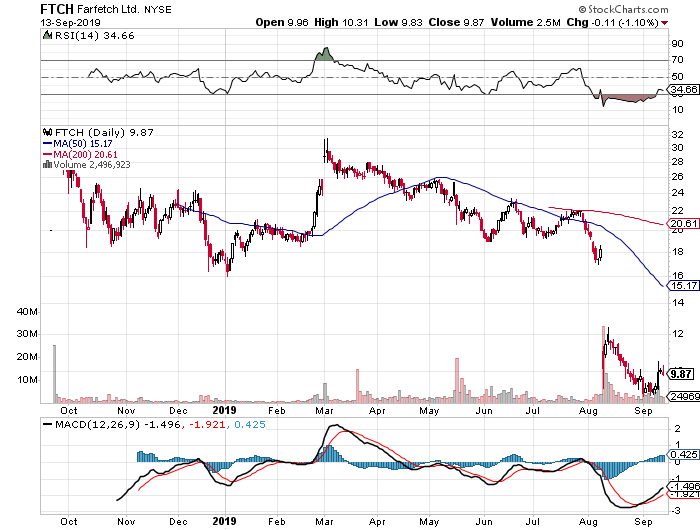
In last week’s issue, I mentioned that I was collecting my thoughts on Farfetch Limited (FTCH), a company that sits at the intersection of the luxury goods market and digital commerce. Said thematically, Farfetch is a company that reflects our Living the Life investment theme, while also benefitting from tailwinds of our Digital Lifestyle theme. Even though the company went public last year, it’s not a household name even though it operates a global luxury digital marketplace. As the shares have fallen over the last several weeks, I’ve had my eyes on them and now is the time to dip our toes in the water by adding FTCH as a Thematic Leader.


Farfetch Provides Digital Shopping to the Exploding Global Luxury Market

Farfetch is a play on the global $100 billion online luxury market with access to over 3,200 different brands across more than 1,100 brand boutique partners across its platform. With both high-end and every-day consumers continuing to shift their shopping to online and mobile platforms, we see Farfetch attacking a growing market that also has the combined benefit of appealing to the aspirational shopper and being relatively inelastic compared to mainstream apparel.

Part of what is fueling the global demand for luxury and aspirational goods is the rising disposable income of consumers in Asia, particularly China. According to Hurun’s report, The Chinese Luxury Traveler, enthusiasm for overseas travel shows no signs of abating, with the proportion of time spent on overseas tourism among luxury travelers increasing 5% to become 70% of the total. Cosmetics, (45%), local specialties (43%), luggage (39%), clothing and accessories (37%) and jewelry (34%) remain the most sought — after items among luxury travelers. High domestic import duties and concerns about fake products contribute to the popularity of shopping abroad.

It should come as little surprise then that roughly 31% of FarFetch’s 2018 revenue was derived from Asia-Pacific with the balance split between Europe, Middle East & Africa (40%) and the Americas (29%). At the end of the June 2019 quarter, the company had 1.77 million active customers, up from 1.35 million exiting 2018 and 0.9 million in 2017. As the number of active users has grown so too has Farfetch’s revenue, which hit $718 million over the 12 months ending June 2019 compared to $602 million in all of 2018 and $386 million in 2017.

Farfetch primarily monetizes its platform by serving as a commercial intermediary between sellers and end consumers and earns a commission for this service. That revenue stream also includes fees charged to sellers for other activities, such as packaging, credit-card processing, and other transaction processing activities. That business accounts for 80%-85% of Farfetch’s overall revenue with the balance derived from Platform Fulfillment Revenue and to a small extent In-Store Revenue.

New Acquisition Transformed Farfetch’s Revenue Mix 

In August, Farfetch announced the acquisition of New Guards Group, the Milan-based parent company of Off-White, Heron Preston and Palm Angels, in a deal valued at $675 million. New Guards will serve as the basis for a new business segment at Farfetch, one that it has named Brand Platform. Brand Platform will allow Farfetch to leverage New Guards’ design and product capabilities to expand the reach of its brands as well as develop new brands that span the Farfetch platform. For the 12-month period ending April 2019, the New Guards portfolio delivered revenue of $345 million, with profits before tax of $95 million. By comparison, Farfetch posted $654 million in revenue and an operating loss of $183 million over that time frame.

Clearly, another part of the thought behind acquiring New Guards and building the Brand Platform business is to improve the company’s margin and profit profile. And on the housekeeping front, the $675 million paid for New Guards will be equally split between cash and stock. Following its IPO last year, Farfetch ended the June quarter with roughly $1 billion in cash and equivalents on its balance sheet.

In many ways what we have here is a baby Amazon (AMZN) that is focused on luxury goods. Ah, the evolution of digital shopping! And while there are a number of publicly traded companies tied to digital shopping, there are few that focus solely on luxury goods.

Why Now is the Time to Add FTCH Shares

We are heading into the company’s seasonally strongest time of year, the holiday shopping season, and over the last few years, the December quarter has accounted for almost 35% of Farfetch’s annual sales. With the company’s active user base continuing to grow by leaps and bounds, that historical pattern is likely to repeat itself. Current consensus expectations have Farfetch hitting $964 million in revenue for all of 2019 and then $1.4 billion in 2020.

At the current share price, FTCH shares are trading at 1.6x expected 2020 sales on an enterprise value-to-sales basis. The consensus price target among the 10 Wall Street analysts that cover the stock is $22, which equates to an EV/2020 sales multiple of near 3.5x when adjusting for the pending New Guards acquisition. As we move through this valuation exercise, we have to factor into our thinking that Farfetch is not expected to become EBITDA positive until 2021. In our view, that warrants a bit of haircut on the multiple side and utilizing an EV/2020 sale multiple of 2.5x derives our $16 price target.

  • Despite that multiple, there is roughly 60% potential upside to that target vs. downside to the 52-week low of $8.82.
  • We are adding FTCH shares to the Thematic Leaders for our Living the Life investing theme.
  • A $16 price target is being set and we will wait to put any sort of stop-loss floor in place.


Digital Lifestyle – The August Retail Sales confirms the adoption continues

One of last week’s key economic reports was the August Retail Sales report due in part to the simple fact the consumer directly or indirectly accounts for two-thirds of the domestic economy. Moreover, with the manufacturing and industrial facing data – both economic and other third-party kinds, such as truck tonnage, railcar loadings and the like – softening in the June quarter, that quarter’s positive GDP print hinged entirely on the consumer. With domestic manufacturing and industrial data weakening further in July and August, the looming question being asked by many an investor is whether the consumer can keep the economy chugging along?

In recent months, I’ve voiced growing concerns over the spending health of the consumer as more data suggests a strengthening tailwind for our Middle-Class Squeeze investing theme. Some of that includes the Federal Reserve Bank of New York’s latest Household Debt and Credit Report, consumer household debt balances have been on the rise for five years and quarterly increases continue on a consecutive basis, bringing the second quarter 2019 total to $192 billion. Also a growing number of banks are warning over rising credit card delinquencies even as the Federal Reserve’s July Consumer Credit data showed revolving credit expanded at its fastest pace since November 2017.

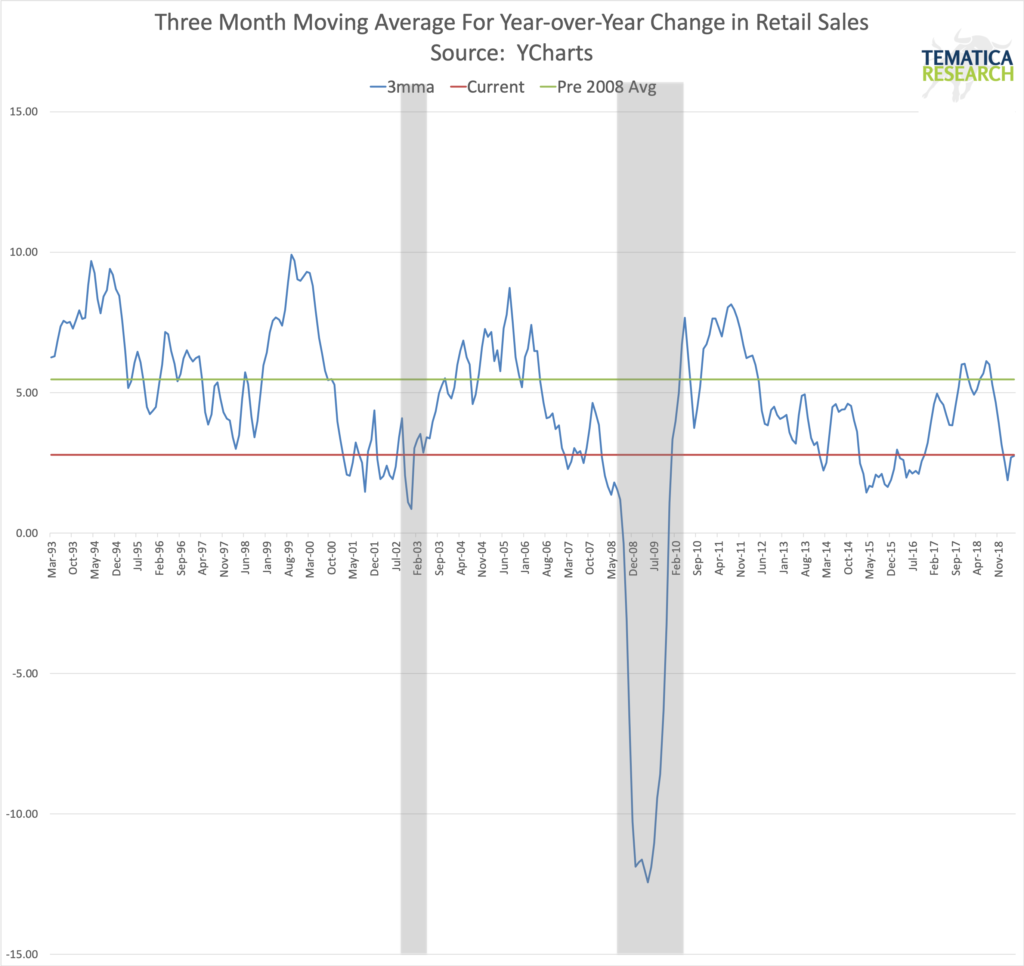
Getting back to the August Retail Sale report, the headline print was a tad better than expected, however once we removed auto sales, retail sales for the month were flat. That’s on a sequential basis, but when viewed on a year over year one, retail sales excluding autos rose 3.5% year over year. That brought the year over year comparison for the three-months ending with August to up 3.4% and 1.5% stronger than the three months ending in May on the same basis.

Again, perspective can be illuminating when looking at the data, but what really shined during the month of August was digital shopping, which rose 16.0% year over year. That continued strength following the expected July surge in digital shopping due to Amazon Prime Day and all the others that looked to cash in on it led year over year digital shopping sales to rise 15.0% for the three months ending in August.

Without question, this aspect of our Digital Lifestyle investing theme continues to take consumer wallet share, primarily at the expense of brick & mortar retailers, especially department stores, which saw their August retail sales fall 5.4%. That continues the pain felt by department stores and helps explain why more than 7,000 brick & mortar locations have shuttered their doors thus far in 2019. Odds are there is more of that to come as consumers continue to shift their dollar purchase volume to online and mobile shopping as Walmart (WMT), Target (TGT) and others look to compete with Amazon Prime’s one day delivery.

  • For all the reasons discussed above, Amazon remains our Thematic King as we head into the seasonally strong holiday shopping season. 


Weekly Issue: While far from booming, U.S. economy not  as bad as the headlines

Weekly Issue: While far from booming, U.S. economy not as bad as the headlines

Key points inside this issue

  • Thematic confirmation in the July Retail Sales report
  • Getting back to the global economy and that yield curve inversion
  • The week ahead
  • The Thematic Leaders and Select List
  • A painful reminder about dividend cuts

Despite Friday’s rebound, the stock market finished down week over week as it continued to grapple with the one-two punches of the slowing global economy and U.S.- China trade. There was much chatter on the recent yield-curve inversion, but as we look back at the economic data released last week, the U.S. economy continues to be on more solid footing than the Eurozone or China.

That’s not to say the domestic economy is booming. The Cass Freight Index, weekly railcar-traffic and truck-tonnage data and the July U.S. industrial-production report’s manufacturing component leave little question that America’s manufacturing economy is slowing. And as we saw last week, the U.S. consumer buoyed the economy in July with stronger-than-expected retail sales.


Thematic confirmation in the July Retail Sales report 

Last week’s July Retail Sales Report confirmed one of the key aspects of our Digital Lifestyle investment theme – the accelerating shift toward digital shopping that continues to vex brick and mortar retailers, particularly department stores. Granted, the year over year increase in non- store retail sales of 16.0%, which was several magnitudes greater than overall July Retail Sales that rose 3.4% year over year and bested sequential expectations, was aided by Thematic King Amazon’s (AMZN) 2019 Prime Day event but one month does not make a quarter. For the three months ending July, non-store retail sales rose 14.2% year over year, easily outstripping the 3.2% year over year comparison for overall retail sales. 

Clearly, the shift to digital shopping is not only underfoot, or more properly stated on a variety of keyboards, it is accelerating, and the victims continue to be department stores, electronics and appliance stores, sporting goods and bookstores, and to a lesser extent clothing and furniture. We’re seeing this play out in the results from Macy’s (M) as well as J.C. Penney (JCP), which is so strategically lost it is venturing into the used clothing market through a partnership with online consignment company thredUP. With its July quarter sales down 9% year over year, J.C. Penney is going for the “Hail Mary” pass with this move, but it’s only going to bring cheaper product in to compete with its already low-priced offering. I can almost understand the J.C. Penney is looking to double-down on our Middle-Class Squeeze investing theme, but it’s facing stiff competition from companies like Poshmark that are doing that as well as riding our Digital Lifestyle theme. 

Each of those challenged categories I mentioned above are also areas that Amazon continues to target with offerings from both third-party sellers as well as its growing private label line of products. I’ve often said Amazon shares are ones to hold, not trade, and we continue to feel that way as we approach the seasonally strongest time of the year for its business.


Getting back to the global economy and that yield curve inversion

For now, the U.S. economy remains the best house on the economic block — but it’s showing signs of wear. Of course, the fact the yield curve inverted briefly last week rang the “Recession Warning Bell.” But let’s remember that there’s historically been a lag of up to almost two years following that warning. Moreover, the Federal Reserve has already adopted a more dovish tone and will likely stand ready to add more stimulus to the economy if need be. All eyes will now on the Fed’s mid-September monetary-policy meeting.

Meanwhile, as economic-growth worries increased in the Eurozone and China last week, we heard about a big bazooka of stimulative measures that the European Central Bank is considering for its Sept. 12 policy meeting. China will also reportedly soon roll out a plan to boost disposable income over the coming quarters to spur its domestic consumption.

I would suggest you tune in later this week for what Tematica’s Chief Macro Strategist Lenore Hawkins has to say on this.

We’ll continue to monitor how global central bankers try to steer their respective economies in the coming weeks. While we suspect that Wall Street will likely cheer any and all dovish moves, the question remains how stimulative those policies will really be if the U.S.-China trade war continues.

U.S.-Chinese trade talks are set to resume in September, which tells us that we might get a lull in Wall Street’s recent volatility. But we should by no means think that “Elvis has left the building,” and we could very well see another round of turbulence in the coming weeks.


The Week Ahead

With two weeks to go until the Labor Day holiday weekend, we’re officially in the dog days of summer. These weeks historically see lower-than-usual trading volume, as investors and traders look to squeeze in that last bit of fun in the sun. Following last week’s full plate of economic data, this week will have a far smaller helping coming at us. Upcoming reports include July new- and existing-home sales, as well as the Index of Leading Economic Indicators.

Investors will also focus on what the latest flash PMI data from IHS Markit has to say about the global economy when that report lands on Aug. 22. I’ll be looking to see whether the U.S. economy continues to outperform Japan, China and the Eurozone following data out last week that suggested the German and Chinese economies continue to slow.

Reading those reports and the upcoming Federal Open Market Committee meeting minutes should set the stage for what we’re likely to hear when the FOMC next meets on Sept. 18. We’ll also have more data coming our way over the weeks leading up to the FOMC session, and we’re apt to get a few surprises along the way. While there’s no Fed interest-rate meeting scheduled for August, the Kansas City Fed will hold its widely watched annual Jackson Hole symposium Aug. 22-24 in Wyoming. The central bank doesn’t usually discuss monetary-policy plans at this event, but we aren’t exactly in normal times these days.

On the earnings calendar this week, the focus will continue to be on retail. If we were reminded of one thing last week in retail land, it’s that not all companies are responding the same way to retailing’s changing landscape. Just look at what we heard last week from Walmart (WMT), Macy’s (M) and JCPenney (JCP). Other key retail reports to watch this week include Home Depot (HD), Kohl’s (KSS), Lowe’s (LOW), Target (TGT), Dick’s Sporting Goods (DKS), and Foot Locker (FL). I’ll be looking for the degree to which they’re embracing digital shopping, as well as what they have to say about tariff implications and their expectations for 2019’s remainder.

We’ll also hear from Salesforce (CRM) and Toll Brothers (TOL), which should shed some light on the housing market and IT spending associated with our Disruptive Innovators and Digital Infrastructure investing themes.


The Thematic Leaders and Select List

As I noted above, last week was another choppy one for the stock market and those swings stopped out of Thematic Digital Infrastructure Leader Dycom Industries (DY) as well as Cleaner Living company International Flavors & Fragrances (IFF) shares. Given that we were stopped out, it means we took some losses in those two positions, but as I look at the live ones across the Thematic Leaders and the Select List I see an impressive array of returns with our Amazon, Costco Wholesale (COST), Chipotle Mexican Grill (CMG), McCormick & Co. (MKC), Walt Disney (DIS), Universal Display (OLED) and USA Technologies (USAT) shares. 

Wide swings in the market can present both challenging times as well as opportunities provided, we get some degree of clarity. As I touched on above, the first few weeks of September could be when we see that clarity emerge. Until then, we’ll continue to look for thematically well positioned companies at favorable risk to reward entry points. 


A painful reminder about dividend cuts

Last week I mentioned that the following – I’m focusing more on domestic-focused, inelastic business models that tend to spit off cash and drive dividends. In particular, I’m looking at companies with a track record of increasing their dividends every year for at least 10 years. And of course, they have to have vibrant thematic tailwinds at their respective back.

While I was doing just that, shares of famous lawn-mower engine maker Briggs & Stratton Corp. (BGG) — whose shares tumbled 44.5% last Thursday — presented a sharp reminder as to what can happen when a company cuts its dividend. Yes, the shares rebounded late last week along with the market, but they’ve been generally falling for a long time as the company’s dividend looked shakier and shakier.

Investors tend to think of quarterly dividends as payments in perpetuity, but these payouts are actually only declared at a company board’s discretion. When dividends are disrupted, that can lead to significant share-price pain for a stock.

In this case, Briggs & Stratton not only cut its dividend and reported a far-greater-than-expected quarterly loss, but also slashed its outlook for the balance of the year. The company now expects to earn just $0.20-$0.40 per share for the full year, which down significantly from its prior forecast of $1.30.

When matched up against its revised revenue forecast of $1.91 billion to $1.97 billion vs. a prior $2.01 billion, it’s rather evident that BGG’s cost structure has become an issue. So, it’s no little surprise that Briggs & Stratton also announced plans to close a plant that manufactures engines for the walk-behind lawn mowers you commonly find at Home Depot (HD) or Lowe’s (LOW) .

The company called out that product category in particular for weakness, which management attributed to the U.S. housing market’s current tone. I’ve previously talked about how new- and existing-home sales have been rather sluggish despite the recent mortgage-rate drop, with low rates fueling a wave of home refinancings rather than purchases.

But the biggest factor behind Thursday’s steep BGG dive was the fact that management slashed the company’s quarterly dividend by 64% to $0.05 per share from the prior $0.14. That one-two-three punch combination — bad earnings, a bad forecast and a dividend cut — sent Briggs & Stratton’s share price tumbling.

Going into Thursday morning’s earnings report, BGG shares were sporting a 6.8% dividend yield, which is on the lofty side. Investors should have interpreted that as a warning and here’s why – even before Thursday’s selloff, BGG shares had been down some 70% since January 2018, partly because the company missed analysts’ earnings expectations for the prior three quarters. In hindsight, the misses were escalating in percentage terms — a trend that continued with Thursday’s earnings report.

Paired with the dividend cut, there’s little confidence any more in the current management team, which means BGG shares are likely to flounder further due to several unknowns. Some of those unknowns are company specific, like: “Will be the plant closure deliver sufficient savings?” But others are about the U.S. economy’s future vector and velocity, which Thursday’s July industrial-production report shows is continuing to cool.

And while the July U.S. retail-sales report came in better than expected, we already know that consumers aren’t buying lawnmowers. And unfortunately, that’s not likely to change any time soon as we put the summer behind us.

The bottom line — as I’ve discussed before, when a stock’s dividend yield looks too good to be true, odds are it is just that. BGG is just the latest stock to prove that. While its newly revised dividend yield (4.1%) might still look enticing, it’s not one that we should be clamoring for given the lack of thematic tailwinds for its lawnmowing business. But at a minimum, no investor should consider the shares until there is some proof that management’s turnaround plan is on the cusp of delivering. 

Weekly Issue: Trade and geopolitical issues make for a less than sleepy August 2019

Weekly Issue: Trade and geopolitical issues make for a less than sleepy August 2019

Key points inside this issue

  • Trade and geopolitical issues make for a less than sleepy August 2019
  • What to watch this week
  • Earnings this week
  • Economic data this week
  • The Thematic Aristocrats?

Uncertainty continued to grip the stock market last week as the U.S.-Chinese trade dispute once again took center stage. After the return of tariff talk week prior, the battle expanded this week to include a war of words between Washington and Beijing over the Chinese yuan’s devaluation.

The market ultimately shook that off, in part due to the renewed thought that the Federal Reserve could accelerate interest-rate cuts. But then stocks closed lower week over week after President Trump suggested Friday that trade talks with China set for next week might be canceled.

There’s also renewed geopolitical uncertainty — not just Britain’s Brexit process, but also a looming no-confidence vote against Italian Prime Minister Giuseppe Conte that’s once again plunging Italy into political turmoil. And as if that wasn’t enough, over the weekend escalating tensions between Chinese authorities and protesters in Hong Kong were added to the mix, making for one big ball of uncertainty even bigger.

Meanwhile, global economic data continue to soften. This gives some credence to the notion that the Fed could become more dovish than Chairman Jerome Powell suggested during his July 31 press conference following the Federal Open Market Committee’s decision to cut rates. While I don’t expect anything near-term, down below we have a calendar date to mark even though I don’t think it will mean much in the way of monetary policy.

We’re seeing confirming signs for the economic data in oil and copper prices, both of which have been mostly declining of late. Not exactly signs of a vibrant and growing global economy.

Odds are that as we head into summer’s final weeks, stocks will be range-bound at best as they trade based on the latest geopolitical headlines. And odds are there won’t’ be any newfound hope to be had on the earnings front. With 90% of S&P 500 stocks already reporting second-quarter results, it looks like we’ll see another year-over-year decline in quarterly average earnings. For the full year 2019 those earnings are only growing at a 2.5% annual rate, but if President Trump goes forth with the latest round of announced tariffs, odds are those expectations could come down in the coming weeks – more on that below.

All in all, barring any meaningful progress on US-China trade, which seems rather unlikely in the near-term, at best the stock market is likely to be rangebound in the coming weeks. Even though much of Wall Street will be “at the beach” the next few weeks, odds are few will be enjoying their time away given the pins and needles discussed above and further below.

What to watch this week

We have three weeks until the Labor Day holiday weekend, which means we’re entering one of the market’s historically slowest times. There’s typically lower volume than usual, as well as low conviction and wishy-washy moves in the market.

Traditionally, a more-sobering look emerges once Wall Street is “back from the beach” following the Labor Day holiday. This tends to bring a sharper picture of the economy. There are also ample investor conferences where companies update their outlooks as we head into the year’s last few months.

But as we saw this past week, geopolitical and trade tensions could make the next few weeks much more volatile than we’ve seen in the past. As we navigate these waters, we’ll continue to assess what this means for earnings — particularly given that analysts don’t expect the S&P 500 companies to see year-over-year earnings-per- share growth again until the fourth quarter. In my view that puts a lot of hope on a seasonally strong quarter that could very well be dashed by President Trump’s potential next round of tariffs. I say this because retailers now face the 10% tariffs set to go into effect on September 1, which will hit apparel and footwear, among other consumer goods.

The risk is we could very well see 2019 turn into a year with little to no EPS growth for the S&P 500, and if factor out the impact of buybacks it likely means operating profit growth had at the S&P 500 is contracting year over year. We’ll know more on that in the coming weeks, but if it turns out to be the case I suspect it will lead many an investor to question the current market multiple of 17.6x let alone those market forecasters, like the ones at Goldman Sachs, that are calling for 3,100 even as their economists cut their GDP expectations.

Earnings this week

This week will have the slowest pace of earnings releases in about a month, with only some 330 companies issuing quarterly results. That’s a sharp drop from roughly 1,200 such reports that we got last week.

Among those firms reporting numbers next week, we’ll see a sector shift toward retail stocks, including Macy’s (M), J.C. Penney (JCP) and Walmart (WMT). Given what I touched on above, I’ll be listening for their comments on the potential tariff impact as well as comments surrounding our Digital Lifestyle and Middle-class Squeeze investing themes, and initial holiday shopping expectations.

This week’s earnings reports also bring the latest from Cisco Systems (CSCO), Nvidia (NVDA), and Deere (DE). Given how much of Deere’s customer base sells commodities like U.S. soybeans (which China has hit with tariffs), we’ll carefully listen to management’s comments on the trade war. There could be some tidbits for our New Global Middle-class theme from Deere as well. With Cisco, we could hear about the demand impact being generated by 5G network buildouts as well as the incremental cyber security needs that will be needed. These make the Cisco earnings conference call one to listen to for our Digital Infrastructure and Safety & Security investing themes.


Economic data this week

On the economic front, we’ll get July reports for retail sales, industrial production and housing starts, as well as the August Empire Manufacturing and Philly Fed surveys. Given the importance of the consumer, the July Retail Sales will be one to watch and I for one expect it to be very bullish for our Digital Lifestyle investing theme if and only if because of Amazon’ 2019 Prime Day and all the other retailers that tried to cash in on it. I suspect, however, the report will reveal more gloom for department stores. All in all the week’s economic data points will help solidify the current quarter’s gross domestic product expectations, which are sitting at 1.6%-1.9% between the New York and Atlanta Fed.

Based on what we’ve seen of late from IHS Markit for Japan, China and the Eurozone, that still makes America the best economic house on the block. Granted, the U.S. vector and velocity are still in the down and slowing positions, but we have yet to see formal signs of a contracting domestic economy. As Tematica’s Chief Macro Strategist Lenore Hawkins pointed out in her most recent assessment of things, we’ll need to keep tabs on the dollar for “The deflationary power of a strengthening US dollar strength in the midst of slowing global trade and trade wars just may overpower anything central banks try.”

Odds are that as the latest economic figures hit, especially if they keep the economy’s recent vector and velocity intact, we will see more speculation on what the Fed might do next. While there’s no Fed interest-rate meeting scheduled for August, the Kansas City Fed will hold its widely watched annual Jackson Hole symposium Aug. 22-24 in Wyoming. The central bank doesn’t usually discuss monetary-policy plans at this event, but as noted above, we aren’t exactly in normal times these days.


The Thematic Aristocrats?

Given the recent market turbulence as prospects for more of the same in the coming weeks, I’m sitting back and building our shopping list for thematically well-positioned companies. Given the economic data of late and geo-political uncertainties as well as Lenore’s comments on the dollar, I’m focusing more on domestic-focused, inelastic business models that tend to spit off cash and drive dividends. In particular, I’m looking at companies with a track record of increasing their dividends every year for at least 10 years. And of course, they have to have vibrant thematic tailwinds at their respective back.

Perhaps, we can informally call these the “Thematic Aristocrats”?

I’ll have more as I refine that list.

The market is going great so no need to worry, right?

The market is going great so no need to worry, right?


There are weeks when sitting down to write this piece is tough because not much worthy of note has happened in the markets or the economy outside of the usual noise. This week, that was most definitely not the case. Thank God it is Friday – we all need a break.


New Market Highs and the Economy Gets Uglier

Thursday the S&P 500 closed at a new all-time high and is now above its 50-day, 100-day and 200-day moving averages. The post Federal Reserve Open Market Committee meeting debrief gave the market essentially what it wanted, a significantly more dovish stance with plenty of reasons to believe future rate cuts are imminent. Perhaps the Marty Zweig adage, “Don’t fight the Fed,” has been flipped on its head to “Fed, don’t fight the markets.” Unemployment is at multi-decade lows with more job openings than unemployed persons, rising hourly earnings, and improving retail sales while the market hits all-time highs and yet the Fed is preparing to stimulate. Yeah, something’s off here.

Stocks may be partying like it is 1999 (for those who remember that far back) but the yield on the 10-year closed at 2.01% Thursday. To put that in context, on June 9th when the 10-year was down to 2.09%, the Wall Street Journal ran an article asserting that, “Almost nobody saw the nosedive in bond yields coming, but a few players were positioned well enough to profit. Some think there is more room for yields to fall further,” along with this chart. To be clear, despite not one respondent predicting the yield on the 10-year would fall below 2.5% in 2019, none of these economists are idiots, but the thing is they all tend to read from the same playbook.

The stock market is giddy over its expectations for lower rates, yet the spread between the 3-month and the 10-year Treasury has been inverted for four weeks as of this writing, not exactly a ringing endorsement for economic growth prospects. Every time this curve has been inverted for 4 consecutive weeks, it has been followed by a recession (hat tip @Saxena_Puru) for this chart. Note that the chart uses 10-year versus 1-year until the 3-month became available in 1982. Much of the mainstream financial media and fin twit believe this time is different. Time will tell.

The red arrows denote 4 consecutive weeks of inversion and the blue arrows mark bear-market lows (20% declines).

Then there is this, with a hat tip to Sven Henrich whose tweet with a chart from Fed went viral – that in and of itself says a lot.

Both US imports and exports have declined from double-digit growth in 3Q 2018 to essentially flat today. The recent CFO Outlook by Duke’s Fuqua School of Business found that optimism about the US and about their own companies amongst CFO’s had fallen from the prior year.

The shipments of goods being moved around the country have plummeted since the beginning of 2018, as shown by the Cass Freight Index.

The Morgan Stanley Business Conditions Index fell 32 points in June, the largest one-month decline in its history.

If all that doesn’t have your attention, consider that the New York Fed’s recession probability model puts the probability that we are in a recession by May 2020 at 30%. Note that going back to 1961, whenever the probability has risen to this level we have either already been in a recession or shortly entered one with the exception of 1967 – 7 out of 8 times.

But hey, the market is going great so no need to worry right? If that’s what you are thinking, skip this next chart from @OddStats.


Geopolitics – From Bad to Oh No, No No

Brinksmanship with Iran continues as in the early hours of Friday we learned that the US planned a military strike against Iran in response to the shooting down of an American reconnaissance drone. The mission was called off at the last minute after the President learned that an estimated 150 people would likely have been killed. Frankly, the official story sounds a bit off, but what we do know is that we are in dangerous territory and one can only hope that some cooler heads prevail, and the situation gets dialed back a whole heck of a lot.

Given we weren’t enjoying enough nail-biting out of the Middle East news, an independent United Nations human rights expert investigating the killing of Saudi journalist Jamal Khashoggi is in a 101-page report recommending an investigation into the possible role of the Saudi Crown Prince Mohammed bin Salam citing “credible evidence,” and while not specifically assigning blame to bin Salam, did assign responsibility to the Saudi government. This week the US Senate voted to block arms sales to Saudi Arabia, rebuking the President’s decision to use an emergency declaration to move the deal forward. This matters when it comes to investing because there are some seriously high-stakes games being played out that have the potential to suddenly rock markets without any warning.

Over in Europe more and more data points pointing to a slowing economy, which led to European Central Bank President Mario Draghi to announce that more stimulus could be in the works if inflation fails to accelerate. At the ECB’s annual conference in Sintra, Portugal Draghi stated that, “In the absence of improvement, such that the sustained return of inflation to our aim is threatened, additional stimulus will be required.” It isn’t just inflation that is troubling the region. Euro Area Industrial Production (ex Construction) has only seen increases in 2 of the last 11 months.

Italy continues to struggle with its budget deficit outside the limits allowed by the European Union, leading to a battle between Rome and Brussels. Friday Deputy Prime Minister Matteo Salvini (head of the euro-skeptic Lega party) threatened to quit his position if he is not able to push through tax cuts for at least €10 billion. While the US has been laser-focused on the Fed (and the president’s tweets) the Italian situation is getting more tense and a time when UK leadership with respect to Brexit is also getting a lot more tense. To put the Italian problem in perspective and understand why this problem is not going away, look at the chart below.

Today, Italy’s per capita GDP is 2.8% BELOW where it was in 2000 while Germany is 24.8% higher. Even the beleaguered Greece has outperformed Italy. Italy’s debt level is material to the rest of the world, its economy is material to the European Union, its citizens are losing their patience and its leadership consists of a tenuous partnership between a far-right, fascist-leaning Lega and a far-left, communist(ish) 5 Star movement lead by folks that very few in the nation respect. So that’s going well.

As if the European Union didn’t have enough to worry about as its new parliament struggles to find any sort of direction or agreement on leadership, the parliamentary process for selecting the next Prime Minister of the UK is down to two finalists. Enthusiam is rampant.

A hard Brexit is looking more likely and that is not going to be smooth sailing for anyone.


The Bottom Line

All this is a lot to take in, but there is a bright light for the week. Anna Wintour, Vogue’s editor-in-chief and eternal trend-setter, has given flip-flops her seal of approval. So, we’ve got that going for us. If that didn’t put a little spring into your step, I suggest you check out this twitter feed from Paul Bronks. Your soon-to-be more swimsuit ready abs will thank me, but your neighbors will wonder what the hell is going on at your place.

WEEKLY ISSUE: Companies continue to serve up weaker guidance

WEEKLY ISSUE: Companies continue to serve up weaker guidance

Key points inside this issue

  • The outlook for earnings continues to wane even as the trade-related market melt-up continues.
  • Our price target on Amazon (AMZN) shares remains $2,250.
  • Our price target on Alphabet (GOOGL) shares remains$1,300.
  • Our price target on Costco Wholesale (COST) shares remains $250.
  • Our price target on Universal Display (OLED) shares remains $125.
  • Our price target on Nokia (NOK) shares remains $8.50


The outlook for earnings continues to wane even as the trade-related market melt-up continues

Domestic stocks continued to trend higher last week as the December-quarter issues that plagued them continued to be dialed back. Said another way, the expected concerns — the Fed, the economy, the government shutdown, geopolitical issues in the eurozone, and U.S.-China trade talks — haven’t been as bad as feared a few months ago.

In recent weeks, we have seen the Fed take a more dovish approach and last week’s data, which included benign inflation numbers and fresh concerns over the speed of the economy following the headline December Retail Sales Report and Friday’s manufacturing-led contraction in the January Industrial Production Index, reaffirm the central bank is likely to stand pat on interest rate hikes. We see both of those reports, however, feeding worries over increasing debt-laden consumers and a slowing U.S. economy. 

Granted, economic data from around the globe suggest the U.S. economy remains one of the more vibrant ones on a relative basis, which also helps explain both the melt-up in both the domestic stock market as well as the dollar. On Thursday we learned that economic growth in the eurozone was basically flat on a sequential basis in the December quarter, rising a meager 0.2%. Year-over-year growth stood at just 1.2% for the final quarter of 2018. This came after news that the eurozone economic powerhouse that is Germany had no growth itself in the fourth quarter after a contraction of 0.2% in the third quarter. Italy experienced its second consecutive quarter of economic contraction, putting it in a technical recession.


All of this put further downward pressure on the euro versus the U.S. dollar, which means dollar headwinds remain for multinational companies. And we still have another major headwind that is the lack of any Brexit deal. With three pro-EU Conservatives having resigned this morning from Prime Minister Theresa May’s party to join a new group in Parliament, there is no an even slimmer chance of Brexit deal being put in place ahead of next week.

So, what has been fueling the rebound in the stock market?

Among other factors, the deal to avoid another federal government shutdown, which was followed by the “national emergency” declaration that will potentially give President Trump access to roughly $8 billion to fund a border wall. We’ll see how this all plays out in the coming days, alongside the next step in U.S.-China trade talks that are being held this week in Washington. While “much work remains” on the working Memorandum of Understanding, trade discussions last week focused on several of the larger structural issues that we’ve been more concerned about — forced technology transfer, intellectual property rights, cyber theft, and currency.

Early this morning, it’s being reported that President Trump is softening on the March 1 phase in date for the next round of tariff increases, which is likely to give the market some additional trade optimism and see it move higher. We remain hopeful, but we expect there to be several additional steps to go that will set the stage for any final agreement that will likely be consummated at a meeting between Presidents Trump and Xi. And yes, the final details will matter and will determine if we get a “buy the rumor, sell the news” event.

Even as the trade war continues at least for now, we continue to see companies positioning themselves for the tailwinds associated with Living the Life and New Global Middle-class investing theme opportunities to be had in China. If you missed a recent Thematic Signal discussing how Hilton (HLT) is doing just that, you can find it here.

And then there are earnings

Over the last several weeks, we’ve been tracking and sharing the declining outlook for S&P 500 earnings for 2019. As we closed last week, roughly 80% of the S&P 500 companies had reported their quarterly earnings and issued outlooks. In aggregating the data, the new consensus calls for a 2.2% year-over-year decline in earnings for the current quarter, low single-digit earnings growth in the June and September quarters, and 9.1% growth in the December quarter. In full, the S&P 500 group of companies are now expected to grow their collective 2019 EPS by 5% to $169.53, which means that as those expectations have fallen over the last several months, the 2019 move in the market has made the stock market that much more expensive.

In my view, we are once again seeing a potentially optimistic perspective on earnings for the second half of the year. While a U.S.-China trade deal and infrastructure spending bill could very well lead to a better second half of 2019 from an earnings perspective, the unknown remains the vector and velocity of the rest of the global economy.  As discussed above, the US is looking like the best house on the economic block, but as I share below there are valid reasons to think that it too continues to slow.


Last week I touched on a Thematic Signal about the record level of auto loan delinquencies, and in the last few days, we’ve learned that student-loan delinquencies surged last year, hitting consecutive records of $166.3 billion in the September 2018 quarter and $166.4 billion in the December 2018 one. I’ve also noticed an uptick in credit-card delinquencies this past January as companies ranging from American Express (AXP) to JPMorgan (JPM) and other credit card issuers reported their monthly data. What I find really concerning is this record level of delinquencies is occurring even as the unemployment rate remains at multi-year lows, which suggests more consumers are seeing their disposable income pressured. While this isn’t a good sign for a consumer-led economy, it certainly confirms the tailwind associated with our Middle-class Squeeze investing theme.


Tematica Investing

 December Retail Sales shock some, confirm Costco and others

December Retail Sales have been published by the Commerce Department and to say the results were different than most were expecting is an understatement. And that’s even for those of us that were watching data of the kind I mentioned above.  Normally, holiday shopping tends to build as we close out the year, but according to the report, consumers pulled back in December as monthly retail sales fell 1.3% compared to November.

Yes, you read that right – they fell month over month, but as we know that is only one way to read the data. And while sequential comparisons are helpful, they do little to help us track year over year growth. From that perspective, retail sales in December 2018 rose 2.1% year over year with stronger gains registered at Clothing & Clothing Accessories Stores (+4.7%), Food Services & Drinking Places (+4.0%), Nonstore retailers (+3.7%) and Auto & other motor vehicles (+3.4%). That’s not to say there weren’t some sore spots in the report – there were, but there are also the ones that have been taking lumps for most of 2018. Sporting goods, hobby, musical instrument, & book stores fell 13% year over year in December, bringing the December quarter drop to 11% overall. Department Stores also took it on the chin in December as their retail sales fell 2.8% year over year. These declines are largely due to the accelerating shopping shift to digital from brick & mortar that are associated with our Digital Lifestyle investing theme.

Despite the headline weakness, I once again see the report as confirming for Thematic King Amazon (AMZN) and to a lesser extent Select List resident Alphabet (GOOGL) given its Google shopping engine. Not only is Amazon benefiting from the accelerating shift to digital commerce, but also from its own private label efforts, which span basic electronic accessories to furniture and apparel. It goes without saying that comparing the December Retail Sales report with Costco Wholesale’s (COST) monthly same-store sales reports shows Costco continues to win consumer wallet share.


As a reminder, Costco’s December same-store sales rose 7.5% in December (7.1% excluding gasoline prices and foreign exchange) and 6.6% in January (7.3%). And it remains on path opening new warehouse locations with 768 exiting January, up 3.0% year over year. That should continue to spur the company’s high margin membership fee income in the coming quarters. My suspicion is others are catching onto this given the 7% increase in COST shares thus far in 2019, the vast majority of which has come in the last week. We’ll continue to hold ‘em.

  • Our price target on Amazon (AMZN) shares remains $2,250.
  • Our price target on Alphabet (GOOGL) shares remains $1,300.
  • Our price target on Costco Wholesale (COST) shares remains $250.


Turning to this week’s data

This week’s shortened trading week brings several additional key pieces of economic data. And following the disappointing December Retail Sales report, these reports are bound to be closely scrutinized as the investment community looks to home in on the speed of the domestic economy. 

In addition to weekly mortgage applications, and oil and natural gas inventory data, tomorrow we’ll also get the December Durable Orders report and January Existing Home sales data. Given the drop-off in mortgage applications of late as well as weather issues, it’s hard to imagine a dramatic pick-up in the housing data since the end of 2018. Rounding out the economic data will be our first February look at the economy with the Philly Fed Index.

 Speaking of the Fed, today we’ll see the release of the Fed’s FOMC minutes from its January meeting. Considering the comments emanating from Fed heads lately as well as the lack of inflation in the January CPI and PPI data, there should be few surprises in terms of potential interest rate hikes in the near term. The looming question is the speed at which the Fed will normalize its balance sheet, which likely means that will be an area of focus as investors parse those minutes.


Here come Universal Display and Mobile World Congress 2019

As long as we’re looking at calendars, after Thursday’s market close Select List resident Universal Display (OLED) will report its quarterly results. To say the shares have found some legs in 2019 would be a bit of an understatement given their resurgence over the last several weeks.


We know Digital Lifestyle Select List company Apple (AAPL) has shared its plans to convert all of its iPhone models to organic light emitting diode displays by 2020, and that keeps us in the long-term game with OLED shares. Given the current tone of the smartphone market, however, we could see Universal Display serve up softer than expected guidance.

We’ll continue to hold OLED shares for the duration and look for signs that other device companies, including other smartphone vendors but other devices as well, are making the shift to organic light emitting diodes next week during Mobile World Congress 2019 (Feb. 25-28). The event is a premier one mobile industry as it tends to showcase new devices and technologies, and as you might imagine means a number of announcements. This means it’s not only one to watch for organic light emitting diode adoptions, but we are also likely to see much news on 5G virtual reality and augmented reality, key aspects of our Disruptive Innovators investing theme, as well. And with 5G in mind, we could very well hear of more 5G network launches as well, which means keeping my Nokia (NOK) and Digital Infrastructure ears open as well as my Digital Lifestyle ones.

  • Our price target on Universal Display (OLED) shares remains $125.
  • Our price target on Nokia (NOK) shares remains $8.50.


Weekly Issue December 17 2018

Weekly Issue December 17 2018

Key points inside this issue:

  • The Duke University/CFO Global Business Outlook survey surprises the market
  • Costco stumbles, but it is far from down and out
  • Thematic confirmation had in the November Retail Sales Report
  • Digging into Friday’s other economic reports
  • What to watch this week
  • Holiday Housekeeping

The Duke University/CFO Global Business Outlook survey surprises the market

What looked to be shaping up as a positive week for the stock market turned on its head Friday following renewed concerns over the pace of the global economy. As we’ve talked about recently, the vector and velocity of the latest economic reports suggest a slowing economy and that is fueling questions over the top and bottom-line growth prospects for 2019.

Tossing some logs on the that fire late last week was the new survey findings from the Duke University/CFO Global Business Outlook survey that showed almost half (48.6%) of US chief financial officers believe the United States will be in recession by the end of next year while 82% of CFOs surveyed believe that a recession will begin by the end of 2020. That’s quite different than the Wall Street consensus, which per The Wall Street Journal’s Economic Forecasting Survey sees the speed of the economy slowing from 3.5% in the September 2018 quarter to 2.5% in the current one to 2.4% in the first half of 2019 followed by 2.2% in the back half of the year.

This revelation has added to the list of concerns that I’ve been discussing of late and adds to the growing worries over EPS growth prospects in 2019.


Costco stumbles, but it is far from out

Last Thursday night, Costco Wholesale (COST), our Middle-Class Squeeze Thematic Leader, reported an EPS beat by $0.05 per share for the quarter, but revenue came in a tad short at up 10.3% year over year, or $34.3 billion vs. the expected $34.66 billion. Same-store sales for the quarter rose 8.8% (+7.5% ex-gasoline and currency), which is well above anything we’ve seen for the September-November period per Friday’s November Retail Sales report save for digital shopping (Non-store retailers) and gas station sales – more on that shortly.

Despite the positive EPS, COST shares fell 8.6% on Friday.

The issue with Costco was the margin profile as reported operating income was essentially flat year over year. When combined with the top line increase vs. the year-ago quarter it means the company’s operating margin hit 2.7% vs. 3.0% in the year-ago quarter, and 3.2% this past August quarter. Part of the issue was the jump up in pre-opening expenses for new warehouse locations which rose by 6% quarter over quarter. The real culprit was the step up in merchandising costs, which climbed 10.8% year over year for the November quarter vs. 5.4% year over year in the September quarter. Clearly, Costco is seeing the impact of not only higher prices but also the impact of tariffs associated with the U.S.-China trade war.

Despite that, the core basics at the company – foot traffic, renewal rates, and membership growth – continue to fire on all cylinders. That to me makes Costco one of the best-positioned retailers, and the fact that its e-commerce business continues to blossom is positive as well. In all of 2019, Costco looks to open 20-23 net new warehouses, which equates to an increase of 2.5%-3.0% year over year. This will likely drive pre-opening expenses higher in the coming months, but given the favorable metrics associated with each new location over the medium to longer-term, we’ll take it, especially if the economy slows more than expected. Odds are that will drive more consumers to Costco than not.

  • Our long-term price target on Costco Wholesale (COST) shares remains $250.


Thematic confirmation in the November Retail Sales Report

Looking over Friday’s November Retail Sales Report, core Retail Sales rose 4.0% year over year with strong performance as expected for Non-store Retailers (+10.8% year over year), Gasoline Stations (+8.2%) and Food Service & Drinking Places (+5.6%). To me, those first and third categories ring positive for our Digital Lifestyle and Living the Life investing themes. That means I see those as positive signs for our thematic and holiday shopping positioned companies, which includes the aforementioned Costco, but also Amazon (AMZN), United Parcel Service (UPS), McCormick & Co. (MKC), International Flavors & Fragrances (IFF) and Del Frisco’s Restaurant Group (DFRG).

Back to the November Retail Sales report, while the sequential overall retail comparisons came in either as expected or slightly better depending on the forecast one is looking at, what’s likely to catch the market’s attention is the sequential drop in year over year retail sales growth that was had in November. Again, year over year November retail sales growth rose 4.0%, which was down compared to the October year over year increase of 4.5%.

Given the growing amount of data that points to a slowing domestic economy, one that is driven meaningfully by the consumer, odds are market watchers will not love what they saw in those year over year comparisons. Add to it that a recent Gallup poll found that Americans plan to spend less on holiday gifts today than they expected back in October and less than they expected to spend in 2017. The $91 decline in expected spending since October is “one of the steeper mid-season declines, exceeded only by a $185 drop that occurred in 2008, as the Wall Street financial crisis was unfolding, and a $102 drop in 2009 during the 2007-2009 recession.”

Clearly, those latest data points weighed on the overall stock market last week, but those weren’t the only ones.


Digging into Friday’s other economic reports

The November Retail Sales report wasn’t the only set of key data that weighed on the market last Friday. The November Industrial Production Report showed a flat manufacturing economy following the modest dip in October. On the December Flash PMI reports, the U.S. hit a 19-month low for the month with softer new order growth, while “Lower oil-related costs contributed to the slowest rate of input price inflation since the start of the year.” Turning to the eurozone, its Composite Output PMI hit 51.3, down from 52.7 in November, and reached a four-year low. The Flash Manufacturing PMI data for Japan was better, as it rose to 52.4 for December up from 52.2 in November, but that is hardly what we would call a robust figure given the expansion/contraction line at the 50.0 level. While new orders activity improved in Japan, new export orders fell, signaling a change of direction, which supports the notion of a slowing global economy.

This data along with the back and forth on U.S.-China trade, Brexit developments, Italy budget concerns, protests in France, and the potential government shutdown have all raised investor uncertainty levels. We see this in the current “Extreme Fear” (9) reading on the CNN Business Fear & Greed Index, which is little changed over the last few weeks. We’ve seen this play out in the stock market as the number of stocks hitting new highs pales in comparison to hitting 52-week lows. As one likely suspects, we saw this play out in small cap stocks, which per the Russell 2000 last week, were once again the hardest hit of the major stock categories. Quarter to date, small cap stocks are down just under 17% quarter to date.

We saw a number of these concerns brewing as we exited September and entered the September- quarter earnings season. We have been careful in making additions to the Select List given what I’ve viewed as an environment that has been more skewed to risk than reward. Odds are that will continue to be the case between now and the end of the year, which means we will continue to be overly selective when it comes to deploying capital. For that reason, last week we added the ProShares Short S&P 500 ETF (SH) shares to our holdings to add some downside protection.


What to Watch This Week

Following last week’s rash of economic data, don’t ask me how or why but the Atlanta Fed saw fit to boost its GDP Now forecast for the current quarter to 3.0% from 2.4% last week. As subscribers know, I prefer the far more solid track record at the NY Fed and its Nowcast report, which now calls for the current quarter to be +2.4%, down from +2.44% last week. That’s in line with The Wall Street Journal’s Economic Forecasting Survey, but again that Duke poll is likely to be in the forefront of investor minds this week as more data is had. This includes several pieces of housing data — the November Housing Starts & Building Permits as well as November Existing Home Sales and the October NAHB Housing Market Index — as well as the November Durable Orders Report and November Personal Income & Spending data.

As I mentioned above, the number of economic numbers suggesting the global economy continues to slow are growing, which likely gives the Fed far more room to issue dovish comments after next week’s all but done December rate hike. In recent weeks as the Fed has once again signaled it will more than likely remain data dependent in 2019, we’ve seen a change in the futures market, which is now pricing in less than 20 basis points of rate hikes next year versus over 55 basis points just a few months ago. But we have to consider the reason behind this slower pace of rate hikes, which is the suggestion by recent data that the economy is far from overheating, which also adds to the core question we suspect investors and the market are asking: how fast/strong will EPS growth be in 2019?

As we prepare for Fed Chair Powell’s remarks, it’s not lost on me that we could very well see a “buy the rumor, sell the news” event following the FOMC meeting next week.

Heading down the final stretch of 2018, I’ll be looking at well-positioned companies relative to our investment themes that have been hard hit by the quarter to date move in the market. As of Friday’s market close, the S&P 500 was down X% quarter to date, while the tech-heavy Nasdaq Composite Index and the small-cap heavy Russell 2000 were down 14% and nearly 17%, respectively, on that basis. One of the criteria that I’ll be focusing on as I weed through this growing list of contenders is favorable EPS growth year over year relative to the S&P 500. And, yes, when I say that I do mean to “real” EPS growth due to rising profit margins and expanding dollar profits instead of those lifted largely by buyback activities.

With that in mind, I’ll be paying close attention to a number of key earnings reports coming at us next week. These include Nike (NKE), Carmax (KMX), ConAgra (CAG), General Mills (GIS), Micron (MU), FedEx (FDX) and Darden Restaurants (DRI). Inside these reports and company commentaries, I’ll be looking for data points that to confirm our investment themes, the question of inflation vs. deflation and where it may be, and a last-minute update from FedEx on digital commerce for this holiday shopping season that we are all in the thick of. Also, among those reports is Del Frisco’s competitor – The Capital Grill, which is owned by Darden. I’ll be paying extra close attention to that report and what it means for our DFRG shares.


Holiday Housekeeping!

And that brings us to our Housekeeping note, which is this – given the way the Christmas and New Year’s holidays fall this year, barring any unforeseen issues that will require our attention and immediate action, we here at Tematica will be in “get ready for 2019” mode. That means we’ll be using the quiet holiday time to review the Thematic Leaders as well as positions on the Select List to ensure we are well prepared for the coming months ahead.

As such, we’re likely to be back the week of January 7th, although I can’t rule out the urge to share some thoughts with you sooner. For example, if the Fed says something that rolls the stock market’s eyes later this week, I’ll be sure to weigh in and share my thoughts. The same goes for the Darden earnings report I mentioned above and what it may mean for our DFRG shares.

We will have a new podcast episode or two before then, and we will be sharing a number of Thematic Signals over the coming weeks – if only those confirming signs for our investment themes would take a break. I’m only kidding, but of course, I love how recognizable and relatable the themes are in and around our daily lives.

To you and your loved ones, Merry Christmas, Happy Holidays, and Happy New Year! See you 2019!!


Weekly Issue: Among the Volatility, We See Several Thematic Confirming Data Points

Weekly Issue: Among the Volatility, We See Several Thematic Confirming Data Points

Key points inside this issue:

  • As expected, news of the day is the driver behind the stock market swings
  • Data points inside the September Retail Sales Report keep us thematically bullish on the shares of Amazon (AMZN), United Parcel Service (UPS) and Costco Wholesale. Our price targets remain $$2,250, $130 and $250, respectively.
  • We use the recent pullback to scale further into our Del Frisco’s Restaurant Group (DFRG) shares at better prices, our price target remains $14.
  • Netflix crushes subscriber growth in the September quarter; Our price target on Netflix (NFLX) shares remains $500.
  • September quarter earnings from Ericsson (ERIC) and Taiwan Semiconductor (TSM) paint a favorable picture from upcoming reports from Nokia (NOK) and AXT Inc. Our price targets on Nokia and AXT shares remain $8.50 and $11, respectively.
  • Walmart embraces our Digital Innovators investment theme
  • Programming note: Much commentary in this week’s issue centers on the September Retail Sales Report. On this week’s Cocktail Investing podcast, we do a deep dive on that report from a thematic perspective. 


As expected, news of the day is the driver behind the stock market swings

If there is one thing we can say about the domestic stock market over the last week, it remains volatile. While there are other words that one might use to describe the down, up, down move over the last week, but volatile is probably the most fitting. Last week I shared the market would likely trade based on the data of the day — economic, earnings or political — and that seems to have been the case. While we’ve received several solid earnings reports, including one from Thematic Leader Netflix (NFLX), several banks and even a few airlines, the headline economic data came up soft for September Retail Sales and Housing.

And then there was yesterday’s FOMC minutes from the Fed’s September monetary policy meeting, which showed that even though the Fed expects to remain on its tightening path, subject to the data to be had, several members of the committee see “a period where the Fed even will need to go beyond normalization of rates and into a more restrictive stance.”

Odds are we can expect further tweets from President Trump on this given his prior comments that the Fed is one of his greatest risks. I also expect this to reignite concerns for the current expansion, particularly since the Fed has historically done a good job hiking interest rates into a recession. From a thematic perspective, continued rate hikes by the Fed is likely to put some added pressure on Middle-Class Squeeze consumers. Before you freak out, let’s check the data. The economy is still growing, adding jobs, benefiting from lower taxes and regulation. It’s not about to fall off a cliff in the near term, but yes, the longer the current expansion goes, the greater the risk of something more than just a slower economy. More reasons to keep watching the monthly data.

Here’s the good news, inside that data and elsewhere we continue to receive confirming signals for our 10 investing themes as well as favorable data points for the Thematic Leaders and other positions on the Tematica Investing Select List.


Several positives in the September Retail Sales report for AMZN, UPS & COST

Cocktail Investing Podcast September Retail Sales Report

With the consumer directly or indirectly accounting for nearly two-thirds of the domestic economy and the average consumer spending 31% of his or her paycheck on retails goods, this monthly report is one worth monitoring closely.

Let’s take a closer look at this week’s September 2018 Retail Sales report. First, let’s talk about the headline miss that was making the rounds yesterday. Yes, the month over month comparison Total Retail & Food Services excluding motor vehicles & parts fell 0.1%, but Retail rose 0.4% on the same basis. The thing is, most tend to focus on those sequential comparisons, but as investors, we examine year over year comparisons when it comes to measuring revenue, profit and EPS growth. On that basis, Total Retail & Food Services rose 5.7% year over year while Retail climbed 4.4% compared to September 2017. That sounds pretty solid if you ask me. Now, let’s dig into the meat of the report and what it means for several of our thematic holdings.

Right off the bat, we can’t ignore the 11.4% year over year increase in gas station sales during September, which capped off a 17.2% increase for the September 2018 quarter. With such an increase owing to the rise in oil and gas prices, we would expect to see weakness in several of the retail sales categories as the cost of filling up the car saps spending at the margin and confirms our Middle-Class Squeeze investing theme. And we saw just that. Department stores once again fell in September vs. year ago levels as did Sporting goods, hobby, musical instrument, & bookstores. Given recent construction as well as housing starts data, the Building material & garden eq. & supplies dealer category posted slower year over year growth, which was hardly surprising.

Other than gas station sales, the other big gainer was Nonstore retailers – Census Bureau speak for e-tailers and digital commerce that are part of Digital Lifestyle investing theme,  which saw an 11.4% increase in September retail sales vs. year ago levels. That strong level clearly confirms our investment thesis that digital shopping continues to take consumer wallet share, which bodes well for our Amazon (AMZN), United Parcel Service (UPS), and to a lesser extent our Costco Wholesale (COST). With consumers feeling the pressure of our Middle-Class Squeeze investing theme, I continue to see them embracing the Digital Lifestyle to ferret out deals and bargains to stretch their after-tax spending dollars, especially as we head into the holiday shopping season.

Sticking with Costco, the company recently reported its U.S. same-store-sales grew 7.7% for September excluding fuel and currency. Further evidence that Costco also continues to gain consumer wallet share compared to retail and food sales establishments as well as the General Merchandise Store category.

  • Data points inside the September Retail Sales Report keep us thematically bullish on the shares of Amazon (AMZN), United Parcel Service (UPS) and Costco Wholesale. Our price targets remain $2,250, $130 and $250, respectively.


Scaling deeper into Del Frisco’s shares

Now let’s dig into the report as it relates to Del Frisco Restaurant Group, our Thematic Leader for the Living the Life investing theme. Per the Census Bureau, retail sales at food services & drinking places rose 7.1% year over year in September, which brought its year-over-year comparison for the September quarter to 8.8%. Clearly, consumers are spending more at restaurants, than eating at home. Paired with beef price deflation that has been confirmed by Darden Restaurants (DRI), this bodes well for profit growth at Del Frisco.

Against those data points, I’m using the blended 12.5% drop in DFRG shares since we added them to our holdings to improve our costs basis.

  • We are using the recent pullback to scale further into our Del Frisco’s Restaurant Group (DFRG) shares at better prices, our price target remains $14.


Netflix crushes subscriber growth in the September quarter

Tuesday night Netflix (NFLX) delivered a crushing blow to skeptics as it served up an EPS and net subscriber adds beat that blew away expectations and guided December quarter net subscriber adds above Wall Street’s forecast. This led NFLX shares to pop rather nicely, which was followed by a number of Wall Street firms reiterating their Buy ratings and price targets.

Were there some investors that were somewhat unhappy with the continued investment spend on content? Yes, and I suppose there always will be, but as we are seeing its that content that is driving subscriber growth and in order to drive net new adds outside the US, Netflix will continue to invest in content. As we saw in the company’s September quarter results, year to date international net subscriber adds is 276% ahead of those in the US. Not surprising, given the service’s launch in international markets over the last several quarters and corresponding content ramp for those markets.

Where the content spending becomes an issue is when its subscriber growth flatlines, which will likely to happen at some point, but for now, the company has more runway to go. I say that because the content spend so far in 2018 is lining its pipeline for 2019 and beyond. With its international paid customer base totaling 73.5 million users, viewed against the global non-US population, it has a way to go before it approaches the 45% penetration rate it has among US households.  This very much keeps Netflix as the Thematic Leader for our Digital Lifestyle investing theme.

One other thing, as part of this earnings report Netflix said it plans to move away from reporting how many subscribers had signed up for free trials during the quarter and focus on paid subscriber growth. I have to say I am in favor of this. It’s the paying subscribers that matter and will be the key to the stock until the day comes when Netflix embraces advertising revenue. I’m not saying it will, but that would be when “free” matters. For now, it’s all about subscriber growth, retention, and any new price increases.

That said, I am closely watching all the new streaming services that are coming to market. Two of the risks I see are a recreation of the cable TV experience and the creep higher in streaming bill totals that wipe out any cord-cutting savings. Longer-term I do see consolidation among this disparate services playing out repeating what we saw in the internet space following the dot.com bubble burst.

  • Our price target on Netflix (NFLX) shares remains $500.


What earnings from Ericsson and Taiwan Semiconductor mean for Nokia and AXT

This morning mobile infrastructure company Ericsson (ERIC) and Taiwan Semiconductor (TSM) did what they said was positive for our shares of Nokia (NOK) and AXT Inc. (AXTI).

In its earnings comments, Ericsson shared that mobile operators around the globe are preparing for 5G network launches as evidenced by the high level of field trials that are expected to last at such levels over the next 12-18 months. Ericsson also noted that North America continues to lead the way in terms of network launches, which confirms the rough timetable laid out by AT&T (T), Verizon (VZ) and even T-Mobile USA (TMUS) with China undergoing large 5G field trials as well. In sum, Ericsson described the 5G momentum as strong, which helped drive the company’s first quarter of organic growth since 3Q 2014. That’s an inflection point folks, especially since the rollout of these mobile technologies span years, not quarters.

Turning to Taiwan Semiconductor, the company delivered a top and bottom line beat relative to expectations. Its reported revenue rose just shy of 12% quarter over quarter (3.3% year over year) led by a 24% increase in Communication chip demand followed by a 6% increase in Industrial/Standard chips. In our view, this confirms the strong ramp associated with Apple’s (AAPL) new iPhone models as well as the number of other new smartphone models and connected devices slated to hit shelves in the back half of 2018. From a guidance perspective, TSM is forecasting December quarter revenue of $9.35-$9.45 billion is well below the consensus expectation of $9.8 billion, but before we rush to judgement, we need to understand how the company is accounting for currency vs. slowing demand. Given the seasonal March quarter slowdown for smartphone demand vs. the December quarter and the lead time for chips for those and other devices, we’d rather not rush to judgement until we have more pieces of data to round out the picture.

In sum, the above comments set up what should be positive September quarter earnings from Nokia and AXT in the coming days. Nokia will issue its quarterly results on Oct. 25, while AXT will do the same on Oct. 31. There will be other companies whose results as well as their revised guidance and reasons for those changes will be important signs posts for these two as well as our other holdings. As those data points hit, we’ll be sure to absorb that information and position ourselves accordingly.

  • September quarter earnings from Ericsson (ERIC) and Taiwan Semiconductor (TSM) paint a favorable picture from upcoming reports from Nokia (NOK) and AXT Inc. Our price targets on Nokia and AXT shares remain $8.50 and $11, respectively.


Walmart embraces our Digital Innovators investment theme

Yesterday Walmart (WMT) held its annual Investor Conference and while much was discussed, one of the things that jumped out to me was how the company is transforming  itself to operate in the “dynamic, omni-channel retail world of the future.” What the company is doing to reposition itself is embracing a number of aspects of our Disruptive Innovators investing theme, including artificial intelligence, robotics, inventory scanners, automated unloading in the store receiving dock, and digital price tags.

As it does this, Walmart is also making a number of nip and tuck acquisitions to improve its footing with consumers that span our Middle-Class Squeeze and in some instances our Living the Life investing theme as well our Digital Lifestyle one.  Recent acquisitions include lingerie company Bare Essentials and plus-sized clothing startup Eloquii. Other acquisitions over the last few quarters have been e-commerce platform Shoebuy, outdoor apparel retailer Moosejaw, women’s wear site Modcloth, direct-to-consumer premium menswear brand Bonobos, and last-mile delivery startup Parcel in September.

If you’re thinking that these moves sound very similar to ones that Amazon (AMZN) has made over the years, I would quickly agree. The question percolating in my brain is how does this technology spending stack up against expectations and did management boost its IT spending forecast for the coming year? As that answer becomes clear, I’ll have some decisions to make about WMT shares and if we should be buyers as we move into the holiday shopping season.


Adding more Del Frisco’s to our plate following several bullish data points

Adding more Del Frisco’s to our plate following several bullish data points

Key points inside this issue

  • We are scaling into shares of Del Frisco’s Restaurant Group (DFRG) following several bullish data points from last week. Our price target for DFRG shares remains $14.
  • Our price target on Amazon (AMZN) remains $2,250
  • Our price target on United Parcel Service (UPS) shares remains $130
  • Our price target on Chipotle Mexican Grill (CMG) shares remains $550
  • Our price target on Costco Wholesale (COST) remains $250
  • I am reviewing our current price target of $130 for shares of McCormick & Co.
  • Last week’s podcast – Lithium Ion Batteries: The Enabler of the Digital Lifestyle
  • Last week’s Thematic Signals

Last Friday we received a number of positive data points for restaurant spending, which coupled with the latest US Department of Agriculture report on falling beef prices has me using the recent weakness in our Del Frisco’s Restaurant Group (DFRG) shares to improve our cost basis. Since adding DFRG shares to the portfolio, they’ve fallen nearly 10% since the end of August and just over 3% since we added them to our holdings despite favorable economic and industry reports. Part of that downward pressure came from Stephens throwing in the towel on its bullish stance on the shares last Wednesday. It would appear that Stephens jumped the gun given the favorable data that emerged later in the week.

Let’s review all of those data points…


August Retail Sales

The August Retail Sales report saw its headline figure come in at +0.1% month over month missing expectations of +0.4% and marked the slowest gain since February suggesting persistently high gas prices could be taking a bite out of consumer spending. With prospects for higher gas prices ahead following last week’s greater than expected crude inventory drawdown reported by the Department of Energy and the greater than expected jump in Total Consumer Credit for January, it would appear that Middle-Class Squeeze consumers slowed their spending in August vs. July. Hat tip to Tematica’s Chief Macro Strategist, Lenore Hawkins, and her coverage of those data points in last Friday’s Weekly Wrap. If I’m reading it, so should you.

Turning to the year over year view, August retail sales rose 6.2%, led by a more than 20% increase in gas station sales due to the aforementioned gas prices, and continued gains in Nonstore retailers (+10.4%) and food services & drinking places (+10.1%). Over the last three months, these last two categories are up 9.9% and 9.5% year over year, even as gas station sales are up nearly 21% by comparison. Those figures bode extremely well for our Digital Lifestyle positions in Amazon (AMZN) and United Parcel Service (UPS), our Clean Living holding that is Chipotle Mexican Grill (CMG) and Del Frisco’s Restaurant Group, a Living the Life company.

The report also offered confirming context for our shares in Costco Wholesale (COST) as its August same-store sales handily beat those contained in the August Retail Sales report. Also inside this latest missive from the U.S. Department of Commerce, grocery store sales rose 4.3% year over year in August, which keeps me bullish on our shares of McCormick & Co. (MKC) even as they hover over our current $130 price target.

In terms of areas reporting declines in August Retail Sales Report, we continue to see pressure at Sporting goods, hobby, musical instrument, & bookstores (-3.9%) and Department Stores (-0.7%), continuing the trend of the last few months. With Amazon continuing to flex its business model as well as its own line of private label products, including fashion, sportswear, and apparel, as well as continued digital commerce gains at Walmart (WMT) and its Bonobos brand, we see these retail categories remaining challenged in the coming months.


August restaurant data from TDN2K

On Friday we also received figures from TDn2K’s Black Box Intelligence that showed August same-store restaurant sales rose +1.8%, the best highest since 2015. TDn2K’s data is based on weekly sales from over 30,000 locations representing more than 170 brands and nearly $70 billion in annual sales. More positives for our positions in Chipotle and Del Frisco’s. I’ll tuck this data point away as well as the July and eventual September one to compare them against same-store sales quarterly results for out two restaurant holdings.


US Department of Agriculture

The most recent data published on Friday by the US Department of Agriculture showed cow prices were down 13.6% year over year in July, continuing the trend of double-digit year over year declines that began this past May. I see this as confirmation of deflationary beef prices that bode well for both margins and EPS gains at both Del Frisco’s and to a lesser extent Chipotle.

Later this week, I’ll look for further confirmation of beef deflation leverage when Darden Restaurants (DRI), the parent of Capitol Grill reports its quarterly earnings.


Scaling into Del Frisco’s shares

The net result of these three Friday data points has me adding to our Del Frisco’s Restaurant Group shares at current levels. If our Chipotle shares were lower than our entry point, I’d be doing the same, but they aren’t – if they do fall below the $473 layer, all things being equal I’d look to repeat today’s actions but with CMG shares.

  • We are scaling into shares of Del Frisco’s Restaurant Group (DFRG) following several bullish data points from last week. Our price target for DFRG shares remains $14.
Costco’s July sales report keeps us bullish

Costco’s July sales report keeps us bullish

Key point inside this alert:

  • Our price target remains $230 for Costco Wholesale (COST) shares, however, we will once again assessing incremental upside to be had based on the context to be found in the July Retail Sales Report.


Last night, Costco Wholesale (COST) served up its July sales figures that once again confirmed it continues to take consumer wallet share and open new warehouse locations. We see the month’s data as the latest thesis affirming data point for the company’s business and our position in the shares.

Digging into the particulars of Costco’s July data, net sales hit $10.59 an increase of just over 10% year over year. That brings the trailing three-month year over year increase in net sales to $35.16 billion, up just shy of 12% year over year. Impressive for sure, and the soon to be upon us July Retail Sales Report that will be published next week (Aug. 15) will more than likely once again confirm Costco’s consumer wallet share gains.

One of the keys for these overall revenue gains has been the targeted expansion of the company’s warehouse footprint, which stood at 757 locations exiting July vs. 749 this past April and 736 at the close of July 2017. Excluding the impact of those new openings, which will no doubt drive favorable membership fee income figures, profits and EPS, on a same-store-sales basis, Costco was up 8.3% company-wide (6.4% excluding gas and foreign exchange) in July. This tells us that the core Costco business continues to resonate with consumers, and we see that continuing as we head into the seasonally strong shopping season with Back to School, Halloween, Thanksgiving and the year-end holidays. E-commerce sales climbed more than 20% year over year for the month, which signals the company continues to make inroads as it continues to expand its digital offerings.

Quickly back to the July data for those keeping tabs, each of the company’s reportable segments rose year over year with the strongest gains in the US (up 6.6% excluding gas and foreign exchange) followed by Other International (up 7.1%) and Canada (up 5.0%).

  • Our price target remains $230 for Costco Wholesale (COST) shares, however, we will once again assessing incremental upside to be had based on the context to be found in the July Retail Sales Report.
Weekly Issue: Amazon Prime Day, Netflix Earnings, Controversy at Farmland Partners and June Retail Sales

Weekly Issue: Amazon Prime Day, Netflix Earnings, Controversy at Farmland Partners and June Retail Sales

Key points from this week’s issue:

  • Amazon (AMZN): What to watch as Amazon Prime Day 2018 comes and goes; Following the strong run in Amazon (AMZN) shares over the last several weeks, our $1,900 price target is under review.
  • Habit Restaurants (HABT): Our price target on Habit shares remains $11.50
  • Costco (COST): We are once again boosting our price target on Costco Wholesale (COST) shares to $230 from $220.
  • Netflix (NFLX): Despite 2Q 2018 earnings results, I continue to see Netflix shares rising further in the coming quarters as investors become increasingly comfortable with the company’s ability to deliver compelling content that will attract net new users, driving cash flow and bottom line profits. Our NFLX price target remains $525.
  • Farmland Partners (FPI): While credibility questions will keep Farmland in the penalty box in the short term, we continue to favor the longer-term business fundamentals. Our price target on FPI shares remains $12.


Catching up with the stock market

Last week we saw a change in the domestic stock market. After being led by the technology-heavy Nasdaq Composite Index and the small-cap-laden Russell 2000 during much of 2Q 2018, last week we saw the Dow Jones Industrial Average take the pole position, handily beating the other three major market indices. As all investors know, individual stocks, as well as the overall market, fluctuate week to week, but with just over two weeks under our belt in the current quarter, all four major market indices have moved higher, shrugging off trade concerns at least for now.

Of course, those mini market rallies occurred in the calm period before the 2Q 2018 earnings storm, which kicks off in earnest tomorrow when more than 84 companies will issue their report card for the quarter. Last week’s initial earnings reports for 2Q 2018 were positive for the market as was the latest Small Business Optimism Index reported by the NFIB. Despite those positive NFIB findings, which marked the sixth highest reading in the survey’s 45-year history, business owners continue to have challenges finding qualified workers. The challenge to fill open positions is not only a headwind for growth, but also increases the prospects for wage inflation.

For context, that NFIB survey reading matched the record high set in November 2000, which helps explain the survey’s findings for more companies planning to increase compensation. That adds to the findings from the June PPI report that showed headline inflation rising to 3.4% year over year and the 2.9% year-over-year increase in the June CPI report, all of which gives the Fed ample room to continue increasing interest rates in the coming months. Granted, a portion of that inflation is due to the impact of higher oil prices, but also higher metal and other commodity costs in anticipation of tariffs being installed are contributing. Again, these data points give the Fed the cover fire it will need when it comes to raising interest rates, which at the margin means borrowing costs will inch their way higher. Here’s the thing — all of that data reflects the time-period before the tariffs.

The focus over the next few weeks will be on corporate earnings, particularly how they stack up against expectations calling for more than 20% year-over-year EPS growth for the S&P 500 companies in the back half of 2018. So far, in aggregate, the reports we’ve received give little reason to worry, but to be fair we’ve only had a few dozen in recent weeks, with several hundred to be had. But… ah you knew there was a but coming… with companies like truck freight company JB Hunt blowing the doors off expectations but keeping its full-year 2018 guidance intact… a flag is raised. Another flag raised in the earnings results thus far was the consecutive slowdown in loan growth seen at JPMorgan Chase (JPM), Citigroup (C), PNC (PMC) and Wells Fargo (WFC), which came down to 2.1% year-over-year on an aggregate basis from 3% in the March quarter.

If earnings expectations come up short, we will likely see the market trade-off. How much depends on the discrepancy between reality and projections. Also, keep in mind, the current market multiple is ahead of the market’s historical average, and a resetting of EPS expectations could trigger something similar in the market multiple. What this means is at least as we go through the next few weeks there is a greater risk to be had in the market. As we move into the back half of the September quarter, if Trump can show some progress on the trade front we could have a market rally toward the end of the year. Needless to say, I’ll continue to keep one eye on all of this while the other ferrets out signals for our thematic investing lens.


It’s that Prime Day time of year

As I write this, we have passed the 24-hour mark in what is one of if not the largest self-created holidays. Better known as Amazon (AMZN) Prime Day, this made-up holiday strategically falls during one of the seasonally slowest times of the year for retailers. For those uninitiated with the day, or those who have not seen the litany of websites touting the evolving number of deals and retail steals being served up by Amazon throughout the day, Prime Day is roughly a day and a half push by Amazon to goose it sales by serving up compelling offerings and enticing non-Prime members to become ones. To put some context around it, Coresight Research forecasts Prime Day 2018 will generate $3.4 billion in sales in 36 hours — roughly 6% of the $58.06 billion Amazon is expected to report in revenue for the entire September quarter.

What separates this year’s Prime Day from prior ones isn’t the prospect for record-breaking sales, but rather the increased arsenal of private label products had by Amazon. Over the last few quarters, Amazon has expanded its reach into private label apparel and athletic wear as well as others like shoes and jewelry. All told, Amazon now sells more than 70 of its own brands, which it can price aggressively on Prime Day helping it win incremental consumer wallet share. Prime Day is also a deal bonanza for Amazon’s own line of electronic devices, ranging from FireTV products to Kindle e-readers and Echo powered digital assistants. The thing with each of those devices is they help remove friction to other Amazon products, such as its streaming TV and music services, Audible and of course its digital book service.

Unlike last year, this year’s Prime Day started off with a hitch in that soon after it began shoppers were met with the company’s standard error page because it was overwhelmed with deal seekers. Not a bad problem and certainly a great marketing story, but it raises the question as to whether Amazon will hit that $3.4 billion figure.

To me, the allure of Prime Day is the inherent stickiness it brings to Amazon as the best deals are offered only to Prime members, which historically has made converts of the previously unsubscribed. Those new additions pay their annual fee and that drives cash flow during a seasonally slow time of year for the company, while also expanding the base of users as we head into the year-end holiday shopping season before too long. Very smart, Amazon. But then again, I have long said Amazon is a company that knows how to reduce if not remove transaction friction. Two-day free Prime delivery, Amazon Alexa and Echo devices, Kindle digital downloads, and Amazon Pay are just some of the examples to be had.

Thus far in 2018, Amazon shares are up more than 58%, making them one of the best performers on the Tematica Investing Select List – hardly surprising given the number of thematic tailwinds pushing on its businesses. Even before we got to Prime Day, we’ve seen Amazon expanding its reach on a geographic and product basis, winning new business for its Amazon Web Services unit along the way. More recently, Amazon is angling to disrupt the pharmacy business with its acquisition of online pharmacy PillPack, a move that has already taken a bite out of CVS Health (CVS) and Walgreen Boots Alliance (WAB) shares. Odds are there will be more to come from Amazon on the healthcare front, and it has the potential to add to its business in a meaningful way as it once again looks to reduce transaction friction.So, what am I looking for from Amazon coming out of Prime Day 2018? Aside from maybe a few of mine own purchases, like a new Echo Spot for my desk, on the company data front, I am going to be looking for the reported number of new Prime subscribers Amazon adds to the fold. Sticking with that, I’m even more interested in the number of non-US Prime subscribers it adds, given the efforts by Amazon of late to bring 2-day Prime delivery to parts of Europe. As we here in the US have learned, once you have Prime, there is no going back.

  • Following the strong run in Amazon (AMZN) shares over the last several weeks, our $1,900 price target is under review.


June Retail Sales Report is good for Habit Restaurant and Costco shares

Inside this week’s June Retail Sales Report there were several reasons for investors to take a bullish stance on consumer spending in light of the headline increase of 0.5% month-over-month. On a year-over-year basis, the June figure was an impressive 6.6%, but to get to the heart of it we need to exclude several line items that include “motor vehicles & parts” and “gas stations.” In doing so, we find June retail sales rose 6.4% year-over-year, which continues the acceleration that began in May. The strong retail sales numbers likely means upward revisions to second-quarter GDP expectations by the Atlanta Fed and N.Y. Fed. Despite the positive impact had on 2Q 2018 GDP, odds are this spending has only added to consumer debt levels which means more pressure on disposable income in the coming months as the Fed ticks interest rates higher.

Now let’s examine the meat of the June retail report and determine what it means for the Tematica Select List, in particular, our positions in Habit Restaurants Inc. (HABT) and Costco Wholesale (COST).

Digging into the report, we find retail sales at food services and drinking places rose 8.0% year-over-year in June — clearly the strongest increase over the last three months. How strong? Strong enough that it brought the quarter’s year-over-year increase to 6.1% for the category, more than double the year-over-year increase registered in the March quarter.

People clearly are back eating out and this was confirmed by the June findings from TDn2K’s Black Box Intelligence. Those findings showed that while overall restaurant sales rose 1.1% year over year in June, one of the stronger categories was the fast casual category, which benefitted from robust to-go sales. That restaurant category is the one in which Habit Restaurant competes, and the combination of these two June data points along with new store openings and higher prices increases our confidence in Habit’s second-quarter consensus revenue expectations.

  • Our price target on Habit Restaurants (HABT) remains $11.50

Now let’s turn to Costco – earlier this month the warehouse retailer reported net sales of $13.55 billion for the retail month of June an increase of 11.7% from $12.13 billion last year. Compared to the June Retail Sales Report, we can easily say Costco continues to take consumer wallet share. Even after removing the influences of gas sales and foreign currency, Costco’s June sales in the US rose 7.7% year over year and not to be left out its e-commerce sales jumped nearly 28% year over year as well. Those are great metrics, but exiting June, Costco has 752 warehouse locations opened with plans to further expand its footprint in the coming months. New warehouses means new members, which should continue to drive the very profitable membership fee income in the coming months, a key driver of EPS for the company.

Over the last few weeks, COST shares have been a strong performer. After several months in which it has clearly taken consumer wallet share and continued to expand its physical locations, I’m boosting our price target on COST shares to $230 from $220, which offers roughly 7% upside from current levels before factoring in the dividend. Subscribers should not commit fresh capital at current levels but should continue to enjoy the additional melt up to be had in the shares.

  • We are once again boosting our price target on Costco Wholesale (COST) shares to $230 from $220.


What to make of earnings from Netflix

Last week we added shares of Netflix (NFLX) to the Tematica Investing Select List given its leading position in streaming as well as original content, which makes it a natural for our newly recasted Digital Lifestyle investing theme, and robust upside in the share price even after climbing nearly 100% so far in 2018. As a reminder, our price target for NFLX is $525.

Earlier this week, Netflix reported its June quarter results and I had the pleasure of appearing on Cheddar to discuss the results as they hit the tape. What we learned was even though the company delivered better than expected EPS for the quarter, it missed on two key fronts for the quarter – revenue and subscriber growth. The company also lowered the bar on September quarter expectations. While NFLX shares plunged in

While NFLX shares plunged in after-market trading immediately after its earnings were announced on Monday, sliding down some 14%, yesterday the shares rallied back some to closed down a little more than 5% at the end of Tuesday’s trading session. Trading volume in NFLX shares was nearly 6x its normal levels, as the shares received several rating upgrades as well as a few downgrades and a few price target changes.

Here’s the thing, even though the company fell short of new subscriber targets for the quarter, it still grew its membership by more than 5 million in the quarter to hit 130 million memberships, an increase of 26% year over year. Combined with a 14% increase in average sales price, revenue in the quarter grew 43% year over year. Tight expense control led to the company’s operating margin to reach 11.8% in 2Q 2018, up from 4.6% in the year-ago quarter.

In recent quarters, the number of Netflix’s international subscribers outgrew the number of domestic ones, and that has a two-fold impact on the business. First, the company’s exposure to non-US currencies has grown to just over half of its streaming revenue and the strengthening dollar during 2Q 2018 weighed on the company’s international results. With its content production in 80 countries and expanding, Netflix will move more of its operating costs to non-US dollar currencies to put a more natural hedging strategy in place. Second, continued growth in its international markets means continuing to develop and acquire programming for those markets, which was confirmed by the company’s comments that its content cash spending will be weighted to the second half of this year.

From my perspective, the Netflix story is very much intact and the drivers we outlined have not changed in a week’s time. I continue to see Netflix shares rising further in the coming quarters as investors become increasingly comfortable with the company’s ability to deliver compelling content that will attract net new users, driving cash flow and bottom line profits.

  • Despite Netflix’s (NFLX) 2Q 2018 earnings results, I continue to see Netflix shares rising further in the coming quarters as investors become increasingly comfortable with the company’s ability to deliver compelling content that will attract net new users, driving cash flow and bottom line profits. Our NFLX price target remains $525.


Checking in on Farmland Partners

Last week we saw some wide swings in shares of Farmland Partners (FPI), and given its lack of analyst coverage I wanted to tackle this head-on. Before we get underway, let’s remember that Farmland Partners is a REIT that invests in farmland and looks to increase rents over time, which means paying close attention to farmer income and trends in certain agricultural prices such as corn, wheat and soybeans.

So what happened?

Two things really. First, a bearish opinion piece on FPI shares ran on Seeking Alpha last week, which accused FPI of “artificially increasing revenues by making loans to related-party tenants who round-trip the cash back to FPI as rent; 310% of 2017 earnings could be made-up.” Also according to the article FPI “has not disclosed that most of its loans have been made to two members of the management team” and it has “significantly overpaid for properties.”

As one might suspect, that article hit FPI shares hard to the gut, dropping them some 38%. Odds are that article caught ample attention, something it was designed to do. Soon thereafter, Farmland Partners responded with the following data:

  • The total notes and interest receivable under the Company’s loan program was $11.6 million, or 1.0% of the Company’s total assets, as of March 31, 2018.
  • The program generated $0.5 million in net revenues, or 1.1% of total revenue, in the year ended December 31, 2017.
  • The program is directed at farmers, including, as previously disclosed, tenants. It was publicly announced in August 2015, and included in the Company’s public disclosures since then. None of the borrowers under the program as of March 31, 2018 were related parties, or have other business relationships with the Company, other than as borrowers and, in some cases, tenants.

Those clarifications helped prop FPI shares up, but odds are it will take more work on the part of Farmland’s management team to fully reverse the drop in the shares.

In over two decades of investing, I’ve seen my fair share of bears extrapolate from a few, or less than few, data points to make a sweeping case against a company. When that happens, it tends to be short-lived with the effect fleeting as the company delivers in the ensuing quarters. Given the long-term prospects we discussed when we added FPI shares to the Select List, I’m rather confident over the long-term. In the short-term, the real issue we have to contend with is falling commodity prices and that brings us to our second topic of conversation.

As trade and tariffs have continued to escalate, we’ve seen corn, wheat and soybean prices come under pressure. Because these are key drivers of farmer income, we can understand FPI shares coming under some pressure. However, here’s the thing –  on the podcast, Lenore and I recently spoke with Sal Gilbertie of commodity trading firm Teucrium Trading, and he pointed out that not only are these commodity prices below production costs, something that historically is short-lived, but the demographic and production dynamics make the recent moves unsustainable. In short, China’s share of the global population is multiples ahead of its portion of the world’s arable land, which means that China will be forced to import corn, wheat and soybeans to not only feed its people but to feed its livestock as well. While China may be able to import from others, given the US is among the top exporters for those commodities, that can only last for a period of time.

Longer-term, the rising new middle class in China, India and other parts of greater Asia will continue to drive incremental demand for these commodities, which in the long-term view bodes well for FPI shares.

What I found rather interesting in Farmland’s press release was the following –  “We are evaluating what avenues are available to the Company and its stockholders to remedy the damage inflicted.” Looks like there could be some continued drama to be had.

  • While credibility questions will keep Farmland Partners (FPI) in the penalty box in the short term, we continue to favor the longer-term business fundamentals. Our price target on FPI shares remains $12.