Weekly issue: Downside Protection Critical Amid These Uncertain Conditions

Weekly issue: Downside Protection Critical Amid These Uncertain Conditions

Key points inside this issue

  • Ahead of the Fed’s latest dot blot, 2019 GDP expectations move lower.
  • With uncertainties again on the rise, we reiterate our Buy rating on the ProShares Short S&P 500 ETF (SH) ahead of the upcoming March quarter earnings season.


Weakening GDP Expectations for the Remainder of 2019

Looking back over the last few weekly issues, it would be fair to say they were a little wordy. What can I say, between the economic data and earnings season, plus thematic data points, there was a lot to share over the last few weeks. Today, however, I’m going to cut to the point with my comments, largely because all investor eyes and ears are waiting to see and hear what Fed Chair Jerome Powell has to say about the speed of the US economy as they look for signs over what is coming next out of the Fed.

We’ve talked quite a bit about the slowing speed of the global economy, and even though there have been some individual bright spots across the aggregated hard and soft economic data from both government and third-party sources, the slowing speed is hard to ignore. Based on the published data, domestic GDP hit 3.1% last year, and as we’ve shared recently we’ve started to see the expectations for 2019 move lower in recent weeks. Per the March CNBC Fed Survey of 43 economists and Fed watcher findings, GDP for 2019 is now expected to clock in around 2.3% — not quite cut in half compared to 2018, but dramatically lower and significantly lower than folks were looking for in the back half of 2018.

When the Fed issues its post FOMC meeting statement today, the focus will more than likely not be on the interest rate decision – almost no one expects a hike. Instead, rapt attention will be paid to the Fed’s updated economic dot plot, which will reveal how it sees the US economy shaping up. Let’s remember that one unofficial aspect of the Fed’s job is to be a cheerleader for the economy, so it becomes a question of “if they are cutting their GDP forecast” how deep of a cut could we really see?

Culprits of the slowing economy and these cuts include aspects of our Middle-Class Squeeze investing theme as consumers in the US grapple with debt levels that have risen precipitously over the last several years. The consumer spending tailwind associated with our Living the Life investing theme appears to be slowing some given the rising debt levels of Chinese consumers. Governments have also run up debt in recent years as the current business cycle has grown longer in the tooth. And of course, there is the impact of currency as well as political and trade uncertainties, including the pushout of US-China trade talks to June.


Downside Protection is Key Under These Circumstances

In a little over 10 days, we will be exiting March, entering the second quarter and beginning the earnings season dance all over again. My concern is that given the above and the several unknowns therein, we are poised to see another earnings season during which aggregate expectations will be adjusted lower. Case in point, with the  US-China trade agreement timetable slipping and slipping, it becomes rather difficult for a company to factor any resolution into its guidance, especially when the terms of the agreement are unknown.

Despite all of the above, the domestic stock market has continued to chug higher, once again approaching overbought levels, even though 2019 EPS cuts for the S&P 500 have made the market even more expensive than it was as we exited 2018.

The potential poster child for this is FedEx (FDX), which saw its shares take a fall last night after the company cut its annual profit forecast for the second time in three months due to slowing global growth, rising costs from a 2016 acquisition in Europe and questions over its ability to withstand U.S.-China trade tensions and uncertainty over the U.K.’s exit from the European Union.

Not to go all Groundhog Day on you, but this looks increasingly like the situation we saw in December when I added the ProShares Short S&P 500 ETF (SH) to the Select List. If we didn’t have those shares to offer some downside protection for what lies ahead, I would be adding them today. If you don’t have any of those shares in your holdings, my advice would be to add some. Much like insurance, you may not know exactly when you’ll need it, but you’ll be happy to have it when something goes bad.

  • With uncertainties again on the rise, we reiterate our Buy rating on the ProShares Short S&P 500 ETF (SH) ahead of the upcoming March quarter earnings season.


Apple’s negative pre-announcement serves as a reminder to the number of risks that have accumulated

Apple’s negative pre-announcement serves as a reminder to the number of risks that have accumulated


We are “breaking in” to share my thoughts with you on the implications of Apple’s (AAPL) downside December quarter earnings news last night. Quickly this is exactly of what I was concerned about in early December, but rather than take a victory lap, let’s discuss what it means and what we’re going to do. 

Last night we received a negative December quarter earnings preannouncement from Apple (AAPL), which is weighing on both AAPL shares as well as the overall market. It serves as a reminder to the number of risks that have accumulated during the December quarter – the slowing global economy, including here at home; the US-China trade war; Brexit and other geopolitical uncertainty in the eurozone; the strong dollar; shrinking liquidity and a Fed that looks to remain on its rate hike path while also unwinding its balance sheet. Lenore Hawkins and I talked about these at length on the Dec. 21 podcast, which you can listen to here.

In short, a growing list of worries that are fueling uncertainty in the market and in corporate boardrooms. When the outlook is less than clear, companies tend to issue conservative guidance which may conflict with Wall Street consensus expectations. In the past when that has happened, it’s led to a re-think in growth prospects for both the economy, corporate profits and earnings, the mother’s milk for stock prices.

These factors and what they are likely to mean when companies begin issuing their December quarter results and 2019 outlooks in the coming weeks, were one of the primary reasons we added the ProShares Short S&P 500 (SH) shares to our holdings in just under a month ago. While the market fell considerably during December, our SH shares rose 5% offering some respite from the market pain. As expectations get reset, and odds are they will, we will continue to focus on the thematic tailwinds and thematic signals that have been and will remain our North Star for the Thematic Leaders and the larger Select List.


What did Apple have to say?

In a letter to shareholders last night, Apple CEO Tim Cook shared that revenue for the quarter would come in near $84 billion for the quarter vs. the consensus estimate of $91.5 billion and $88.3 billion, primarily due to weaker than expected iPhone sales. In the letter, which can be read here, while Apple cited several known headwinds for the quarter that it baked into its forecast such as iPhone launch timing, the dollar, supply constraints, and growing global economic weakness, it fingered stronger than expected declines in the emerging markets and China in particular.

Per the letter, most of the “revenue shortfall to our guidance, and over 100 percent of our year-over-year worldwide revenue decline occurred in Greater China across iPhone, Mac, and iPad.”

Cook went on to acknowledge the slowing China economy, which we saw evidence of in yesterday’s December Markit data for China. Per that report,

“The Caixin China General Manufacturing PMI dipped to 49.7 in December, the first time since May 2017 that the reading has been below 50, the mark that separates expansion from contraction. The sub-index for new orders slid below the breakeven point of 50 for the first time since June 2016, reflecting decreasing demand in the manufacturing sector.”

In our view here at Tematica, that fall in orders likely means China’s economy will be starting off 2019 in contraction mode. This will weigh on corporate management teams as they formulate their formal guidance to be issued during the soon to be upon us December quarter earnings season.

Also, in his letter, Cook called out the “rising trade tensions with the United States”  and the impact on iPhone demand in particular.

In typical Apple fashion, it discussed the long-term opportunities, including those in China, and other positives, citing that Services, Mac, iPad, Wearables/Home/Accessories) combined to grow almost 19% year-over-year during the quarter with records being set in a number of other countries. While this along with the $130 billion in cash that Apple has on its balance sheet exiting the December quarter, bode well for the long-term as well as its burgeoning efforts in healthcare and streaming entertainment, Apple shares came under pressure last night and today.


Odds are there will more negative earnings report to come

In light of the widespread holding of Apple shares across investor portfolios, both institutional and individual, as well as its percentage in the major market indices, we’re in for some renewed market pressure. There is also the reality that Apple’s decision to call out the impact of U.S.-China trade will create a major ripple effect that will lead to investors’ renewed focus on the potential trade-related downside to many companies and on the negative effect of China’s slowing economy.

In recent months we’ve heard other companies ranging from General Motors (GM) to FedEx (FDX) express concerns over the trade impact, but Apple’s clearly calling out its impact will have reverberations on companies that serve markets tied to both the smartphone and China-related demand. Overnight we saw key smartphone suppliers ranging from Skyworks Solutions (SWKS) and Qorvo (QRVO) come under pressure, and the same can be said for luxury goods companies as well. We’d note that Skyworks and Qorvo are key customers for Select List resident AXT Inc (AXTI, which means if we follow the Apple revenue cut through the supply chain, it will land on AXT and its substrate business.

All of the issues discussed above more than likely mean Apple will not be the only company to issues conservative guidance. Buckle up, it’s going to be a volatile few weeks ahead.


Positives to watch for in the coming weeks and months

While the near-term earnings season will likely mean additional pain, there are drivers that could lift shares higher from current levels in the coming months. These include a trade deal with China that has boasts a headline win for the US, but more importantly contains positive progress on key issues such as R&D technology theft, cybercrimes and the like – in other words, some of the meaty issues. There is also the Federal Reserve and expected monetary policy path that currently calls for two rate hikes this year. If the Fed is data dependent, then it likely knows of the negative wealth effect to be had following the drop in the stock market over the last few months.

Per Moody’s economist Mark Zandi, if stocks remained where there were as of last night’s close, it would equate to a $6 trillion drop in household wealth over the last 12-15 months. Per Zani, that would trim roughly 0.5% to 2019 GDP – again if the stock market stayed at last night’s close for the coming weeks and months. As we’re seeing today, and given my comments about the upcoming earnings season, odds are that 2019 GDP cut will be somewhat larger. That would likely be an impetus for the Fed to “slow its roll” on interest rates or at least offer dovish comments when discussing the economy.

Complicating matters is the current government shutdown, which has both the Census Bureau and Bureau of Economic Analysis closed. Even though there will be some data to be had, such as tomorrow’s December 2018 Employment Report from the Labor Department, it means the usual steady flow of economic data will not be had until the government re-opens. No data makes it rather difficult to judge the speed of the economy from all of us, including the Fed.

Given all of the above, we’ll continue to keep our more defensive positions companies like McCormick & Co. (MKC), Costco Wholesale (COST), and the ProShares Short S&P 500 shares intact. We’ll continue to watch input costs and what they mean for corporate profits at the margin – case in point is Del Frisco’s (DFRG), which is benefitting from not only falling protein costs but has been approached by an activist investor that could put the company in play. With Apple, Dycom Industries (DY), and AXT, we will see 5G networks lit this year here in the US, which will soon be followed by other such networks across the globe in the coming years. Samsung, Lenovo/Motorola and others have announced 5G smartphones will be shipping by mid-2019, and we expect Apple to once again ride that tipping point in 2020. That along with its growing Services business and other efforts to increase the stickiness of iPhone (medical, health, streaming, payments services), keeps us long-term bulls on AAPL shares.

When not if but when, the stock market finds its footing, which likely won’t be until after the December quarter earnings season at the soonest, we will look to strategically scale into a number of positions for the Thematic Leaders and the Select List.


Weekly Issue December 17 2018

Weekly Issue December 17 2018

Key points inside this issue:

  • The Duke University/CFO Global Business Outlook survey surprises the market
  • Costco stumbles, but it is far from down and out
  • Thematic confirmation had in the November Retail Sales Report
  • Digging into Friday’s other economic reports
  • What to watch this week
  • Holiday Housekeeping

The Duke University/CFO Global Business Outlook survey surprises the market

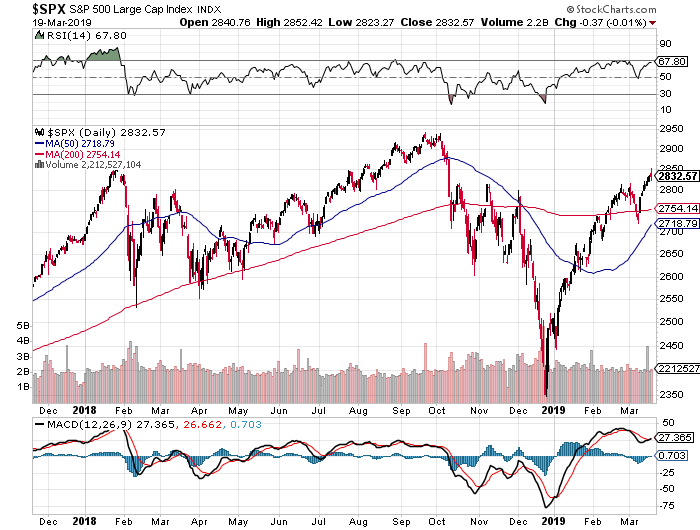
What looked to be shaping up as a positive week for the stock market turned on its head Friday following renewed concerns over the pace of the global economy. As we’ve talked about recently, the vector and velocity of the latest economic reports suggest a slowing economy and that is fueling questions over the top and bottom-line growth prospects for 2019.

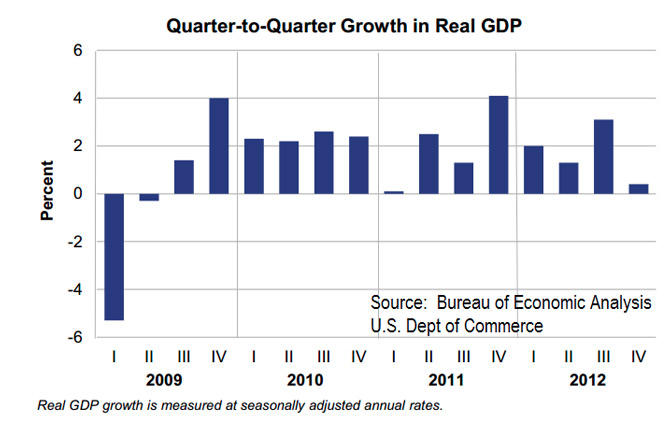
Tossing some logs on the that fire late last week was the new survey findings from the Duke University/CFO Global Business Outlook survey that showed almost half (48.6%) of US chief financial officers believe the United States will be in recession by the end of next year while 82% of CFOs surveyed believe that a recession will begin by the end of 2020. That’s quite different than the Wall Street consensus, which per The Wall Street Journal’s Economic Forecasting Survey sees the speed of the economy slowing from 3.5% in the September 2018 quarter to 2.5% in the current one to 2.4% in the first half of 2019 followed by 2.2% in the back half of the year.

This revelation has added to the list of concerns that I’ve been discussing of late and adds to the growing worries over EPS growth prospects in 2019.


Costco stumbles, but it is far from out

Last Thursday night, Costco Wholesale (COST), our Middle-Class Squeeze Thematic Leader, reported an EPS beat by $0.05 per share for the quarter, but revenue came in a tad short at up 10.3% year over year, or $34.3 billion vs. the expected $34.66 billion. Same-store sales for the quarter rose 8.8% (+7.5% ex-gasoline and currency), which is well above anything we’ve seen for the September-November period per Friday’s November Retail Sales report save for digital shopping (Non-store retailers) and gas station sales – more on that shortly.

Despite the positive EPS, COST shares fell 8.6% on Friday.

The issue with Costco was the margin profile as reported operating income was essentially flat year over year. When combined with the top line increase vs. the year-ago quarter it means the company’s operating margin hit 2.7% vs. 3.0% in the year-ago quarter, and 3.2% this past August quarter. Part of the issue was the jump up in pre-opening expenses for new warehouse locations which rose by 6% quarter over quarter. The real culprit was the step up in merchandising costs, which climbed 10.8% year over year for the November quarter vs. 5.4% year over year in the September quarter. Clearly, Costco is seeing the impact of not only higher prices but also the impact of tariffs associated with the U.S.-China trade war.

Despite that, the core basics at the company – foot traffic, renewal rates, and membership growth – continue to fire on all cylinders. That to me makes Costco one of the best-positioned retailers, and the fact that its e-commerce business continues to blossom is positive as well. In all of 2019, Costco looks to open 20-23 net new warehouses, which equates to an increase of 2.5%-3.0% year over year. This will likely drive pre-opening expenses higher in the coming months, but given the favorable metrics associated with each new location over the medium to longer-term, we’ll take it, especially if the economy slows more than expected. Odds are that will drive more consumers to Costco than not.

  • Our long-term price target on Costco Wholesale (COST) shares remains $250.


Thematic confirmation in the November Retail Sales Report

Looking over Friday’s November Retail Sales Report, core Retail Sales rose 4.0% year over year with strong performance as expected for Non-store Retailers (+10.8% year over year), Gasoline Stations (+8.2%) and Food Service & Drinking Places (+5.6%). To me, those first and third categories ring positive for our Digital Lifestyle and Living the Life investing themes. That means I see those as positive signs for our thematic and holiday shopping positioned companies, which includes the aforementioned Costco, but also Amazon (AMZN), United Parcel Service (UPS), McCormick & Co. (MKC), International Flavors & Fragrances (IFF) and Del Frisco’s Restaurant Group (DFRG).

Back to the November Retail Sales report, while the sequential overall retail comparisons came in either as expected or slightly better depending on the forecast one is looking at, what’s likely to catch the market’s attention is the sequential drop in year over year retail sales growth that was had in November. Again, year over year November retail sales growth rose 4.0%, which was down compared to the October year over year increase of 4.5%.

Given the growing amount of data that points to a slowing domestic economy, one that is driven meaningfully by the consumer, odds are market watchers will not love what they saw in those year over year comparisons. Add to it that a recent Gallup poll found that Americans plan to spend less on holiday gifts today than they expected back in October and less than they expected to spend in 2017. The $91 decline in expected spending since October is “one of the steeper mid-season declines, exceeded only by a $185 drop that occurred in 2008, as the Wall Street financial crisis was unfolding, and a $102 drop in 2009 during the 2007-2009 recession.”

Clearly, those latest data points weighed on the overall stock market last week, but those weren’t the only ones.


Digging into Friday’s other economic reports

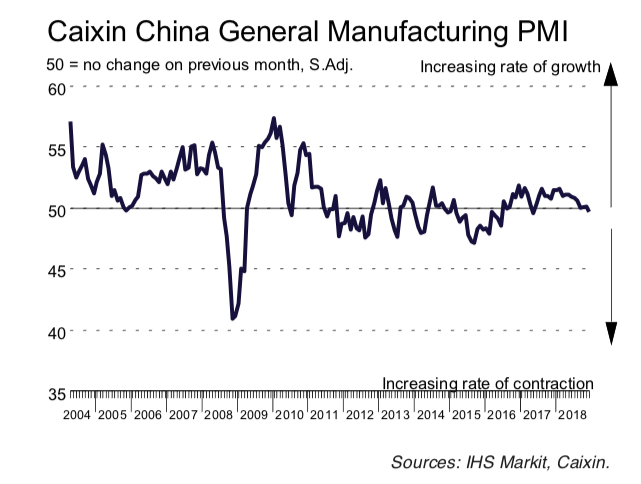
The November Retail Sales report wasn’t the only set of key data that weighed on the market last Friday. The November Industrial Production Report showed a flat manufacturing economy following the modest dip in October. On the December Flash PMI reports, the U.S. hit a 19-month low for the month with softer new order growth, while “Lower oil-related costs contributed to the slowest rate of input price inflation since the start of the year.” Turning to the eurozone, its Composite Output PMI hit 51.3, down from 52.7 in November, and reached a four-year low. The Flash Manufacturing PMI data for Japan was better, as it rose to 52.4 for December up from 52.2 in November, but that is hardly what we would call a robust figure given the expansion/contraction line at the 50.0 level. While new orders activity improved in Japan, new export orders fell, signaling a change of direction, which supports the notion of a slowing global economy.

This data along with the back and forth on U.S.-China trade, Brexit developments, Italy budget concerns, protests in France, and the potential government shutdown have all raised investor uncertainty levels. We see this in the current “Extreme Fear” (9) reading on the CNN Business Fear & Greed Index, which is little changed over the last few weeks. We’ve seen this play out in the stock market as the number of stocks hitting new highs pales in comparison to hitting 52-week lows. As one likely suspects, we saw this play out in small cap stocks, which per the Russell 2000 last week, were once again the hardest hit of the major stock categories. Quarter to date, small cap stocks are down just under 17% quarter to date.

We saw a number of these concerns brewing as we exited September and entered the September- quarter earnings season. We have been careful in making additions to the Select List given what I’ve viewed as an environment that has been more skewed to risk than reward. Odds are that will continue to be the case between now and the end of the year, which means we will continue to be overly selective when it comes to deploying capital. For that reason, last week we added the ProShares Short S&P 500 ETF (SH) shares to our holdings to add some downside protection.


What to Watch This Week

Following last week’s rash of economic data, don’t ask me how or why but the Atlanta Fed saw fit to boost its GDP Now forecast for the current quarter to 3.0% from 2.4% last week. As subscribers know, I prefer the far more solid track record at the NY Fed and its Nowcast report, which now calls for the current quarter to be +2.4%, down from +2.44% last week. That’s in line with The Wall Street Journal’s Economic Forecasting Survey, but again that Duke poll is likely to be in the forefront of investor minds this week as more data is had. This includes several pieces of housing data — the November Housing Starts & Building Permits as well as November Existing Home Sales and the October NAHB Housing Market Index — as well as the November Durable Orders Report and November Personal Income & Spending data.

As I mentioned above, the number of economic numbers suggesting the global economy continues to slow are growing, which likely gives the Fed far more room to issue dovish comments after next week’s all but done December rate hike. In recent weeks as the Fed has once again signaled it will more than likely remain data dependent in 2019, we’ve seen a change in the futures market, which is now pricing in less than 20 basis points of rate hikes next year versus over 55 basis points just a few months ago. But we have to consider the reason behind this slower pace of rate hikes, which is the suggestion by recent data that the economy is far from overheating, which also adds to the core question we suspect investors and the market are asking: how fast/strong will EPS growth be in 2019?

As we prepare for Fed Chair Powell’s remarks, it’s not lost on me that we could very well see a “buy the rumor, sell the news” event following the FOMC meeting next week.

Heading down the final stretch of 2018, I’ll be looking at well-positioned companies relative to our investment themes that have been hard hit by the quarter to date move in the market. As of Friday’s market close, the S&P 500 was down X% quarter to date, while the tech-heavy Nasdaq Composite Index and the small-cap heavy Russell 2000 were down 14% and nearly 17%, respectively, on that basis. One of the criteria that I’ll be focusing on as I weed through this growing list of contenders is favorable EPS growth year over year relative to the S&P 500. And, yes, when I say that I do mean to “real” EPS growth due to rising profit margins and expanding dollar profits instead of those lifted largely by buyback activities.

With that in mind, I’ll be paying close attention to a number of key earnings reports coming at us next week. These include Nike (NKE), Carmax (KMX), ConAgra (CAG), General Mills (GIS), Micron (MU), FedEx (FDX) and Darden Restaurants (DRI). Inside these reports and company commentaries, I’ll be looking for data points that to confirm our investment themes, the question of inflation vs. deflation and where it may be, and a last-minute update from FedEx on digital commerce for this holiday shopping season that we are all in the thick of. Also, among those reports is Del Frisco’s competitor – The Capital Grill, which is owned by Darden. I’ll be paying extra close attention to that report and what it means for our DFRG shares.


Holiday Housekeeping!

And that brings us to our Housekeeping note, which is this – given the way the Christmas and New Year’s holidays fall this year, barring any unforeseen issues that will require our attention and immediate action, we here at Tematica will be in “get ready for 2019” mode. That means we’ll be using the quiet holiday time to review the Thematic Leaders as well as positions on the Select List to ensure we are well prepared for the coming months ahead.

As such, we’re likely to be back the week of January 7th, although I can’t rule out the urge to share some thoughts with you sooner. For example, if the Fed says something that rolls the stock market’s eyes later this week, I’ll be sure to weigh in and share my thoughts. The same goes for the Darden earnings report I mentioned above and what it may mean for our DFRG shares.

We will have a new podcast episode or two before then, and we will be sharing a number of Thematic Signals over the coming weeks – if only those confirming signs for our investment themes would take a break. I’m only kidding, but of course, I love how recognizable and relatable the themes are in and around our daily lives.

To you and your loved ones, Merry Christmas, Happy Holidays, and Happy New Year! See you 2019!!


WEEKLY ISSUE: What September May Bring

WEEKLY ISSUE: What September May Bring

Alright, alright, alright! Welcome back from the last bit of summer vacation, and it’s back to business for companies and stocks. We’ve moved from sleepy August to September, historically one of the most volatile months for stocks. Over the last few weeks, we’ve chin-wagged quite a bit over the items that could disrupt the market, but as happens from time to time, something appears out of thin air that is an unexpected disruptor. Last week that was the damage done by Hurricane Harvey, and now we have not just one but potentially two more hurricanes to contend with – Irma and Jose. Also adding to the news mix was the return of North Korea, following its nuclear test over the holiday weekend.


WE KNOW ONE THING SEPTEMBER WILL BRING . . . DRAMA

Normally after the Labor Day weekend, we see trading volume return to normal and the “B-team” that was covering trading desks replaced by the A-team. As they return, those players pore over data and happenings over the last few weeks that they’ve been away. This helps explain why September tends to be one of the more volatile months for stocks.

Another reason for the September volatility spikes is that in the coming days we’re going to see a return of investor conferences, and companies presenting at these events will give their first update since reporting 2Q 2017 earnings back in July. These updates will shape the tone of the second half of the year, and as we’ve shared previously, expectations call for meaningful EPS growth compared to the first half. In the coming days, we’ll start to see if those forecasts are as aggressive as we think they are given the speed of the economy.

We already know that Harvey and Irma will be and near-term economic shock to the system, likely resulting in a meaningful hit to GDP in the current quarter. In the coming days and weeks, we expect to hear retailers, restaurants, insurers, and others that have been impacted by Harvey reset expectations, and that is likely to weigh on the market near-term.  Eventually, we’ll see a snap back as rebuilding occurs in the coming months, but that will benefit a different set of companies than those affected. With that in mind, yesterday, we posted our thoughts on what the fallout could mean from the Harvey-Irma combination and shared a who’s who of stocks that are likely beneficiaries. With Jose being added to the mix, things could be even brighter for that list of companies we’re scoping out.

Cocktail Investing: Hurricane Harvey and its Impact on the Markets and EconomyAs we wait to see the incremental impact to be had from both Irma and Jose, let’s remember something we called out on last week’s Harvey focused podcast – the rebuilding effort, including federal relief, could trigger a sooner than expected debt ceiling coverage. Now we’re getting wind that the Republican Freedom Caucus is opposed to attaching a funding request for Hurricane Harvey aid to a debt limit increase and on the news that President Trump ended the Deferred Action for Childhood Arrivals (DACA) program. There has been no shortage of DC drama these last several weeks, and as we noted a few weeks ago, and with the debt ceiling discussion and tax reform taking center stage that DC drama is likely to extend its current run in the center ring.

We see this a one drama replacing another, with the one replaced being the Fed’s expected September balance sheet unwinding. In our view, following the near-term economic impact by Harvey and potentially the other hurricanes odds are the Fed will hold off with its balance sheet unwinding for a few more months. Even Federal Reserve Governor Lael Brainard argued this week the economic effects of Hurricane Harvey “raise uncertainties about the economic outlook for the remainder of the year” and argued for “a wait-and-see approach” before raising rates again. We’ve already seen another push out in rate hike expectations, and as balance sheet unwinding slips closer to the end of the year we’ll likely see yet another push out for the next Fed rate hike as well.

Putting these pieces together – hurricanes and the GDP impact, ongoing DC drama, and companies poised to reset guidance – it’s no surprise we’ve seen the Volatility Index perk up yesterday. Again, as the A-team on Wall Street has returned to their saddles. Most likely this means a thorough going over with an extra eye on risk management, as the herd looks to lock in profits.

We’ll be doing the same – revisiting thematic data points that reside in our own Thematic Signals and elsewhere – to do a review of positions on the Tematica Select List. As you saw with our recent exit of Dycom (DY) shares, we’re not ones to fall in love with the positions, but as you saw yesterday when we added to Costco (COST) shares when we see a mismatch between fundamentals and stock price performance, we’ll take action.


Thematic Data points this week — Apple & Universal Display

We have no companies reporting earnings this week, but we will be looking at thematic data points found in results from Safety & Security company American Outdoor Brands (AOBC), Cashless Consumption contender VeriFone (PAY) and Affordable Luxury company Restoration Hardware (RH). Next Tuesday, September 12th, Apple (AAPL) is set to take the wraps off its next iPhone iteration and this means we’ll finally get the official word on Apple’s use of organic light emitting diode displays. As we recently cautioned, there tends to be much build up ahead of these Apple events, and there is a history in the post-Steve Jobs era of them underwhelming. If that happens, we could see shares of Disruptive Technology position Universal Display (OLED) come under some pressure. Given the accelerating adoption of the technology across a variety of applications beyond smartphones, we would view any pullback as an opportunity.

  • At current levels, subscribers should “Hold” Universal Display (OLED) shares rather than commit fresh capital.
  • Our price target remains $135, but given expanding market applications for its products and licensing business, we’re inclined to be owners of the shares for the medium to longer term.


Be sure to check the website as well as your email for updates and other alerts as we share more thematic insights and actions during the week.


Assessing the Market as We Get Ready for 1Q17 Earnings Deluge

Assessing the Market as We Get Ready for 1Q17 Earnings Deluge

Despite yesterday’s move higher in the stock market, March to date has seen the Dow Jones Industrial Average move modestly lower with a larger decline in the Russell 2000. Only the Nasdaq Composite Index has climbed higher in March, bringing its year to date return to more than 9 percent, making it the best performing index thus far in 2017. By comparison, the Dow is up 4.75 percent, the S&P 500 up 5.35 percent and the small-cap heavy Russell 2000 up just 0.75 percent year to date.

So what’s caused the move lower in the stock market during March, bucking the upward trend the market enjoyed since Election Day 2016?

Despite the favorable soft data like consumer confidence and sentiment readings, investors are waking to the growing disconnect between post-election expectations and the likely reality between domestic economic growth and earnings prospects. Fueling the realization is the move lower in 1Q 2017 earnings expectations for the S&P 500, per data from FactSet, as well as several snafus in Washington, including the pulling of the vote for the GOP healthcare plan. These have raised questions about the timing and impact of President Trump’s stimulative policies that include infrastructure spending and tax reform.

We’ve been steadfast in our view that the earliest Trump’s policies could possibly impact the US economy was late 2017, with a more dramatic impact in 2018. On a side note, we agree with others that would have preferred to have team Trump focus on infrastructure spending and tax reform ahead of the Affordable Care Act. As we see it, focusing on infrastructure spending combined with corporate tax reform first would have boosted confidence and sentiment while potentially waking the economy from its 1.6 to 2.6 percent annual real GDP range over the last five years sooner. We’d argue too that that would have likely added to Trump’s political war chest for when it came time to tackle the Affordable Care Act. Oh well.


Evolution of Atlanta Fed GDPNow real GDP forecast for 2017: Q1


So here we are and the enthusiasm for the Trump Trade is being unraveled as growth slows once again. As depicted above, the most recent forecast for 1Q 2017 GDP from the AtlantaFed’s GDPNow sits at 1.0 percent compared to 1.9 percent for 4Q 2016 and 3.5 percent in 3Q 2016. Even a grade school student understands the slowing nature of that GDP trajectory. Despite all the upbeat confidence and sentiment indicators, the vector and velocity of GDP forecast revisions and push outs in the team Trump timing has led to to the downward move in S&P 500 EPS expectations for the current quarter and 2017 in full.

With Americans missing bank cards payments at the highest levels since July 2013, the delinquency rate for subprime auto loans hitting the highest level in at least seven years and real wage growth continuing to be elusive, the outlook for consumer spending looks questionable. Factor in the aging of the population, which will have additional implications, and it looks like the consumer-led US economy is facing more than a few headwinds to growth in the coming quarters. These same factors don’t bode very well for the already struggling brick & mortar retailers like Macy’s, Sears, JC Penney, Payless and others.

Now here’s the thing, currently, the S&P 500 is trading at 18x 2017 expectations —expectations that are more than likely to be revised down than up as the outlook for U.S. economic growth in the coming quarters is revisited. In three days, we close the books on 1Q 2017 and before too long it means we’ll be hip deep in corporate earnings reports. If what we’ve seen recently from Nike, FedEx, General Mills, Kroger and Target is the norm in the coming weeks, it means we’re more likely to see earnings expectations revised even lower for the coming year.

While it’s too early to say 2017 expectations will be revised as steeply as they were in 2016, (which started the year off with the expectation of a 7.6 percent increase year over year but ended with only a 0.5 percent increase following 4Q 2016 reporting), but any additional downward revisions will either serve to make the market even more expensive than it currently is or lead to a resumption of the recent downward move in the market. Either way, odds are there is a greater risk to the downside than the upside for the market in the coming weeks.

Buckle up; it’s bound to get a little bouncy.

Walking a Tight Rope as the Fed Faces a Stagflating Economy

Walking a Tight Rope as the Fed Faces a Stagflating Economy

The big question that’s been overhanging the market this week was cleared up yesterday when the Fed announced the next upward move in interest rates, something the stock market has been increasingly expecting over the last several weeks. In looking at the Fed’s new forecasts compared to those issued three months ago, there were no material changes in the outlook for GDP, the Unemployment Rate, on expected inflation.

We find the Fed’s action yesterday rather interesting against that backdrop, especially given its somewhat lousy track record when it comes to timing its rate increases —  more often than not, the Fed tends to raise interest rates at the wrong time. This time around, however, it seems the Fed is somewhat hellbent on getting interest rates back to normalized levels from the artificially low levels they’ve been at for nearly a decade. Even the language with which they announced the rate hike — “In view of realized and expected labor market conditions and inflation, the Committee decided to raise the target range for the federal funds rate to 3/4 to 1 percent” — makes one wonder exactly what data set they are using to base the decision.

The thing is, recent economic data hasn’t been all that robust. Yesterday morning, the Fed’s own Atlanta Fed once again slashed its GDPNow forecast for 1Q 2016 yesterday to 0.9 percent from 1.2 percent last week and more than 3.0 percent in January. That’s a big downtick from 1.9 percent GDP in 4Q 2016! Given the impact of winter storm Stella, particularly in the Northeast corridor, odds are GDP expectations will once again tick lower as consumer spending and brick & mortar retail sales were both disrupted. As Tematica’s Chief Macro Strategist Lenore Hawkins pointed out yesterday, real average hourly earnings decreased 0.3 percent, seasonally adjusted, year over year in February.

Despite that lack of wage growth, we have seen inflation pick up over the last several months inside the Purchasing Managers’ Indices published by Markit Economics and ISM for both the manufacturing and services economies as well as the Producer Price Index. Year over year in February, the Producer Price Index hit 2.2 percent, marking the largest 12-month increase since March 2012. Turning to the Consumer Price Index, the headline figure rose 2.7 percent this past February compared to a year ago, making it the 15th consecutive month the 12-month change for core CPI was between 2.1 percent and 2.3 percent. We’ve all witnessed the rise in gas prices, up some 18 percent compared to this time last year, and while there are adjustments to strip out food and energy from these inflation metrics, our view at Tematica is food and energy are costs that both businesses and individuals must bear. Rises prices for those items impact one’s ability to spend, especially if wages are not growing in tandem.

It would seem the Fed is caught once again between a rock and a hard place — the economy is slowing and inflation appears to be on the move. The economic term for such an environment is stagflation. In looking to get a handle on stagflation the Fed is walking a thin line between trying to get a handle on inflation while not throwing cold water on the economy as it continues to target two more rate hikes this year.

Once again, we find ourselves rather relieved that we don’t have Fed Chairwoman Janet Yellen’s job. We’re far more content to look at the intersecting and shifting landscapes around us to look for companies positioned to prosper from multi-year thematic tailwinds like those found on the Tematica Select List. Great examples include Buy rated Applied Materials (AMAT), Dycom Industries and Universal Display (OLED) among others. As we do this, we recognize the stock market is out over its ski tips and yet to fully bake in the current and likely near-term economic reality into its thinking especially as the likely timing on potential Trump economic policies look further out than previously thought. This is likely to offer the opportunity to find such thematic beneficiaries at better prices in the coming weeks compared to today.

While we may be a tad ahead of the herd on this, we’ll continue to be prudent investors and let the data, the hard data, talk to us as we navigate our next moves with the Tematica Select List.

The Market Climbs Higher, But Look at These Two Charts and It’s Ruh-Roh Time

The Market Climbs Higher, But Look at These Two Charts and It’s Ruh-Roh Time

As the stock market continued to get further and further out over its ski tips last week, as investors we have a split mind on the current state of things. On the one hand, we’re certainly enjoying the higher stock prices. On the other hand, we are mindful of the increasingly stretched market valuation. One of the common mistakes see with investors is they all too easily enjoy the gains, but tend not to be mindful of the risks that could wash those gains away.

Over the last few weeks, we here at Tematica have been pointing out the growing disconnect between the stock market’s valuation and the current economic environment. We have a snootful of data points that underscore our cautious stance in this week’s Monday Morning Kickoff, but we wanted to share two charts from our weekend reading that caught our cautious eye.

There have been some who call into question the use of Robert Schiller’s Cyclically Adjusted Price to Earnings (CAPE) ratio, but Tematica’s Chief Macro Strategist Lenore Hawkins does a pretty good job handling that criticism. Exiting last week the CAPE to GDP growth of 19.77 has far surpassed the 1999 peak and all points back to at least 1950. As we like to say when looking at data, context and perspective are key to truly understanding what it is we’re looking out. So here’s that context and perspective for the current CAPE to GDP reading —  it is over three times the average for the last 66 years. Going back to 1900, the only time today’s ratio was eclipsed was in 1933 and that reflected the Great Depression when GDP has been running at close to zero for nearly a decade.

Students of CAPE will point out that in order for the CAPE to GDP to fall back to more normalized levels, we either need to see a dramatic increase in GDP (not likely in the near-term) or we need to see a pullback in the CAPE. Here’s the thing, as Michael Lebowitz of 720 Capital points out, “if we assume a generous 3% GDP growth rate, CAPE needs to fall to 18.71 or 35 percent  from current levels to reach its long-term average versus GDP growth.” Based on the data we’re seeing, there is a rather high probability 2017 GDP is more likely to be closer to 2.5 percent than 3.0 percent per The Wall Street Journal’s Economic Forecasting Survey of more than 60 economists, which means to hit normalized levels, the CAPE would need to fall further than 35 percent.

As you ponder that and think on why it has us a tad cautious, here’s more food for thought:


Coming into 2017, forecasts called for the S&P 500 group of companies to grow their collective earnings more than 12 percent year over year, marking one of the strongest years of expected growth in some time. Granted energy companies are likely to be more of a contributor than detractor to earnings growth this year, but we as can be seen by the graph above, earnings expectations for the S&P 500 are already coming down for the current quarter. Those revisions now have year over year EPS growth for the collective at up just over 10 percent.

Are we getting data that shows the current quarter isn’t likely to break out of the low-gear GDP we’ve been seeing for most of the last few years?

Yep.

Are earnings expectations for 2Q-4Q 2017 still calling for 8.5 to 12.5 percent earnings growth year over year?

Yep.

Is it increasingly likely that President Trump’s fiscal policies won’t have a dramatic impact until late 2017 and more likely 2018?

Yep and yep.

The bottom line is we have the stock market melting higher, pulling a Stretch Armstrong-like move in terms of valuation even though earnings expectations for 2017 are starting to get trimmed back.

Yep, you can color us cautious at least for the near-term. While we continue to use our thematic foresight to ferret our companies poised to ride several of our thematic tailwinds, the current market dynamic has us being far more selective.

l

GDP and Corporate Growth

GDP and Corporate Growth

GDP and Corporate Growth

None of the four major components of the business cycle, (real income, sales, production and employment) have managed to get back to their 2007 highs, even now as we enter the fifth year of the recovery. This is truly a record, if an unfortunate one.

The chart above shows the continual stop and go pattern that has been GDP growth since the financial crisis. Never before in modern history has the U.S. experienced this many post-recession quarters without having at least one back-to-back 3% plus growth in GDP.  The first quarter of 2013 was reported on Friday April 26th to have grown by 2.5%, while the second quarter of 2013 is currently forecasted to be below 2%.

Corporate Earnings

As we head into the first quarter’s earnings season, 78% of companies have issued negative earnings preannouncements, the highest percentage of companies issuing negative earnings guidance since FactSet began tracking the data in Q1 2006.

The chart above shows in red, the percent of negative preannouncements by quarter and in green the percent of positive preannouncements with the S&P in blue. This is a troublesome trend to say the least and has us watching the market movement carefully. Eventually, stock market growth must be supported by corporate earnings growth and the trend for the past 11 quarters has been fewer and fewer positive corporate earnings surprises, as this chart clearly illustrates. The quantitative easing objective of driving up stock prices in order to create a wealth effect that leads to consumers and businesses spending more is not translating into better than expected corporate earnings.