Turning Heads I Win, Tails You Lose Inside Out

Turning Heads I Win, Tails You Lose Inside Out

For much of the current expansion, cycle investors have been forced taught to believe in a Heads-I-Win-Tales-You-Lose investing environment in which good economic news was good for equities and bad economic news was also good for equities. Good news obviously indicates a positive environment, but bad news meant further central bank intervention, which would inevitably raise asset prices.

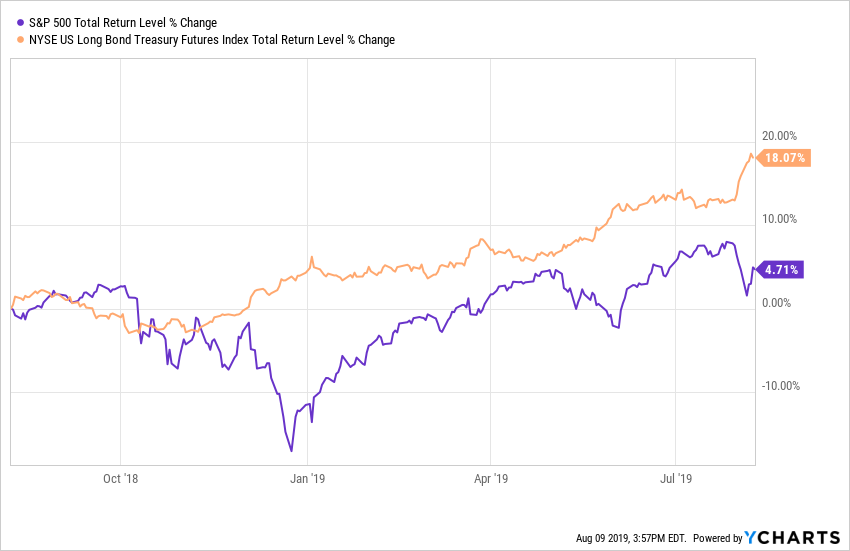
Those who didn’t buy-the-dip were severely punished. Many fund managers who dared to take fundamentals into consideration and were wary, or put on portfolio protection, saw their clients take their money and go elsewhere. An entire generation of market participants learned that it’s easy to make money, just buy the dip. That mode just may be changing as the past two weeks the major indices have taken some solid hits. Keep in mind that while the headlines keep talking up the equity markets, the total return in the S&P 500 has been less than 5% while the long bond has returned over 18%. Austria’s century bond has nearly doubled in price since it was first offered less than two years ago!

Earnings Season Summary

So far, we’ve heard from just under 2,000 companies with the unofficial close to earnings season coming next week as Wal Mart (WMT) reports on the 15th. The EPS beat rate has fallen precipitously over the past week down to 57.2%, which if it holds, will be the lowest beat rate since the March quarter of 2014. Conversely, the top line beat rate has risen over the past week to 57.4% which is slightly better than last quarter, but if it holds will be (excepting last quarter) the weakest in the past 10 quarters. The difference between the percent of companies raising guidance versus percentage lowering is down to -1.8% and has now been negative for the past four quarters and is below the long-term average.

With 456 of the 505 S&P 500 components having reported, the blended EPS growth estimate is now -0.72% year-over-year, with six of the eleven sectors experiencing declining EPS. This follows a -0.21% decline in EPS in Q1, giving us (if this holds) an earnings recession. The last time we experienced such a streak was the second quarter of 2016.

The Fed Disappoints

Last week Jerome Powell and the rest of his gang over at the Federal Reserve cut interest rates despite an economy (1) the President is calling the best ever, (2) an unemployment rate near the lowest level since the 1960s, at a (3) time when financial conditions are the loosest we’ve seen in over 16 years and (4) for the first time since the 1930s, the Fed stopped a tightening cycle at 2.5%. We have (5) never seen the Fed cut when conditions were this loose. They were looking to get some inflation going, Lord knows the growing piles of debt everywhere would love that, but instead, the dollar strengthened, and the yield curve flattened. Oops. That is not what the Fed wanted to see.

The President was not pleased. “What the Market wanted to hear from Jay Powell and the Federal Reserve was that this was the beginning of a lengthy and aggressive rate-cutting cycle which would keep pace with China, The European Union and other countries around the world,” he said in a tweet. “As usual, Powell let us down.”

The dollar’s jump higher post-announcement means that the Fed in effect tightened policy by 20 basis points. Oops2. The takeaway here is that the market was not impressed. It expected more, it priced in more and it wants more. Now the question is, will the Fed give in and give the market what it wants? Keep in mind that both the European Central Bank and the Bank of England are turning decisively more dovish, which effectively strengthens the dollar even further.

Looking at past Fed commentary, the track record isn’t exactly inspirational for getting the all-important timing right.

But, we think the odds favor a continuation of positive growth, and we still do not yet see enough evidence to persuade us that we have entered, or are about to enter, a recession.” Alan Greenspan, July 1990

“The staff forecast prepared for this meeting suggested that, after a period of slow growth associated in part with an inventory correction, the economic expansion would gradually regain strength over the next two years and move toward a rate near the staff’s current estimate of the growth of the economy’s potential output.” FOMC Minutes March 20, 2001

“At this juncture, however, the impact on the broader economy and financial markets of the problems in the subprime market seems to likely be contained.” Ben Bernanke, March 2007

“Would I say there will never, ever be another financial crisis? You know probably that would be going too far but I do think we’re much safer and I hope that it will not be in our lifetimes and I don’t believe it will be.” Janet Yellen, June 2017 (This one is going to be a real doozy)

This time around Fed Chairman Powell told us that what we are getting is a “mid-cycle policy adjustment.” Wait, what? We are now (1) in the longest expansion in history with (2) the lowest unemployment rate in over 50 years as (3) corporate leverage levels reaching record levels at a (4) time when more of it is rated at just above junk than ever before in history. This is mid-cycle? I’m pretty sure this one will be added to the above list as some serious Fed facepalming. Now I think these folks are incredibly bright, but they are just tasked with an impossible job and live in a world in which their peers believe they can and ought to finesse the economy. So far that theory hasn’t turned out all that well for anyone who doesn’t already have a good-sized pile of assets.

Domestic Economy (in summary because it is August after all)

  • We are 3-year lows for the US ISM manufacturing and services PMIs.
  • We are seeing a shrinking workweek, contracting manufacturing hours and factory overtime is at an 8-year low.
  • Just saw a contraction in the American consumer’s gasoline consumption.
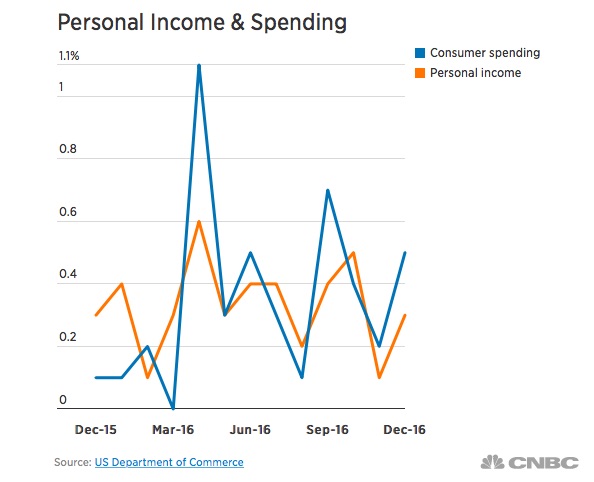
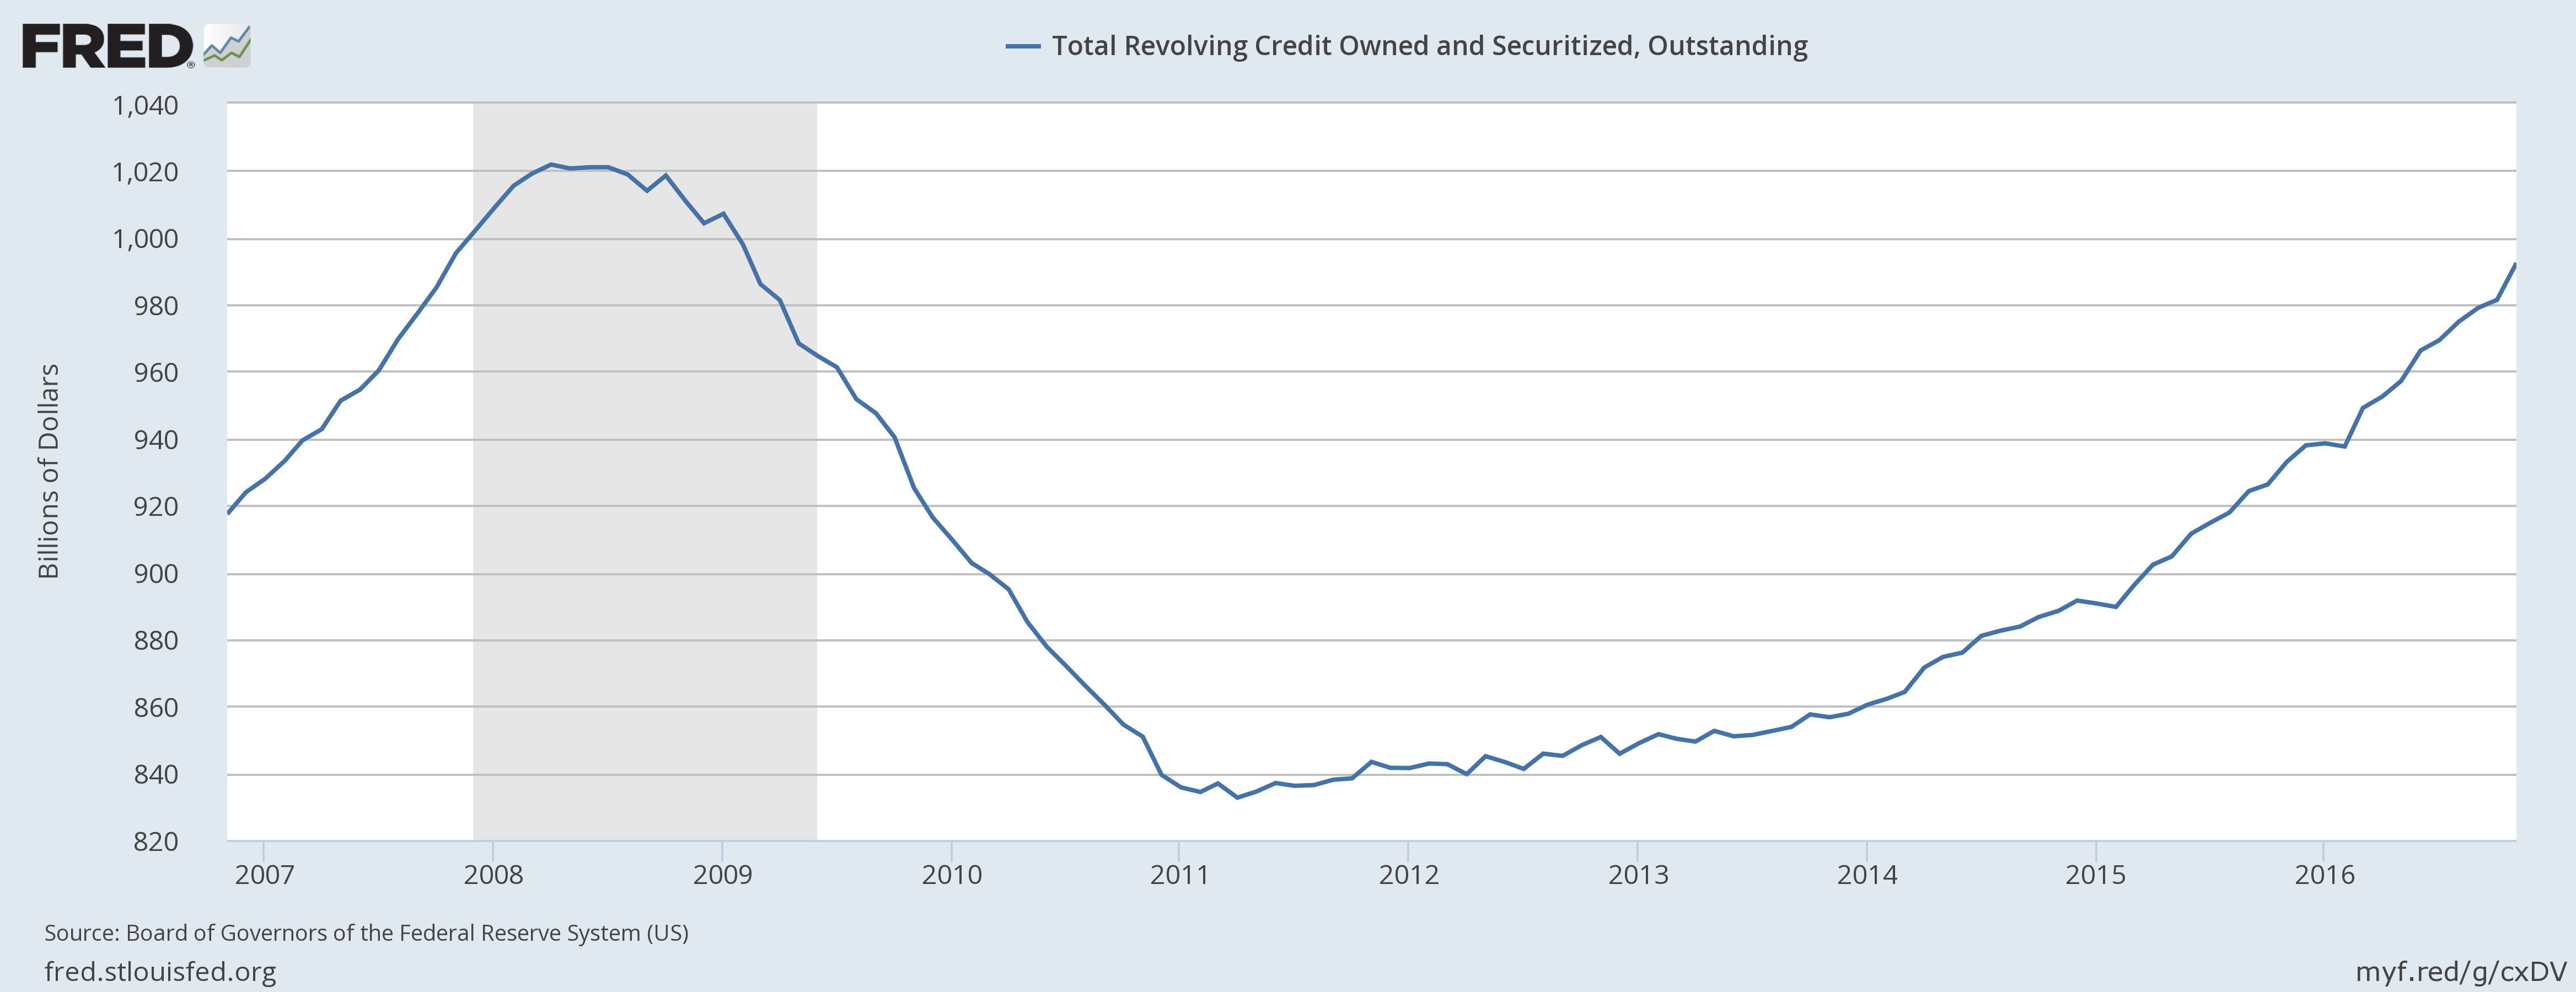
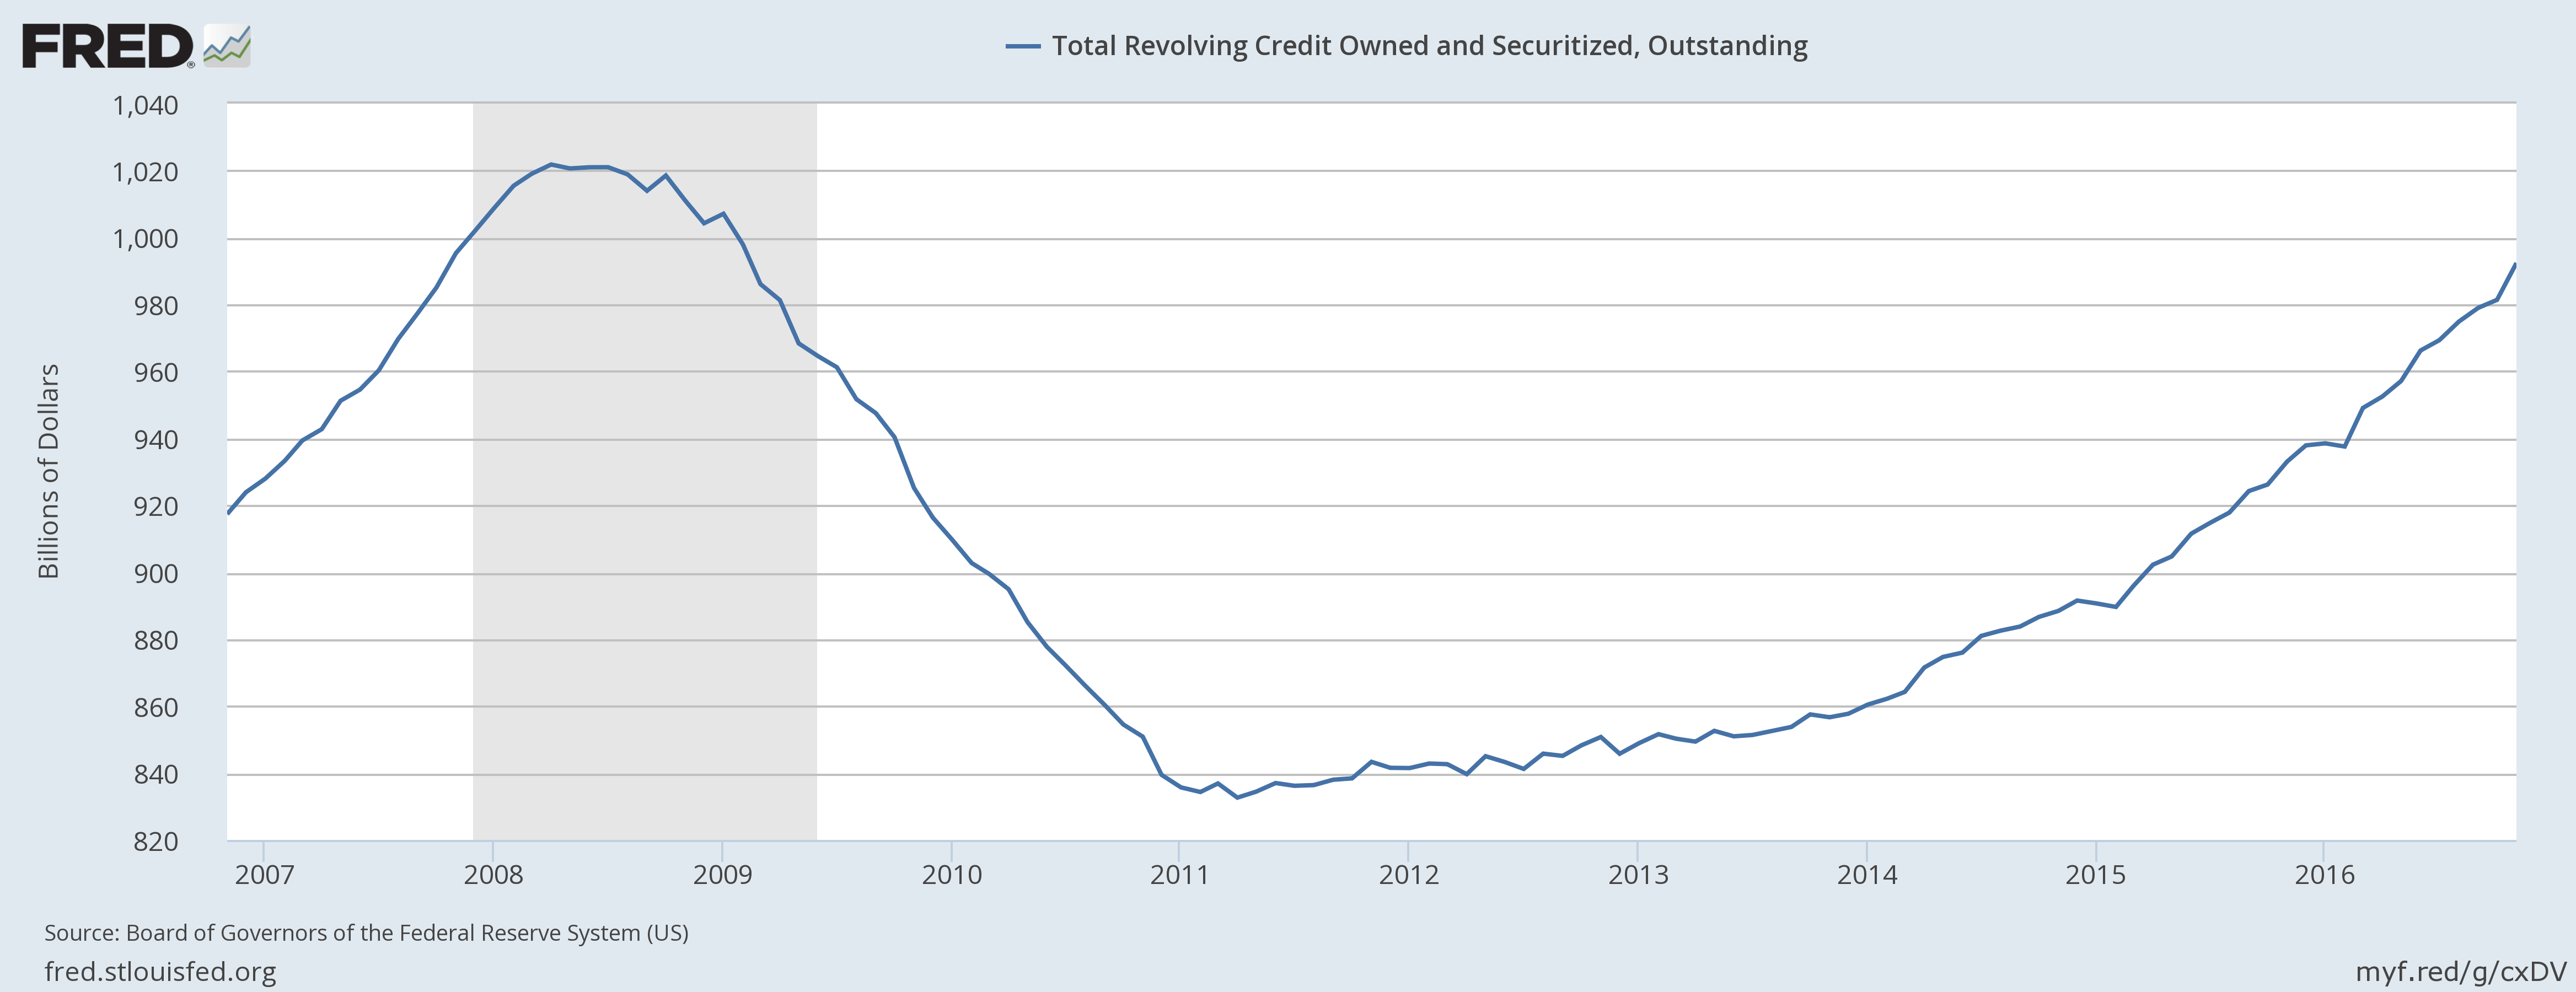
  • American households just cut their credit card balances, something that happens only about 10% of the time during an expansion. Keep in mind that Q2 consumer spending was primarily debt-fueled when looking towards Q3 GDP.
  • The Organization for Economic Co-operation and Development (OECD) Leading Economic Indicator for the US fell to a 10-year low in June, having declined for 18 consecutive months. A streak of this nature has in the past always been indicative of a recession. Interestingly that same indicator for China just hit a 9-month high.
  • The Haver Analytics adjusted New York Fed recession risk model has risen from 50% in early January to a 10-year high of 80%.

Global Economy

  • The IMF has cut world GDP forecasts for the fourth consecutive time.
  • We have 11 countries so far in 2019 experiencing at least one quarter of shrinking GDP and 17 central banks are in cutting mode with Peru the latest to cut, the Royal Bank of Australia hinting at further cuts and Mexico and Brazil likely next in line.
  • Some 30% of the world’s GDP is experiencing inverted yield curves.
  • Over half the world’s bond market is trading below the Fed funds rate.
  • Despite the sanctions on Iran and OPEC output cuts, WTI oil prices have fallen over 20% in the past year.

Europe

  • The Eurozone manufacturing PMI for July fell to 46.5, down from 47.6 in June and is now at the lowest level since the Greek debt crisis back in 2012 as employment declined to a six-year low with a decline in exports. Spain came in at 48.2, 48.5 for Italy and 49.7 for France.
  • Germany, long the economic anchor for the Eurozone and the world’s fourth-largest economy, has negative yields all the way out 30 years and about 40% of Europe’s investment-grade bonds have negative yields. The nation’s exports declined 8% year-over-year and imports fell 4.4% in June as global demand continues to weaken.
  • France had its industrial production contract -2.3% in June versus expectations for -1.6%.
  • Italy’s government is back in crisis mode as the two coalition ruling parties look to be calling it quits. Personally, I think Salvini (head of the League) has been waiting for an opportune time to dump his Five Star partners and their recent vote against European Infrastructure gave him that chance. The nation is likely heading back to the polls again at a time when Europe is facing a potential hard Brexit, so we’ve got that going for us.
  • The UK economy just saw real GDP in Q2 contract 0.2% quarter-over-quarter. Domestic demand contracted -3%. Capex fell -0.5% and has now been in contraction for five of the past six quarters. Manufacturing output also contracted -2.3% in the worst quarter since the Great Financial Crisis.

Asia

  • South Korean exports, a barometer for global trade, fell 11% year-over-year in July. The trade war between South Korea and Japan continues over Japan’s reparations for its brutal policy of “comfort women” during WWII.
  • The trade war with China has entered the second year and this past week it looks unlikely that we will get anything sorted out with China before the 2020 election. The day after Fed’s rate decision Trump announced that the US would be imposing 10% tariffs on $300 billion of Chinese goods starting September 1st. In response, China devalued its currency and word is getting out that the nation is preparing itself for a prolonged economic war with the US. The rising tension in Hong Kong are only making the battle between the US and China potentially even more volatile and risky. Investors need to keep a sharp eye on what is happening there.
  • Auto sales in China contracted 5.3% year-over-year in July for the 13th contraction in the past 14 months.
  • Tensions are rising between India and Pakistan thanks to India’s PM Modi’s decision to revoke Kashmir’s autonomy.
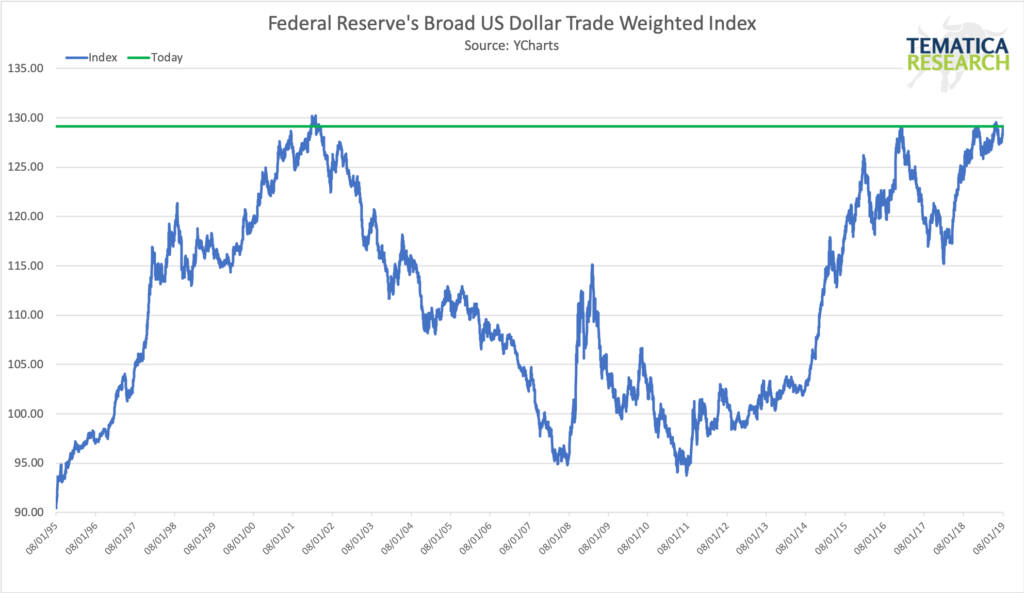
US Dollar

When we look at how far the dollar has strengthened is have effectively contracted the global monetary base by more than 6% year-over-year. This type of contraction preceded the five most recent recessions. While the headlines have been all about moves in the equity and bond markets, hardly anyone has been paying attention to what has been happening with the dollar, which looks to be poised the breakout to new all-time highs.

Reaching for new all-time highs?

A strengthening dollar is a phenomenally deflationary force, something that would hit the European and Japanese banks hard. So far we are seeing the dollar strengthen significantly against Asian and emerging market currencies, against the New Zealand Kiwi and the Korean Won, against the Canadian dollar and the Pound Sterling (Brexit isn’t helping) and China has lowered its peg to the dollar in retaliation against new tariffs in the ongoing trade war. There is a mountain of US Dollar-denominated debt out there, which is basically a short position on the greenback and as the world’s reserve currency and the currency that utterly dominates global trade. As the USD strengthens it creates an enormous headwind to global growth.

The deflationary power of a strengthening US dollar strength in the midst of slowing global trade and trade wars just may overpower anything central banks try. This would turn the heads-I-win-tales-you-lose buy-the-dip strategy inside out and severely rattle the markets.

The bottom line is investors need to be watching the moves in the dollar closely, look for those companies with strong balance sheets and cash flows and consider increasing liquidity. The next few months (at least) are likely to be a bumpy ride.

Tematica’s take on the Fed’s monetary policy statement today

Tematica’s take on the Fed’s monetary policy statement today

As expected the Federal Reserve boosted interest rates by one-quarter point putting the target range for the Fed Funds rate to 1-1/2 to 1-3/4 percent. As expected the focus was the Fed’s updated economic projections, and what we saw was a step up in growth expectations this year and in 2019, a step down in the Unemployment Rate this year and next, and no major changes in the Fed’s inflation expectations. Alongside those changes, the Fed also boosted its interest rate hike expectations in 2019 and 2020, by a

Putting all of this into the Fed decoder ring, this suggests the Fed sees the economy on stronger footing than it did in December, which is interesting given the recent rollover in the Citibank Economic Surprise Index (CESI) that is offset by initial March economic data. Even the Fed noted, “Recent data suggest that growth rates of household spending and business fixed investment have moderated from their strong fourth-quarter readings.”

Stepping back and look at the changes in the Fed’s economic forecast – better growth, employment and no prick up in inflation – it seems pretty Goldilocks on its face if you ask me, but the prize goes to Lenore, who called for the Fed to be more hawkish than dovish exiting today’s FOMC meeting. We’ll see in the coming months if forecast becomes fact. As we get more economic data in the coming months, we can expect hawkish viewers to bang the 4thrate hike drum and that means we’ll be back in Fed watching Groundhog Day mode before too long.

While the Fed and the OECD are predicting a synchronized global economic acceleration in 2018, the ECRI, (which accurately forecast the 2017 acceleration) is calling for a synchronized deceleration. We suspect that too much is expected of the impact of the tax cuts and too little is being accounted for from potential trade wars and the shifts in monetary policy.

The Fed has at least 2 more rate hikes planned, which will give us a 200 bps increase in total, the consequence of which will only be felt with a significant lag. We are also getting a roughly 100 basis point equivalent tightening from the Fed’s tapering program, which brings us to 300 basis points of tightening. That is twice the magnitude of tightening pre-1987 market collapse, equivalent to the 1994 tightening that broke Orange County and Mexico and more than what preceded the 1998 Asian crisis and the 2001 dot-com bust.

Now for Fed Chairman Powell’s first Fed news conference…


The stock market wasn’t sold on Yellen’s final FOMC press conference

The stock market wasn’t sold on Yellen’s final FOMC press conference

Yesterday the Federal Reserve, as expected, boosted interest rates by 0.25% and updated their economic projections, which included boosting its view on 2018 GDP to 2.5% from 2.1%. For 2019 and 2020, the Fed left its GDP forecast unchanged at 2.1% and 2.0%, and also signaled that it continues to expect to boost interest rates three more times in 2018.

While none of this news was a surprise, the stock market and the dollar sold-off during outgoing Fed Chair Janet Yellen’s final FOMC press conference. Perhaps it had something to do with the recent economic data that has several regional Fed banks cutting their GDP forecasts for 2017, raising questions over the Fed’s 2018 forecast?

Or it could be Yellen’s comments for continued growth past 2018, even though the Fed’s own economic projections see the economy slowing in 2019 and again in 2020?

Or it could be the fact the even though the Fed is usually an economic cheerleader, it only increased its 2018 GDP forecast by roughly half a percentage point based on FOMC members incorporating tax reform into their forecast. That’s far less of an economic bump than President Trump and others are expecting from tax reform.

Or it could be investors doing the calculus of potentially higher interest rates on ballooning consumer debt levels without any major uptick in wages. That means shrinking disposable income as consumers devote more after-tax dollars to interest payments. Not a good thing for an economy that relies on consumer spending, but from our thematic perspective it means our Cash-Strapped Consumer investing theme has legs into 2018 and beyond.

The other indicator that was rather revealing was despite the Fed’s view it could boost interest rates three times in 2018, financial stocks including the Financial Select Sector SPDR Fund (XLF) sold off, while gold ticked higher. Looking at the flattening yield curve helps explain the why behind this move lower in financials, and in our view the natural hedge offered by gold, a Scarce Resource theme contender if there ever was one, was welcomed given not only Yellen’s mixed comments but the market’s sky-high valuation of more than 20x expected 2017 earnings.

And with that, we bid adieu to Janet Yellen and get ready to welcome in new Fed chair Jerome Powell, who is likely to be more of the same – a consensus builder that is not likely to rock the Fed’s dovish bent. Yellen didn’t have a recession to contend with during her tenure, but given the length of the current business cycle, odds are Powell will have to deal with one. To us here at Tematica that means we are likely to see at least a few interest rate hikes in the coming year.


Consumers Spend More in December, But Ouch Those Revolving Debt Levels Sure Could Hurt

Consumers Spend More in December, But Ouch Those Revolving Debt Levels Sure Could Hurt

This morning the US Bureau of Economic Analysis published its take on Personal Income & Spending for December. We’re rather fond of this monthly report given the data contained within and the implications for several of our investment themes, including Cash-strapped Consumers as well as Affordable Luxury and the Rise & Fall of the Middle Class. 

So what did the December report show?

Personal Income rose 0.3 percent, far faster than in November, but still below the 0.4-0.5 percentage gains registered in September and October. We saw the same pattern with Disposable Income (which is a better barometer for discretionary spending), as one would expect to see during the holiday shopping laden month of December.

That’s as good a segue as any to remind our readers that holiday shopping during November and December came in stronger than the National Retail Federation had forecasted. The final tally was a year over year increase of 4.0 percent compared to the NRF’s 3.6 percent forecast.

Now you’re probably saying to yourself, “How can that be given all the bad news that we’ve been hearing from Macy’s (M), Target  (TGT), Kohl’s (KSS), Sears (SHLD) and other brick and mortar retailers?”

To be honest, we doubt the average person would have thrown in the “other brick and mortar retailers” part, but we know our readers are smarter than the average bear.

The answer to that question is that non-store sales, Commerce Department verbiage for e-tailers like Amazon (AMNZ), eBay (EBAY) and digital Direct to Consumer business like those found at Macy’s, Under Armour (UAA), Nike (NKE) and other retailers, rose 12.6 percent year over year to $122.9 billion. We certainly like those stats as they confirm several aspects of our Connected Society investing theme, but we would argue a more telling take on the data is that non-store sales accounted for 19 percent of holiday shopping in 2016, up from 17 percent the year before. Nearly one-in-five shopping dollars was spent through online or mobile shopping.

We’ll get a better sense of this shift, which we only see as accelerating, later this week when both United Parcel Service (UPS) and Amazon report their quarterly results for the December quarter. Team Tematica will also be listening to Direct to Consumer comments from Under Armour and other apparel and footwear companies as they too report quarterly results over the next few weeks.

Now let’s take a look at December Personal Spending – it rose 0.5 percent, a tick higher than was expected. Given the NRF data above, it was rather likely we were going to get a better print vs. expectations.

In combining both the income and spending data for the month, we get the savings rate, which fell to 5.4 percent, a five-month low. Compared to a few years ago, that savings level looks rather solid even though it’s well below the longer-term trend line. What we do find somewhat disconcerting, given the prospects for the Fed to boost interest rates up to three times this year after only doing so just two times in the last two years, is the amount of revolving consumer debt outstanding. As evidenced in the graph below, those levels have continued to climb steadily higher during 2015 and 2016.

Should interest rates move higher in 2017, the incremental interest expense could crimp consumer wallets, reducing their disposable income in the process. To us, that could mean less Affordable Luxury or even Guilty Pleasure spending as more become Cash-strapped Consumers.

Michael Jordan and the B-Ball Inequality

Michael Jordan and the B-Ball Inequality

MKI know that this may come as a surprise to many of my regular readers, but I have a confession to make.  Michael Jordan is a better basketball player than I.  This basketball skill spread needs to be addressed. He shouldn’t be that much better than I. It isn’t fair.  No matter how much I practice, no matter what coaching I get, no matter how hard I train in the gym and follow a strictly regimented diet, he will always be better than I.  Unfortunately for Mike, the only way to address this issue, (given that there is a clear cap to my potential at 5’8″ with a proportional wingspan and at best, only slightly better than average springs) is to handicap him.  Now wouldn’t the world be a better place if the difference in our abilities were materially reduced?

You probably get where I’m going with this.  Before anyone gets into a tizzy and starts making all kinds of accusations about how mean and uncaring I am.  There is a serious problem today with respect to income, but the problem, thus the cure, isn’t what is preached in the popular media.

The billionaires at Davos, in what can only be described as irony of epic proportions, all agreed that “Severe income inequality” is one of the top 10 global risks of greatest concern for 2014.  You can read the report here.

So let’s break this problem down.  When people talk about income inequality there is a knee-jerk assumption that by definition, income inequality is bad, which in reality is quite destructive to society as a whole.  It intuitively doesn’t make sense that as a society we should strive to have income equality where regardless of what value an individual generates, income ought to be equal.  The guy who chooses to work 3 days a week sweeping floors at the local Walmart clearly should not enjoy the same income as Steve Jobs! So some degree of income inequality is Ok, right?  But not too much?  Hmmm, ok, then how much?  Who gets to decide how much is too much and how do they make that determination?  Then how do they enforce it? How do we trust that the person we give such enormous power to won’t abuse that power?  For argument’s sake let’s say they don’t.  What about their successor?  How likely is it that we continue to have only angelic geniuses that are able to manipulate society into a Utopian income spread without ever falling prey to corruption and graft?  So far the record throughout history doesn’t lead one to believe that is it all likely.

I spend a great deal of my time in Italy, where I sadly witness first-hand the awful consequences of this sort of societal structure.  If I get paid roughly the same amount whether I work my tail off and take risks trying to improve my performance or if I put in essentially the bare minimum level of effort, why try?  I see this everywhere.  Incredibly bright people who could be innovating like crazy, coming up with all kinds of solutions that would benefit their companies and eventually their nation are beaten down by a system that provides no incentive for those who really try to do something great.  Those who are naturally innovators want desperately to try new things, take risks, but for them there is only downside risk.  They can’t improve their income level through hard work and risk taking.  They only risk annoying their colleagues and supervisors by trying to improve things.  Status quo is the rational choice.  Notice the level of innovation coming out of Italy and its rate of growth!?

I sit at dinner and hear the agony in my friend’s voices as they vent their frustrations and their anger at how a colleague who does very little gets paid roughly the same as they do.  This type of structure infects relationships because it forces people to live in a lie, a lie which is painfully obvious to everyone. The guy who barely shows up to the office and only does the bare minimum knows that the guy who’s working his tail off, (he can’t help but try as innovation is in his DNA) is angry that they both get paid roughly the same.  They both are aware of the resentments, but are powerless to do anything about it because society tells them that this is a far better way to live.  It is more fair. What the hell?  More fair that those who are willing to sacrifice and take risks are basically barred from enjoying any benefit from doing so?  My Italian friends all talk wistfully about how great it would be to work in the U.S. where at least there they can hope to get rewarded for accomplishing something great.

As for the U.S., I struggle to see where this horrific trend we keep hearing about is evidenced.  The table below is from an excellent study by Alan Reynolds of the Cato Institute.  You can read the entire report here. The data does not prove out the claims, at least in the U.S..  The bottom two quartiles and the top quartile enjoyed nearly the same increase in income on a percentage basis from 1989 – 2007.  From 2007 – 2010, the bottom quartile experienced a rise in income, while all others experienced a decline.

Now where is inequality a problem?  Barriers and disincentives to improve one’s lot in life ARE problems.  Subsidies such as those in the Affordable Care Act put the poor in a veritable poverty trap in that as they work to improve their situation, the subsidies are taken away at such a pace as to make them far better off overall working less.  That is both demeaning to the individual and immoral in that it forces others to eternally be enslaved to subsidize their fellow citizen, despite the reality that the guy being subsidized may desperately want to get out of his situation, but is faced with overwhelming incentives that keep him dependent, resentful and demoralized.

There is also something horribly wrong with a system in which savers are punished through financial repression.  The Federal Reserve, by keeping interest rates low, forces savers to go into inappropriately risky investments just to try and get a reasonable return.  Those who are already wealthy and are able to invest heavily in the stock market enjoy out-sized returns courtesy of the Fed’s QEInfinity as evidenced by the 90% correlation between the Fed’s balance sheet and the stock market starting in 2008.  Previously the correlation was essentially 0!

The free market system is far from perfect, full of all kinds of flaws, but it is infinitely better than anything else out there.  There are no angelic, omniscient bureaucrats that can manipulate our world into a more Utopian state.  Be wary of any who claim they can.

Interest Rates and National Debt

Interest Rates and National Debt

Interest-Rates-and-National-DebtThe Federal Reserve has been under considerable pressure to provide details for just how it will control all the excess liquidity that it has created through quantitative easing. The Fed’s balance sheet, which can roughly be thought of as a proxy for the potential money supply, is almost 2.4 times the size it was in 2007. Last month I discussed how excess bank reserves have skyrocketed to nearly $1.7 trillion after having historically averaged near zero since the inception of the Federal Reserve. The Fed has argued that it will be able to slowly raise interest rates and carefully reign in those excess funds to prevent rampant inflation. This is something that has never in history been accomplished, so there is no clear roadmap for how to do this successfully, but for argument’s sake, let’s assume that the Fed is indeed capable. The question then becomes, “How will rising interest rates affect the economy and investing?” One of the largest impacts of rising interest rates will be on the financials of the federal government. The chart above shows the U.S. National Debt from 1950 to 2012 (left hand axis) and the annual deficit/surplus (right hand axis). The current national debt is over $16 trillion. Over the past 5 years, the annual deficit has averaged $1.4 trillion. The national debt as a percent of GDP is almost double what it was in 2007. The annual deficit is 9 times the size it was in 2007. The recent sequester cuts sent D.C. into apoplectic fits with dire warnings of impending doom, however those “cuts”, according to the Congressional Budget Office, represented a decrease in the amount of spending increase that is less than the total increase, which means there will still be an increase in net spending after the sequester, (see Congressional Budget Office “Final Sequestration Report for Fiscal Year 2013” published March 2013). Given the emotional hoopla and doomsday rhetoric, it is reasonable to assume that the current level of deficit spending is unlikely to decrease significantly anytime soon.

The current 10 year Treasury interest rate is about 1.8%. It reached its lowest level in July 2012 at 1.53% and the highest rate was 15.32% in September 1981 when Paul Volker put the kibosh on inflation. The historical average rate has been about 4.6%. The current annual interest payment on the debt is just over $220 billion. If interest rates were to rise to only the historical average of 4.6%, that would be an increase of 2.8%, which would be an increase of nearly $110 billion, if we assume for simplicity that all the new issuance is a 10 year terms. (The reality is that some would be shorter term, some would be longer, and this is just meant to give an approximation to illustrate the magnitude of the impact.) That means interest expense on the debt would increase a whopping 50% in the next year. If the deficit spending continued at about the same rate for the next 6 years, annual debt interest payments would become the government’s costliest expense by 2020. For every year that we continue to deficit spend, increasing the national debt, the magnitude of the impact of rising interest rates increases.

That puts the Federal Reserve into quite a pickle if the economy does in fact gets some legs and inflation ignites. Don’t raise rates and face punishing inflation. Raise rates and D.C. is going to be put under even more pressure to reduce spending. No wonder Chairman Ben Bernanke has been giving subtle indications that he isn’t keen on yet another term as Chairman!

Federal Reserve and National Debt

It took the federal government around 200 years to accumulate a trillion dollars in debt. Within the following decade it tripled that number, then doubled it again in just twelve years, and doubled it again in another 8 years. Overall the national debt has increased sixteen-fold in just 30 years. Incidentally, this period coincides with the complete delinking of the U.S. currency to the gold standard.

So how are we managing all this debt? In 2013 the Federal Reserve will buy approximately 90% of the country’s issuance of Treasuries and mortgage bonds! That’s one way to explain how a nation facing such a growing mountain of debt, a slowing to stalling economy, and a paralyzed political process is able to maintain such incredibly low interest rates. Treasuries have long been used as the standard for the risk-free rate. With only 10%
of the issuance to float freely in the market, the Fed is able to generate considerable demand for this “risk-free” asset class, driving prices up, which means driving interest rates down.

The massive distortions from the various Quantitative Easing programs have damaged the market mechanisms for understanding the true price of risk, which gives markets an understanding of the appropriate cost of capital. A market that no longer can obtain this information has a big problem, because mispricing of risk leads to misallocation of capital.

The proverbial saying goes that markets love to climb a wall of worry. We’ve seen corporate earnings and revenue growth slow sharply through the past year, with corporate guidance for future performance continuing to be rather grim, yet equities have had quite a run. This is due to expanding P/E multiples as we discussed in last month’s newsletter. This expansion is 85% correlated to the Fed’s ongoing balance sheet expansion, as it is now adding about $85 billion of relatively secure fixed income securities to its $3 trillion portfolio on a monthly basis. Such an enormous level of buying in the markets, leaving only 10% of new issuance available for purchase, is forcing investors into other assets, pushing up prices.

How is this level of Fed activity going to end? David Rosenberg of Gluskin Sheff described the situation well by saying,

“I am concerned over the unintended consequences of these experimental policy measures that have no precedence, but perhaps these consequences lie too far ahead in time from a ‘tactical’ sense, but we should be aware of them. The last cycle was built on artificial prosperity propelled by financial creativity on Wall Street and this cycle is being built on an abnormal era of central bank market manipulation.” January 17th, 2013.

Bottom Line: When one looks over the past 12 years of active Federal Reserve monetary policy in which we experienced repeated bubbles followed by painful pops, why does anyone believe this time will be different? Particularly when this time we experienced monetary activism on an unprecedented scale: we are truly in uncharted waters.

The New, New Normal

I’m fairly certain that when the G20 convened, many of the attendees believed that as a result of their high-minded meetings, some brilliant announcement would be given to the markets and once again the world would be deemed safe, at least for a little while.  Instead, the Cannes meeting ended with no solutions and not even a pledge to find solutions. Is this the new normal?  Papandreou is on his way out, which means the odds for passage of the latest rescue plan are improving, but at this point, that means very little for long-term Greek prospects.

Last week the ECB reversed its rate increase from earlier this year, cutting short-term lending rates by 25 basis points to 1.25%.  This should hardly come as a surprise with the Eurozone economy deteriorating at a faster pace than was expected.  Markit, a global financial information services company, reported that Eurozone GDP fell at a quarterly rate of 0.5% in October with little chance for a pick up in the near term.  Output fell and new order inflows contracted at the fastest pace since June 2009.  Eurozone PMI fell to a 28 month low of 46.5 in October, dropping from 49.1 in September.  This is the sharpest drop since November 2008.

In Germany, whose strength has been keeping Europe afloat, industrial production dropped 2.7% in September, on the heels of a 0.4% drop in August.  German factory orders dropped 4.3% in September.

One of the most concerning trends last week was the rise in Italian bond yields, with the 10 year soaring at one point to 6.64% while at the same time German bund yields dropped 2 basis points to 1.79%.  Italy is rapidly approaching the levels that pushed Greece, Ireland and Portugal into bailout mode, but this time the stakes are markedly higher.  Italy’s economy is the 8th largest in the world and its bond market is the third largest!  That’s a bigger problem that all the aforementioned nations combined and it is highly unlikely that Berlusconi’s majority government will survive.  Contagion anyone?  Over the weekend Italy rejected an offer for IMF assistance, but conceded to intensive monitoring with published quarterly fiscal results.  Talk about too little too late!

It is amazing to think that just 11 days ago, on October 27th, the market soared on promises that the EFSF would magically be expanded and levered up by some as yet still unidentified sources and all would be well in the world!  Once again, China was touted as being keen on getting involved.  Is anyone really surprised at this point that they aren’t?  Then in what can only be described as irony on a global scale, the ECB left China after being rejected and headed over to Japan, who debt to GDP is nearing a mind-boggling 228%, with hat in hand looking for support.  That’s like going to the neighborhood crack dealer in search of rehab options!

Italy is now clearly being targeted as the next bailout candidate, but there just isn’t enough firepower to handle the land of linguine.  It needs to refinance $413 billion in the coming year with market rates currently at levels that it simply cannot afford.  How much more can the ECB take on?  They’ve already bought over $100 billion of Italian bonds since August, with very little impact on yields.

Greece’s default appears more likely and more imminent that ever before and there are entirely too many under-capitalized European banks, which means, systemic risk.  This coming at a time when Italy, (remember that this is the 8th largest economy in the world) will need to refinance $413 billion!  Ah fusilli!

For anyone who thinks that Europe’s woes won’t creep across the pond, keep in mind that between 15% and 20% of S&P500 sales and exports are derived from Europe.  Europe is also China’s largest export market, so this has significant global implications outside of the danger to credit markets.

Bottom line – there is no end in sight to the Eurozone debt crisis and the U.S. will not go unscathed.  To make it even more exciting, countries responsible for half of global GDP will be holding elections in the next year, and we all know how candidates love to take advantage of a crisis and stir the pot!  Volatility and fear will be the norm.  Invest accordingly.

How and Why of Greek Debt

How and Why of Greek Debt

When a nation has more debt than it can manage, it has two options (1) inflate its way out by printing more money or (2) restructure the debt.

Typically the most politically feasible solution is to inflate.  Generally wages tend to keep up to some degree with inflation, so the employed feel as if they are getting a raise and don’t gripe too much.  Those in the population who have debts prefer inflation as the relative “cost” of their debt decreases over time, e.g. with 5% inflation, debt declines in real terms by 5% every year.  It is the savers who suffer most as they watch inflation eating away at what they’ve built – in a converse to inflation reducing debt, savings declines in value by 5% every year.  This is why inflation is often referred to as a hidden tax.

The Europeans cannot inflate their way out of too much debt for the PIIGS as the U.S. is way ahead of them in the race to the bottom and they have conflicting needs across countries.  A monetary union without a political, fiscal and cultural union is complicated at best.  So why the continued kick the can?  The largest banks (German Deutsche Bank, the French BNP Paribas, Société Générale and Crédit Agricole SA among many others) have not increased their reserve capital, which would dilute shareholders, and do not want to take losses on their significant holdings of PIIGS bonds.  The euphemistic “restructuring” of these bonds would by definition require some sort of write down in value for the banks.http://www.insidermonkey.com/blog/wp-content/uploads/2011/06/Who-holds-Greek-debt.jpg

Bank’s hold these bonds as assets on their balance sheets.  They are required to maintain a certain level of assets relative to the amount of loans they give.  If the value of their assets were to suddenly drop, they could find themselves in violation of the regulations concerning this ratio.  As you can imagine – that is not good for the banking sector and lending!  We saw the last time this occurred the credit markets effectively shut down, any type of borrowing was nearly impossible, and the engine of the global economy geared way down.

So how did the U.S. get out of the bog in which the Eurozone is currently mired?  In the Spring of 2009, the U.S. banks were eventually forced to raise hard common equity that was then used to absorb losses on loans.  The fixed income market did bottom out in the Fall of 2008, but when banks sought this equity, their stocks did not wither on the vine, albeit life wasn’t exactly rosy.  Rather than taking this approach, the International Monetary Fund (IMF), the European Central Bank (ECB) and the German and French banks are giving Greece just enough liquidity to roll their debt, not the permanent equity investments that were made here in the U.S.  The Euro approach is just a temporary patch on a cracking dam.  Only when the European banks raise equity, as we did here, and the PIIGS debt is restructured will there be a true resolution.

What does Fiscal or Monetary Policy mean?

What does Fiscal or Monetary Policy mean?

We hear a lot of talk about which government policies can help get the economy back on its feet. I thought I’d provide a quick cheat sheet on just what these various terms actually mean.

This chart shows the complete list of tools that the federal government has to affect the economy.  There are two main types of policy, monetary and fiscal.  When you hear monetary policy think Federal Reserve.  When you hear fiscal policy, think IRS and federal spending.

The Federal Reserve can alter two things to affect the economy, the Fed Funds rate and the Money Supply.

Interest Rates:  The Federal Funds target rate is the interest rate at which private depository institutions, (mostly banks) lend the funds they hold at the Federal Reserve to each other, generally overnight.  It can be thought of as the rate banks charge each other.  This target rate is identified in a meeting of the members of the Federal Open Market Committee which usually meets eight times a year.  The New York Fed affects this rate by trading government securities.

Money Supply:  The Federal Reserve typically alters the money supply by increasing or decreasing bank reserves.  (See prior post on Fractional Reserve Banking for details on bank reserves.)

Tax and Spend:  What else need be said?  Fiscal policy involves the government increasing or decreasing taxes and the amount of federal spending, which let’s face it, pretty much just goes up.