Weekly Issue: September Looks Like a Repeat of August

Weekly Issue: September Looks Like a Repeat of August

Key points inside this issue

  • We are establishing a buy-stop level at 9.50 for shares of Veeco Instruments (VECO), which will lock in a profit of at least 13% on this short position.
  • The Hershey Company: Tapping into Cleaner Living with M&A


We ended a volatile August… 

Stocks rebounded from some of their recent losses last week as trade tensions between the U.S. and China appear to have cooled off a bit. For the month of August in total, during which there seemed to be one market crisis after another, most of the major stock market indices finished down slightly. The outlier was the small-cap heavy Russell 2000, which shed around 5% during the month.

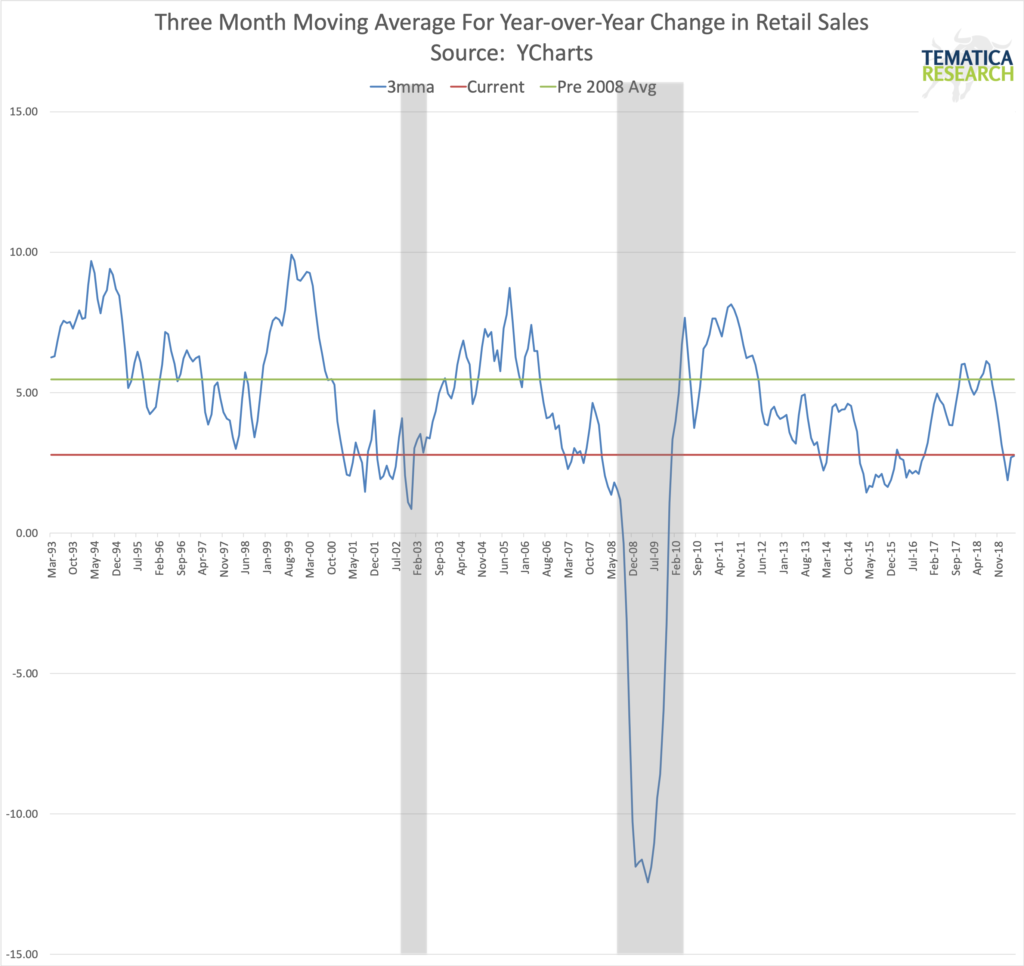
Looking back over the last few weeks, the market was grappling with a number of uncertainties, the most prominent of which was the announced tariff escalation in the U.S- China trade war. There were other uncertainties brewing, including the growing number of signs that outside of consumer spending, the economy continues to soften. We saw that consumer strength in Friday’s July Personal Income & Spending data, but also in the second June-quarter GDP revision that ticked down to 2.0% from 2.1%, even though estimates for consumer spending during the quarter rose to 4.7% from 4.3%. I would note that 4.7% marked the strongest level of consumer spending since the December 2014 quarter. We are, however, seeing a continued shift in where consumers are spending — moving from restaurants and department stores to quick-service restaurants and discount retailers as well as online. This raises the question as to whether the economy is prepared to meet head-on our Middle Class Squeeze investing theme?

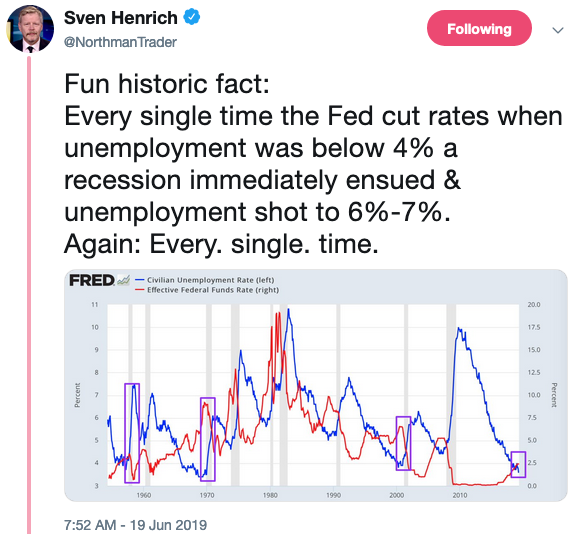
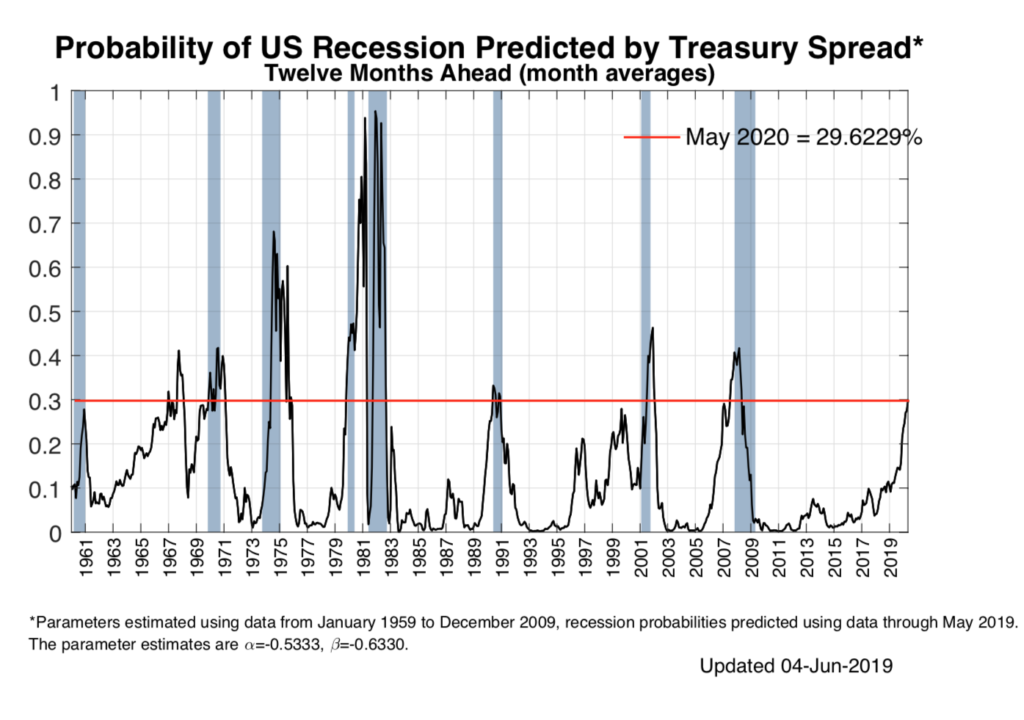
Another issue investors grappled with as we closed out August was the yield curve inversion. While historically this does raise a red flag, it’s not a foregone conclusion that a recession is around the corner. Rather it can be several quarters away, and there are several stimulative measures that could be invoked to keep the economy growing. In other words, we should continue to mind the data and any potential monetary policy tweaking to be had.

Closing out August, more than 99% of the S&P 500 have reported earnings for the June-quarter season. EPS for that group rose just under 1%, which was far better than the contraction that was lining up just a few weeks ago. Based on corporate guidance and other factors, however, EPS expectations for both the September and December quarters have been revised lower. Some of this no doubt has to do with the next round of tariffs that took effect on Sept. 1 on Chinese imports, but we can’t dismiss the slowing speed of the global economy either.

That overall backdrop of uncertainty helps explain why the three best-performing sectors during August were Utilities, Real Estate and Consumer Staples. But as we saw in the second half of last week, a softer tone on the trade war led investors back into the market as China said it wished to resolve the trade dispute with a “calm” attitude.

Without question, investors and Corporate America are eager for forward progress on the trade war to materialize. While there have been several head fakes in recent months, we should remain optimistic. That said, we here at Tematica continue to believe the devil will be in the details when it comes to a potential trade agreement, and much like deciphering economic data, it will mean digging into that agreement to fully understand its ramifications. Those findings and their implications as well as what we hear on the monetary policy front will set the stage for what comes next. 


… and it looks like more ahead for September

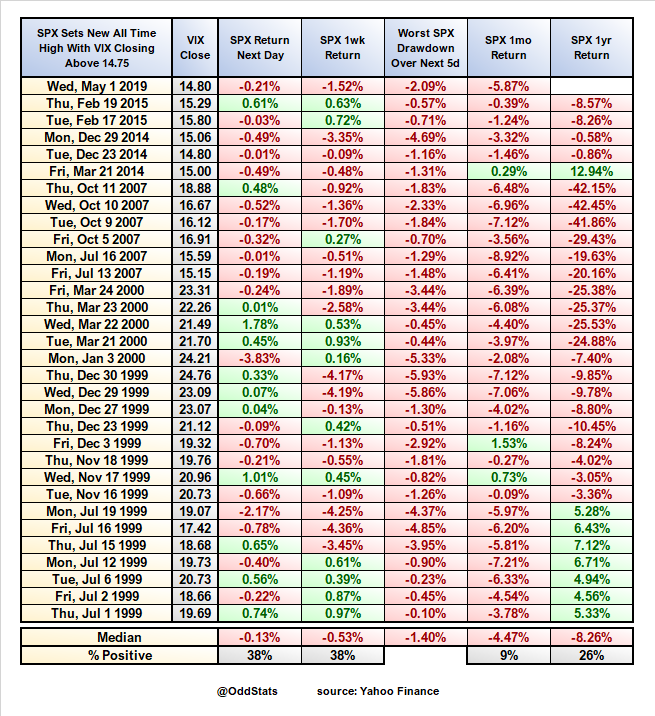
This week kicks off the last month of the third quarter of 2019. For many, it will be back to work following the seasonally slow, but volatile last few weeks of summer. The question to be pondered is how volatile will September be? Historically speaking it is the worst calendar month for stocks and based on yesterday’s performance it is adhering to its reputation.

As a reminder, on Sept. 1 President Trump authorized a tariff increase to 15% from 10% on $300 billion in Chinese imports, many of which are consumer goods such as clothing, footwear and electronics.  As we saw, that line in the sand came and went over the holiday weekend and now Trump is once again rattling his trade saber, suggesting China should make a deal soon as it will only get worse if he wins the 2020 presidential election.

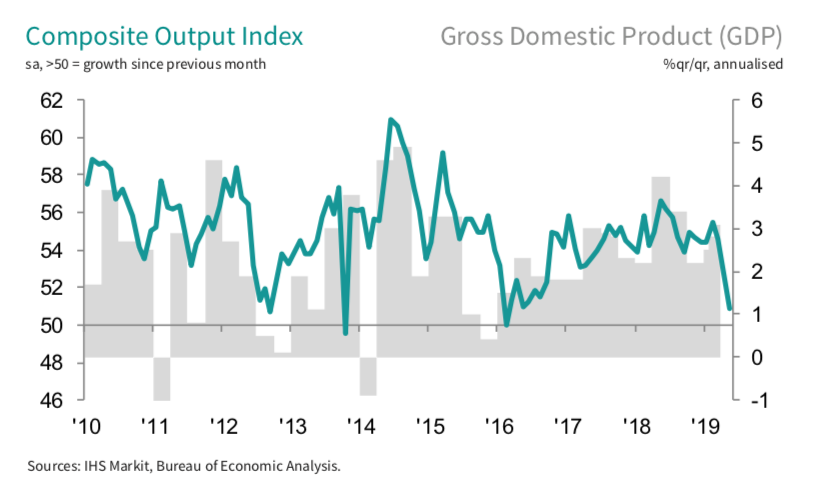
In addition to that, yesterday morning we received the one-two punch that was the August reading on the manufacturing economy — from both IHS Markit and the Institute of Supply Management. The revelation that manufacturing continued to slow weighed on stocks yesterday. The direction of Tuesday’s official data, however, was not a surprise to us given other data we monitor such as weekly rail car loadings, truck tonnage and the Cass Freight Index.  But as I have seen many a time, just because we are aware of something in the data doesn’t mean everyone is. 

What I suspect has rattled the market as we kick off September is the August ISM Manufacturing Survey, which showed the U.S. manufacturing sector declined to 49.1 in August. That is the lowest reading in about three years, and as a reminder, any reading below 50 signals a contraction. Data from IHS Markit also released yesterday showed the U.S. manufacturing PMI slowed to 50.3 in August, its lowest level since September 2009. Slightly better than the ISM headline print, but still down. Digging into both reports, we see new orders stalled, which suggests businesses are not only growing wary of the trade uncertainty, but that we should not expect a pickup in the month of September.

In my view, the more official data is catching up to the “other data” cited earlier and that more than likely means downward gross domestic product expectations ahead. It will also lead the market to focus increasingly on what the Fed will do and say later this month. I also think the official data is now capturing the weariness of the continued trade war. The combination of the slowing economy as well as the continued if not arguably heightened trade uncertainty will more than likely lead to restrain spending and investment in Corporate America, which will only add to the headwinds hitting the economy. 

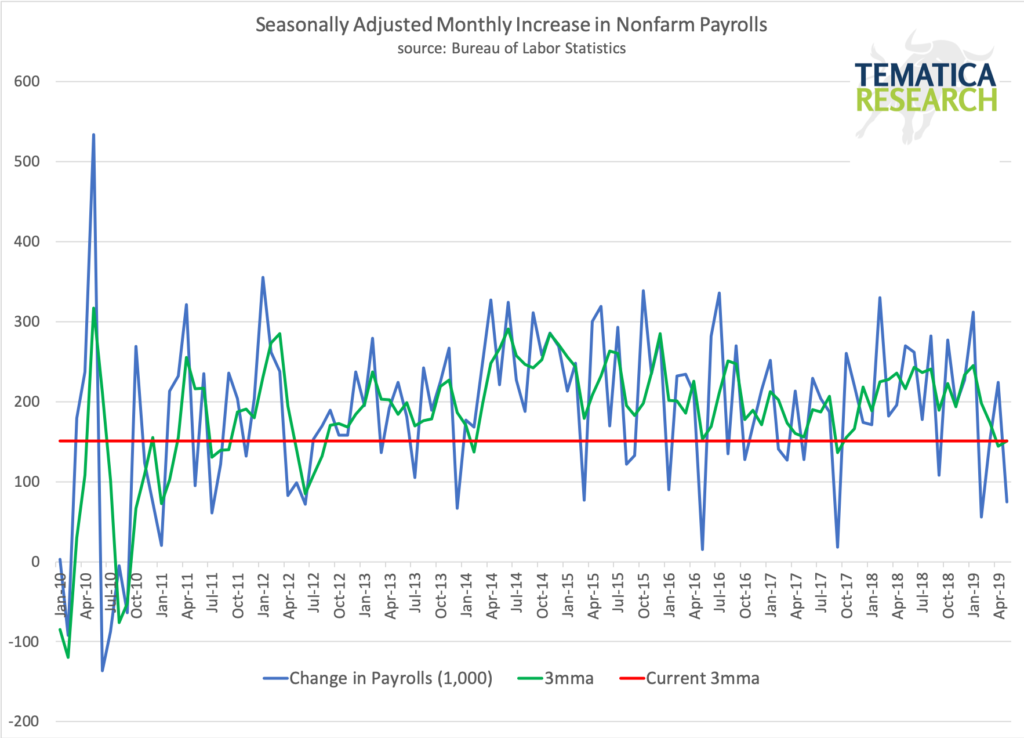
Taking those August manufacturing reports, along with the data yet to come this week – the ISM Non-Manufacturing readings for August, and job creation data for August furnished by ADP and the Bureau of Labor Statistics — we’ll be able to zero in on the GDP taking shape in the current quarter. I would note that exiting last week, the NY Fed’s Nowcast reading for the September quarter was 1.76%, below the 2.0% second revision for June-quarter GDP. There is little question that given yesterday’s data the next adjustment to those forecasts will be lower. 

Adding to that view, we’ll also get the next iteration of the Fed’s Beige Book, which will provide anecdotal economic commentary gathered from the Fed’s member banks. And following the latest data, we can expect investors and economists alike will indeed be pouring over the next Beige Book.

No doubt, all of this global macro data and the trade war will be on the minds of central bankers ahead of their September meetings. Those dates are Sept. 12 for the European Central Bank (ECB) followed by the Fed’s next monetary policy meeting and press conference on Sept. 16-17. Given the declines in the eurozone, the ECB is widely expected to announce a stimulus package exiting that meeting, and currently the CBOE FedWatch Tool pegs a 96% chance of a rate cut by the Fed. With those consensus views in mind, should the economic data paint a stronger picture than expected it could call into question those likelihoods. If central banker expectations fail to live up to Wall Street expectations, that would more than likely give the stock market yet another case of indigestion. 

All of this data will also factor into earnings expectations. Earlier I mentioned some of the more recent revisions to the downside for the back half of 2019 but as we know this is an evolving story. That means effectively “wash, rinse, repeat” when it comes to assessing EPS growth for the S&P 500 as well as individual companies. And lest we forget, companies will not only have to contend with the effect of the current trade war and slowing economy on their businesses, but also the dollar, which as we can see in the chart below has near fresh highs for 2019. 

The biggest risk I see over the next few weeks is one of economic, monetary policy and earnings reality not matching up with expectations. Gazing forward over the next few weeks, the growing likelihood is one that points more toward additional risk in the market. We will continue to trade carefully in the near-term and heed what we gather from the latest thematic signals.


The Thematic Leaders and Select List

Over the last several weeks, the market turbulence led several positions, including those in Netflix (NFLX), Dycom (DY) and International Flavors & Fragrances (IFF) — on both the Tematica Leader board and the Select List to be stopped out. On the other hand, even though the overall markets took a bit of a nosedive during August, several of our thematic holdings, such as USA Technologies (USAT), AT&T (T), Costco Wholesale (COST), McCormick & Co. (MKC) and Applied Materials (AMAT) to name a few outperformed on both an absolute and relative basis.

Even the short position in Veeco Instruments (VECO) has returned nearly 18% since we added that to the Select List last March. That has been a particularly nice move, but also one that is playing out as expected. Currently, we have do not have a buy-stop order to protect us on our VECO position, and we are going to rectify that today. We are establishing a buy-stop level at 9.50 for shares of Veeco Instruments (VECO), which will lock in a profit of at least 13% on this short position. 

  • We are establishing a buy-stop level at 9.50 for shares of Veeco Instruments (VECO), which will lock in a profit of at least 13% on this short position.


The Hershey Company: Tapping into Cleaner Living with M&A

When we think of The Hershey Company (HSY) there is little question that its candy, gum and mints business that garnered it just over 30% of the US candy market lands its squarely in our Guilty Pleasure investing theme. Even the company itself refers to itself as the “undisputed leader in US confection” and we look at its thematic scorecard rankings, its business warrants a “5”, which means nearly all of its sales and profits are derived from our Guilty Pleasure theme. 

Not exactly a shock to even a casual observer. 

But as we’ve discussed more than a few times, consumers are shifting their preferences for food, beverages and snacks to “healthier for you” alternatives. These could be offerings made from organic or all-natural ingredients, or even ingredients that are considered to promote better health, such as protein over sugar. Recognizing this changing preference among its core constituents, Hershey hasn’t been asleep at the switch, but rather it has been making a number of nip and tuck acquisitions to improve its snacking portfolio, which aligns well with our Cleaner Living investing theme. 

These acquisitions have played out over a number of years, starting with the acquisition of the Krave jerky business (2015);  SkinnyPop parent Amplify Snacks (2017), Pirate Brands, including the Pirate’s Booty, Smart Puffs and Original Tings brands (2018). Then, just last month, Hershey acquired ONE Brands, LLC, the maker of a line of low-sugar, high-protein nutrition bars. August 2019 turned out to be a busy month for the executives of Hershey, as also in that month, the company announced minority investments in emerging snacking businesses FULFIL Holdings Limited and Blue Stripes LLC. FULFIL is a one of the leading makers of vitaminfortified, high protein nutrition bars in the UK and Ireland, while Blue Stripes offers cacao-based snacks and treats instead of chocolate ones. 

Clearly the Hershey Company is improving its position relative to our Cleaner Living investing theme. The outstanding question is to what degree are these aggregated businesses contributing to the company’s overall sales and profits? While it is safe to say Hershey has some exposure to the Cleaner Living theme, the answers to those questions will determine Hershey’s overall theme ranking. That level of detail could emerge during the company’s September quarter earnings call, but it may not until it files its 2019 10-K. 

As we wait for that October conference call, I’ll continue to do some additional work on HSY shares, including what the potential EPS impact is from not only falling sugar prices but also the pickup in cocoa prices over the last six months. In a surprise that should come to no one, given the size and influence of the company’s chocolate and confectionary business to its sales and profits, cocoa and sugar are two key inputs that can hold sway over the Hershey cost structure. 

In my mind, the long-term question with Hershey is whether it can replicate the nip and tuck transformative success Walmart (WMT) had when it used a similar strategy to reposition itself to better capture the tailwinds of our Digital Lifestyle investing theme? No doubt transformation takes time, but now is the time to see if a better business balance between our Guilty Pleasure and Cleaner Living themes emerges at Hershey.

Weekly Issue: While far from booming, U.S. economy not  as bad as the headlines

Weekly Issue: While far from booming, U.S. economy not as bad as the headlines

Key points inside this issue

  • Thematic confirmation in the July Retail Sales report
  • Getting back to the global economy and that yield curve inversion
  • The week ahead
  • The Thematic Leaders and Select List
  • A painful reminder about dividend cuts

Despite Friday’s rebound, the stock market finished down week over week as it continued to grapple with the one-two punches of the slowing global economy and U.S.- China trade. There was much chatter on the recent yield-curve inversion, but as we look back at the economic data released last week, the U.S. economy continues to be on more solid footing than the Eurozone or China.

That’s not to say the domestic economy is booming. The Cass Freight Index, weekly railcar-traffic and truck-tonnage data and the July U.S. industrial-production report’s manufacturing component leave little question that America’s manufacturing economy is slowing. And as we saw last week, the U.S. consumer buoyed the economy in July with stronger-than-expected retail sales.


Thematic confirmation in the July Retail Sales report 

Last week’s July Retail Sales Report confirmed one of the key aspects of our Digital Lifestyle investment theme – the accelerating shift toward digital shopping that continues to vex brick and mortar retailers, particularly department stores. Granted, the year over year increase in non- store retail sales of 16.0%, which was several magnitudes greater than overall July Retail Sales that rose 3.4% year over year and bested sequential expectations, was aided by Thematic King Amazon’s (AMZN) 2019 Prime Day event but one month does not make a quarter. For the three months ending July, non-store retail sales rose 14.2% year over year, easily outstripping the 3.2% year over year comparison for overall retail sales. 

Clearly, the shift to digital shopping is not only underfoot, or more properly stated on a variety of keyboards, it is accelerating, and the victims continue to be department stores, electronics and appliance stores, sporting goods and bookstores, and to a lesser extent clothing and furniture. We’re seeing this play out in the results from Macy’s (M) as well as J.C. Penney (JCP), which is so strategically lost it is venturing into the used clothing market through a partnership with online consignment company thredUP. With its July quarter sales down 9% year over year, J.C. Penney is going for the “Hail Mary” pass with this move, but it’s only going to bring cheaper product in to compete with its already low-priced offering. I can almost understand the J.C. Penney is looking to double-down on our Middle-Class Squeeze investing theme, but it’s facing stiff competition from companies like Poshmark that are doing that as well as riding our Digital Lifestyle theme. 

Each of those challenged categories I mentioned above are also areas that Amazon continues to target with offerings from both third-party sellers as well as its growing private label line of products. I’ve often said Amazon shares are ones to hold, not trade, and we continue to feel that way as we approach the seasonally strongest time of the year for its business.


Getting back to the global economy and that yield curve inversion

For now, the U.S. economy remains the best house on the economic block — but it’s showing signs of wear. Of course, the fact the yield curve inverted briefly last week rang the “Recession Warning Bell.” But let’s remember that there’s historically been a lag of up to almost two years following that warning. Moreover, the Federal Reserve has already adopted a more dovish tone and will likely stand ready to add more stimulus to the economy if need be. All eyes will now on the Fed’s mid-September monetary-policy meeting.

Meanwhile, as economic-growth worries increased in the Eurozone and China last week, we heard about a big bazooka of stimulative measures that the European Central Bank is considering for its Sept. 12 policy meeting. China will also reportedly soon roll out a plan to boost disposable income over the coming quarters to spur its domestic consumption.

I would suggest you tune in later this week for what Tematica’s Chief Macro Strategist Lenore Hawkins has to say on this.

We’ll continue to monitor how global central bankers try to steer their respective economies in the coming weeks. While we suspect that Wall Street will likely cheer any and all dovish moves, the question remains how stimulative those policies will really be if the U.S.-China trade war continues.

U.S.-Chinese trade talks are set to resume in September, which tells us that we might get a lull in Wall Street’s recent volatility. But we should by no means think that “Elvis has left the building,” and we could very well see another round of turbulence in the coming weeks.


The Week Ahead

With two weeks to go until the Labor Day holiday weekend, we’re officially in the dog days of summer. These weeks historically see lower-than-usual trading volume, as investors and traders look to squeeze in that last bit of fun in the sun. Following last week’s full plate of economic data, this week will have a far smaller helping coming at us. Upcoming reports include July new- and existing-home sales, as well as the Index of Leading Economic Indicators.

Investors will also focus on what the latest flash PMI data from IHS Markit has to say about the global economy when that report lands on Aug. 22. I’ll be looking to see whether the U.S. economy continues to outperform Japan, China and the Eurozone following data out last week that suggested the German and Chinese economies continue to slow.

Reading those reports and the upcoming Federal Open Market Committee meeting minutes should set the stage for what we’re likely to hear when the FOMC next meets on Sept. 18. We’ll also have more data coming our way over the weeks leading up to the FOMC session, and we’re apt to get a few surprises along the way. While there’s no Fed interest-rate meeting scheduled for August, the Kansas City Fed will hold its widely watched annual Jackson Hole symposium Aug. 22-24 in Wyoming. The central bank doesn’t usually discuss monetary-policy plans at this event, but we aren’t exactly in normal times these days.

On the earnings calendar this week, the focus will continue to be on retail. If we were reminded of one thing last week in retail land, it’s that not all companies are responding the same way to retailing’s changing landscape. Just look at what we heard last week from Walmart (WMT), Macy’s (M) and JCPenney (JCP). Other key retail reports to watch this week include Home Depot (HD), Kohl’s (KSS), Lowe’s (LOW), Target (TGT), Dick’s Sporting Goods (DKS), and Foot Locker (FL). I’ll be looking for the degree to which they’re embracing digital shopping, as well as what they have to say about tariff implications and their expectations for 2019’s remainder.

We’ll also hear from Salesforce (CRM) and Toll Brothers (TOL), which should shed some light on the housing market and IT spending associated with our Disruptive Innovators and Digital Infrastructure investing themes.


The Thematic Leaders and Select List

As I noted above, last week was another choppy one for the stock market and those swings stopped out of Thematic Digital Infrastructure Leader Dycom Industries (DY) as well as Cleaner Living company International Flavors & Fragrances (IFF) shares. Given that we were stopped out, it means we took some losses in those two positions, but as I look at the live ones across the Thematic Leaders and the Select List I see an impressive array of returns with our Amazon, Costco Wholesale (COST), Chipotle Mexican Grill (CMG), McCormick & Co. (MKC), Walt Disney (DIS), Universal Display (OLED) and USA Technologies (USAT) shares. 

Wide swings in the market can present both challenging times as well as opportunities provided, we get some degree of clarity. As I touched on above, the first few weeks of September could be when we see that clarity emerge. Until then, we’ll continue to look for thematically well positioned companies at favorable risk to reward entry points. 


A painful reminder about dividend cuts

Last week I mentioned that the following – I’m focusing more on domestic-focused, inelastic business models that tend to spit off cash and drive dividends. In particular, I’m looking at companies with a track record of increasing their dividends every year for at least 10 years. And of course, they have to have vibrant thematic tailwinds at their respective back.

While I was doing just that, shares of famous lawn-mower engine maker Briggs & Stratton Corp. (BGG) — whose shares tumbled 44.5% last Thursday — presented a sharp reminder as to what can happen when a company cuts its dividend. Yes, the shares rebounded late last week along with the market, but they’ve been generally falling for a long time as the company’s dividend looked shakier and shakier.

Investors tend to think of quarterly dividends as payments in perpetuity, but these payouts are actually only declared at a company board’s discretion. When dividends are disrupted, that can lead to significant share-price pain for a stock.

In this case, Briggs & Stratton not only cut its dividend and reported a far-greater-than-expected quarterly loss, but also slashed its outlook for the balance of the year. The company now expects to earn just $0.20-$0.40 per share for the full year, which down significantly from its prior forecast of $1.30.

When matched up against its revised revenue forecast of $1.91 billion to $1.97 billion vs. a prior $2.01 billion, it’s rather evident that BGG’s cost structure has become an issue. So, it’s no little surprise that Briggs & Stratton also announced plans to close a plant that manufactures engines for the walk-behind lawn mowers you commonly find at Home Depot (HD) or Lowe’s (LOW) .

The company called out that product category in particular for weakness, which management attributed to the U.S. housing market’s current tone. I’ve previously talked about how new- and existing-home sales have been rather sluggish despite the recent mortgage-rate drop, with low rates fueling a wave of home refinancings rather than purchases.

But the biggest factor behind Thursday’s steep BGG dive was the fact that management slashed the company’s quarterly dividend by 64% to $0.05 per share from the prior $0.14. That one-two-three punch combination — bad earnings, a bad forecast and a dividend cut — sent Briggs & Stratton’s share price tumbling.

Going into Thursday morning’s earnings report, BGG shares were sporting a 6.8% dividend yield, which is on the lofty side. Investors should have interpreted that as a warning and here’s why – even before Thursday’s selloff, BGG shares had been down some 70% since January 2018, partly because the company missed analysts’ earnings expectations for the prior three quarters. In hindsight, the misses were escalating in percentage terms — a trend that continued with Thursday’s earnings report.

Paired with the dividend cut, there’s little confidence any more in the current management team, which means BGG shares are likely to flounder further due to several unknowns. Some of those unknowns are company specific, like: “Will be the plant closure deliver sufficient savings?” But others are about the U.S. economy’s future vector and velocity, which Thursday’s July industrial-production report shows is continuing to cool.

And while the July U.S. retail-sales report came in better than expected, we already know that consumers aren’t buying lawnmowers. And unfortunately, that’s not likely to change any time soon as we put the summer behind us.

The bottom line — as I’ve discussed before, when a stock’s dividend yield looks too good to be true, odds are it is just that. BGG is just the latest stock to prove that. While its newly revised dividend yield (4.1%) might still look enticing, it’s not one that we should be clamoring for given the lack of thematic tailwinds for its lawnmowing business. But at a minimum, no investor should consider the shares until there is some proof that management’s turnaround plan is on the cusp of delivering. 

Turning Heads I Win, Tails You Lose Inside Out

Turning Heads I Win, Tails You Lose Inside Out

For much of the current expansion, cycle investors have been forced taught to believe in a Heads-I-Win-Tales-You-Lose investing environment in which good economic news was good for equities and bad economic news was also good for equities. Good news obviously indicates a positive environment, but bad news meant further central bank intervention, which would inevitably raise asset prices.

Those who didn’t buy-the-dip were severely punished. Many fund managers who dared to take fundamentals into consideration and were wary, or put on portfolio protection, saw their clients take their money and go elsewhere. An entire generation of market participants learned that it’s easy to make money, just buy the dip. That mode just may be changing as the past two weeks the major indices have taken some solid hits. Keep in mind that while the headlines keep talking up the equity markets, the total return in the S&P 500 has been less than 5% while the long bond has returned over 18%. Austria’s century bond has nearly doubled in price since it was first offered less than two years ago!

Earnings Season Summary

So far, we’ve heard from just under 2,000 companies with the unofficial close to earnings season coming next week as Wal Mart (WMT) reports on the 15th. The EPS beat rate has fallen precipitously over the past week down to 57.2%, which if it holds, will be the lowest beat rate since the March quarter of 2014. Conversely, the top line beat rate has risen over the past week to 57.4% which is slightly better than last quarter, but if it holds will be (excepting last quarter) the weakest in the past 10 quarters. The difference between the percent of companies raising guidance versus percentage lowering is down to -1.8% and has now been negative for the past four quarters and is below the long-term average.

With 456 of the 505 S&P 500 components having reported, the blended EPS growth estimate is now -0.72% year-over-year, with six of the eleven sectors experiencing declining EPS. This follows a -0.21% decline in EPS in Q1, giving us (if this holds) an earnings recession. The last time we experienced such a streak was the second quarter of 2016.

The Fed Disappoints

Last week Jerome Powell and the rest of his gang over at the Federal Reserve cut interest rates despite an economy (1) the President is calling the best ever, (2) an unemployment rate near the lowest level since the 1960s, at a (3) time when financial conditions are the loosest we’ve seen in over 16 years and (4) for the first time since the 1930s, the Fed stopped a tightening cycle at 2.5%. We have (5) never seen the Fed cut when conditions were this loose. They were looking to get some inflation going, Lord knows the growing piles of debt everywhere would love that, but instead, the dollar strengthened, and the yield curve flattened. Oops. That is not what the Fed wanted to see.

The President was not pleased. “What the Market wanted to hear from Jay Powell and the Federal Reserve was that this was the beginning of a lengthy and aggressive rate-cutting cycle which would keep pace with China, The European Union and other countries around the world,” he said in a tweet. “As usual, Powell let us down.”

The dollar’s jump higher post-announcement means that the Fed in effect tightened policy by 20 basis points. Oops2. The takeaway here is that the market was not impressed. It expected more, it priced in more and it wants more. Now the question is, will the Fed give in and give the market what it wants? Keep in mind that both the European Central Bank and the Bank of England are turning decisively more dovish, which effectively strengthens the dollar even further.

Looking at past Fed commentary, the track record isn’t exactly inspirational for getting the all-important timing right.

But, we think the odds favor a continuation of positive growth, and we still do not yet see enough evidence to persuade us that we have entered, or are about to enter, a recession.” Alan Greenspan, July 1990

“The staff forecast prepared for this meeting suggested that, after a period of slow growth associated in part with an inventory correction, the economic expansion would gradually regain strength over the next two years and move toward a rate near the staff’s current estimate of the growth of the economy’s potential output.” FOMC Minutes March 20, 2001

“At this juncture, however, the impact on the broader economy and financial markets of the problems in the subprime market seems to likely be contained.” Ben Bernanke, March 2007

“Would I say there will never, ever be another financial crisis? You know probably that would be going too far but I do think we’re much safer and I hope that it will not be in our lifetimes and I don’t believe it will be.” Janet Yellen, June 2017 (This one is going to be a real doozy)

This time around Fed Chairman Powell told us that what we are getting is a “mid-cycle policy adjustment.” Wait, what? We are now (1) in the longest expansion in history with (2) the lowest unemployment rate in over 50 years as (3) corporate leverage levels reaching record levels at a (4) time when more of it is rated at just above junk than ever before in history. This is mid-cycle? I’m pretty sure this one will be added to the above list as some serious Fed facepalming. Now I think these folks are incredibly bright, but they are just tasked with an impossible job and live in a world in which their peers believe they can and ought to finesse the economy. So far that theory hasn’t turned out all that well for anyone who doesn’t already have a good-sized pile of assets.

Domestic Economy (in summary because it is August after all)

  • We are 3-year lows for the US ISM manufacturing and services PMIs.
  • We are seeing a shrinking workweek, contracting manufacturing hours and factory overtime is at an 8-year low.
  • Just saw a contraction in the American consumer’s gasoline consumption.
  • American households just cut their credit card balances, something that happens only about 10% of the time during an expansion. Keep in mind that Q2 consumer spending was primarily debt-fueled when looking towards Q3 GDP.
  • The Organization for Economic Co-operation and Development (OECD) Leading Economic Indicator for the US fell to a 10-year low in June, having declined for 18 consecutive months. A streak of this nature has in the past always been indicative of a recession. Interestingly that same indicator for China just hit a 9-month high.
  • The Haver Analytics adjusted New York Fed recession risk model has risen from 50% in early January to a 10-year high of 80%.

Global Economy

  • The IMF has cut world GDP forecasts for the fourth consecutive time.
  • We have 11 countries so far in 2019 experiencing at least one quarter of shrinking GDP and 17 central banks are in cutting mode with Peru the latest to cut, the Royal Bank of Australia hinting at further cuts and Mexico and Brazil likely next in line.
  • Some 30% of the world’s GDP is experiencing inverted yield curves.
  • Over half the world’s bond market is trading below the Fed funds rate.
  • Despite the sanctions on Iran and OPEC output cuts, WTI oil prices have fallen over 20% in the past year.

Europe

  • The Eurozone manufacturing PMI for July fell to 46.5, down from 47.6 in June and is now at the lowest level since the Greek debt crisis back in 2012 as employment declined to a six-year low with a decline in exports. Spain came in at 48.2, 48.5 for Italy and 49.7 for France.
  • Germany, long the economic anchor for the Eurozone and the world’s fourth-largest economy, has negative yields all the way out 30 years and about 40% of Europe’s investment-grade bonds have negative yields. The nation’s exports declined 8% year-over-year and imports fell 4.4% in June as global demand continues to weaken.
  • France had its industrial production contract -2.3% in June versus expectations for -1.6%.
  • Italy’s government is back in crisis mode as the two coalition ruling parties look to be calling it quits. Personally, I think Salvini (head of the League) has been waiting for an opportune time to dump his Five Star partners and their recent vote against European Infrastructure gave him that chance. The nation is likely heading back to the polls again at a time when Europe is facing a potential hard Brexit, so we’ve got that going for us.
  • The UK economy just saw real GDP in Q2 contract 0.2% quarter-over-quarter. Domestic demand contracted -3%. Capex fell -0.5% and has now been in contraction for five of the past six quarters. Manufacturing output also contracted -2.3% in the worst quarter since the Great Financial Crisis.

Asia

  • South Korean exports, a barometer for global trade, fell 11% year-over-year in July. The trade war between South Korea and Japan continues over Japan’s reparations for its brutal policy of “comfort women” during WWII.
  • The trade war with China has entered the second year and this past week it looks unlikely that we will get anything sorted out with China before the 2020 election. The day after Fed’s rate decision Trump announced that the US would be imposing 10% tariffs on $300 billion of Chinese goods starting September 1st. In response, China devalued its currency and word is getting out that the nation is preparing itself for a prolonged economic war with the US. The rising tension in Hong Kong are only making the battle between the US and China potentially even more volatile and risky. Investors need to keep a sharp eye on what is happening there.
  • Auto sales in China contracted 5.3% year-over-year in July for the 13th contraction in the past 14 months.
  • Tensions are rising between India and Pakistan thanks to India’s PM Modi’s decision to revoke Kashmir’s autonomy.

US Dollar

When we look at how far the dollar has strengthened is have effectively contracted the global monetary base by more than 6% year-over-year. This type of contraction preceded the five most recent recessions. While the headlines have been all about moves in the equity and bond markets, hardly anyone has been paying attention to what has been happening with the dollar, which looks to be poised the breakout to new all-time highs.

Reaching for new all-time highs?

A strengthening dollar is a phenomenally deflationary force, something that would hit the European and Japanese banks hard. So far we are seeing the dollar strengthen significantly against Asian and emerging market currencies, against the New Zealand Kiwi and the Korean Won, against the Canadian dollar and the Pound Sterling (Brexit isn’t helping) and China has lowered its peg to the dollar in retaliation against new tariffs in the ongoing trade war. There is a mountain of US Dollar-denominated debt out there, which is basically a short position on the greenback and as the world’s reserve currency and the currency that utterly dominates global trade. As the USD strengthens it creates an enormous headwind to global growth.

The deflationary power of a strengthening US dollar strength in the midst of slowing global trade and trade wars just may overpower anything central banks try. This would turn the heads-I-win-tales-you-lose buy-the-dip strategy inside out and severely rattle the markets.

The bottom line is investors need to be watching the moves in the dollar closely, look for those companies with strong balance sheets and cash flows and consider increasing liquidity. The next few months (at least) are likely to be a bumpy ride.

Don’t Judge a Book by Its Cover

Don’t Judge a Book by Its Cover


It’s the end of July and has been hot as hell for much of the world this week, around 107 Fahrenheit in Paris yesterday! So I’ll do my best to keep this look into economy and markets a bit shorter than my usual. When economies and markets are near a turning point, often the headlines tell a very different story than is revealed by digging deeper into the data – you can’t judge a book by its cover. In this week’s issue of Context & Perspectives:

  • Budget Debate Off the Table Until 2020
  • Investors Just Not That into the Stock Market
  • Global Manufacturing Weakness Continues to Spread
  • Next Week, the Fed Re-Takes Center Stage


Budget Debate Off the Table Until 2020

Apparently, the Democrats were also feeling the heat as they managed to work out a deal on a 2-year budget with the President, so at least that drama is off the table until after the elections. Maybe at some point during the elections, someone will mention the enormous level of debt the government has accumulated, while Social Security remains a massively underfunded elephant in the room. Or maybe not. We live in interesting times.


Investors Just Not That into the Stock Market

While the market continues to grind higher, digging into the details we find that investors have really not been loving this stock market. Over the past 52 weeks, according to data from the Investment Company Institute (ICI), investors have pulled $329.4 billion out of equity funds, another $94.0 billion out of hybrid funds and put $75.7 billion into bond funds. So how has the market continued to march higher? Over the past five years, investors have been net sellers of the market with corporations themselves the net buyers through stock buybacks, which isn’t quite as rosy as it may first seem.

Some of these buybacks are being funded through debt, which has led global corporate debt to reach unprecedented heights, as I discussed in my last piece when I pointed out the proliferation of not just corporate debt, but also the increasing numbers of zombie corporations. There are a few others also concerned with this, as was discussed in a Barron’s article yesterday, you might recognize just a few of these names.    

Part of why investors are selling while corporations are buying back their own shares is likely a function of demographics. As the Baby Boomers move adjust portfolios as they move into retirement, their portfolio construction will naturally have to change and that shift, in a period of central bank interest rate suppression, is much harder than it was for generations past. The level of income that can be feasibly generated from a portfolio today is much less than what the Baby Boomers’ parents enjoyed. At the other end of the spectrum, Millennials are saddled with unprecedented levels of student debt, so they aren’t exactly big buyers of shares either. Between central bank manipulations and demographics, this is a very different investing environment.

Given the relative strength of the US economy compared to the global economy, which is slowing more dramatically, it is interesting to note that large-cap stocks, (which tend to have more international exposure) have been outperforming small-cap stocks at a level not seen since January 2008 – ahem, share buybacks, anyone? 

/var/folders/fv/f4swy74j3jl12hvfn4bl0yvr0000gn/T/com.microsoft.Word/WebArchiveCopyPasteTempFiles/Russell-1000-v-2000.png


Global Manufacturing Weakness Continues to Spread

This week’s Markit manufacturing PMI came in at 50.0, meaning no change in output, and was the weakest level since March of 2009. The United States wasn’t alone as Germany’s Markit Manufacturing PMI was the lowest since July of 2012 and the Euro Area as a whole came in at the lowest level since December 2012. A composite of the five Federal Reserve manufacturing activity indices (courtesy of Bespoke Investment Group) reveals that all nine subcomponents have declined year-over-year, with Prices Paid leading the decline, down -24.2% and New Orders coming in the second worst, down -22.2%. New Orders are also down -10.2% from just this past April. That is not exactly a rosy leading indicator. The International Monetary Fund has cut global growth forecasts four times this year.

When looking at manufacturing globally, the first company to come to mind is Caterpillar (CAT). The company reported results for the June quarter that confirmed the overall slowing we’ve been seeing in the global industrial sector. Sales growth for the company has weakened along with various indicators of slowing we’ve been seeing come in from all over the world. We aren’t seeing an imminent crash, but Caterpillar’s results certainly support the theory of spreading weakness. Sales for the bellwether company peaked in North America in February 2018 at 30% year-over-year and have been falling ever since, with June’s 12% year-over-year growth rate the weakest in 18 months. North America remains the strongest region for the company and one of only two posting positive growth. The rolling three-month average global sales growth rate is down to its lowest level in about 14 months and the company’s streak of 28 consecutive months of rising sales is being threatened. This tells you an awful lot about the global economy.


The Consumer & Government Props Up GDP . . . with Debt

Friday morning the first estimate for GDP for the second quarter was released, rising 2.1% versus expectations for 1.8% – 2.0% and up from 3.1% in the first quarter. This quarter was all about the consumer with personal consumption expenditures up 4.3% (annual rate), the strongest performance in six quarters. At the same time, American Express (AXP) and Capital One Financial Corp (COF) reported an increase in the number of accounts overdue by 30+ days in the second quarter. Personal Savings also declined -3.6%. Spending up, debt up and savings down – not exactly a sustainable trend?

Looking further at the consumer, on the positive side, the solid quarterly earnings report from short-term staffing provider Robert Half (RHI) provided evidence that we are seeing domestic wage growth with the bill rate (which is basically the cost of waters for the company’s customers) was up 5% year-over-year in the past three quarters. That’s good news for the consumer, but keep in mind this is not a leading indicator. On the other hand, employment at small businesses, which does tend to be a leading indicator as small businesses are quick to respond and adjust to the changing economy, fell by 23k in June after having fallen 38k in May. The last time we saw back-to-back drops of that magnitude was in early 2010. For all the hoopla over employment, the last Job Openings and Labor Turnover Survey found that job openings were down -4% from the cycle high and new hires were down -4.4%. Again, not saying we are falling off a cliff here, but we are looking for indicators that the trend is changing direction and these data points clearly point towards that assessment.

Friday’s GDP report also found that gross private domestic investment declined -5.5%, the worst showing since the December quarter of 2015 with spending on non-residential structures falling -10.6%. This drop on business investment took a full percentage point off of GDP – to be fair, they are awfully busy buying back their own shares. If businesses are cutting back on investments in machinery and structures, isn’t hiring going to be affected? That will affect consumer spending. When looking at that fall in domestic investment, keep in mind the trade wars and how Chinese foreign direct investment has declined by about 90% over the past two years. 

Along with a jump in consumer spending, government spending also jumped, rising 5% on an annual basis. That is the biggest increase in spending since the second quarter of 2009 when the economy was literally falling off a cliff. Not to be a negative Nancy here, but digging into the math a bit we see that consumer spending and government combined rose at a 4.4% annual rate while the rest of the economy contracted at a -12.1% rate.

In the end, and I’m doing my best to wrap this up quickly for all of you struggling with the heat, all eyes remain on the entities most responsible for the health of the stock market these days – central banks. The European Central bank policy announcement this week kept the benchmark despite the rate at negative 40 basis points but indicated the bank is considering additional quantitative easing and potentially a tiered deposit rate scheme to help protect bank profitability – not exactly a shocker given the poor condition of many of the region’s banks. The outgoing head of the ECB, Mario Draghi, stated that the outlook “is getting worse and worse.” In response, the German 10-year yield traded as low as negative 42 basis points. For context, the US 10-year closed the same day at 2.075%. 


On Tap Next Week, the Fed Re-Takes Center Stage

Next week the Federal Reserve is expected to cut its key rate by at least 25 basis points and the market is pricing in further cuts to follow. Many are arguing that the Fed needs to be Gretzky and move to where the economy is going to be, not where it is today. They may be right, but the Fed has backed itself into a really tough corner. A typical rate-cutting cycle sees 525 basis points of cuts. Today, it has about half of that to work with and over the coming months the economy is facing quite a few potential shocks:

  • Brexit – now that Boris is in charge it could get ugly.
  • The feud between the odd-couple political coalition in Italy is intensifying at a time when European leadership is particularly weak and facing Brexit. Just what the EU needs, more instability.
  • Trade wars. 
  • Iran tossing around missiles and threats in the Strait of Hormuz

The Fed may want to keep some of those precious few arrows in its quiver. It is also facing competition in the race to the bottom as many of the world’s central banks are either cutting or are looking to begin cutting rates in the near future. Meanwhile, the market continues to grind higher.

Central Bankers’ New Clothes

Central Bankers’ New Clothes

In this week’s musings:

  • Earnings Season Kicks Off 
  • Central Bankers’ New Clothes 
  • Debt Ceiling – I’m Baaack
  • Trade Wars – The Gift that Keeps on Giving
  • Domestic Economy – More Signs of Sputtering
  • Stocks – What Does It All Mean

It’s Earnings Season

Next week banks unofficially kick off the June quarter earnings season with expectations set for a -2.6% drop in S&P 500 earnings, (according to FactSet) after a decline of -0.4% in the first quarter of 2019. If the actual earnings for the June quarter end up being a decline, it will be the first time the S&P 500 has experienced two quarters of declines, (an earnings recession) since 2016. Recently the estimates for the third quarter have fallen from +0.2% to -0.3%. Heading into the second quarter, 113 S&P 500 companies have issued guidance. Of these, 87 have issued negative guidance, with just 26 issuing positive guidance. If the number issuing negative guidance does not increase, it will be the second highest number since FactSet began tracking this data in 2006. So not a rosy picture.

Naturally, in the post-financial crisis bad-is-good-and-good-is-bad-world, the S&P 500 is up nearly 20% in the face of contracting earnings — potentially three quarters worth — and experienced the best first half of the year since 1997. In the past week, both the S&P 500 and the Dow Jones Industrial Average have closed at record highs as Federal Reserve Chairman Powell’s testimony before Congress gave the market comfort that cuts are on the way. This week’s stronger than expected CPI and PPI numbers are unlikely to alter their intentions. Welcome to the world of the Central Bankers’ New Clothes

Central Bankers’ New Clothes

Here are a few interesting side-effects of those lovely stimulus-oriented threads worn in the hallowed halls of the world’s major central banks.

https://www.tematicaresearch.com/wp-content/uploads/2019/07/2019-07-12-EU-EM-Neg-Yields.png https://www.tematicaresearch.com/wp-content/uploads/2019/07/2019-07-12-Greek-below-UST.png

Yes, you read that right. Greece, the nation that was the very first to default on its debt back in 377BC and has been in default roughly 50% of the time since its independence in 1829, saw the yield on its 10-year drop below the yield on the 10-year US Treasury bond. But how can that be?

Back to those now rather stretchy stimulus suits worn by the world’s central bankers that allow for greater freedom of movement in all aspects of monetary policy. In recent weeks we’ve seen a waterfall of hints and downright promises to loosen up even more. The European Central Bank, the US Federal Reserve, the Bank of Canada have all gone seriously dovish. Over in Turkey, President Erdogan fired his central banker for not joining the party. Serbia, Australia, Dominican Republic, Iceland, Mozambique, Russia, Chile, Azerbaijan, India, Australia, Sri Lanka, Kyrgyzstan, Angola, Jamaica, Philippines, New Zealand, Malaysia, Rwanda, Malawi, Ukraine, Paraguay, Georgia, Egypt, Armenia, and Ghana have all cut rates so far this year, quite a few have done so multiple times. From September of 2018 through the end of 2018, there were 40 rate hikes by central banks around the world and just 3 cuts. Since the start of 2019, there have been 11 hikes and 38 cuts.

That’s a big shift, but why? Globally the economy is slowing and in the aftermath of the financial crisis, a slowing economy is far more dangerous than in years past. How’s that?

In the wake of the financial crisis, governments around the world set up barriers to protect large domestic companies. The central bankers aimed their bazookas at interest rates, which (mostly as an unintended consequence) ended up giving large but weak companies better access to cheap money than smaller but stronger companies. This resulted in increasing consolidation which in turn has been shrinking workers’ share of national income. For example, the US is currently shutting down established companies and generating new startups at the slowest rates in at least 50 years. Today much of the developed world faces highly consolidated industries with less competition and innovation (one of the reasons we believe our Disruptive Innovators investing theme is so powerful) and record levels of corporate debt. It took US corporations 50 years to accumulate $3 trillion in debt in the third quarter of 2003. In the first quarter of 2019, just over 15 years later, this figure had more than doubled to $6.4 trillion.

Along with the shrinking workers’ share of national income, we see a shrinking middle class in many of the developed nations – which we capitalize on in our Middle Class Squeeze investing theme. As one would expect, this results in the economy becoming more and more politicized – voters aren’t happy. Recessions, once considered a normal part of the economic cycle, have become something to be avoided at all costs. The following chart, (using data from the National Bureau of Economic Research) shows that since the mid-1850s, the average length of an economic cycle from trough to peak has been increasing from 26.6 months between 1854 and 1919 to 35 months between 1919 and 1945 to 58.4 months between 1945 and 2009. At the same time, the duration of the economic collapse from peak to trough has been shrinking. The current trough to (potential peak) is the longest on record at 121 months – great – but it is also the second weakest in terms of growth, beaten only by the 37-month expansion from October 1945 to November of 1948.

https://www.tematicaresearch.com/wp-content/uploads/2019/07/2019-07-12-Economic-Cycles.png

Why has it been so weak? One of the reasons has been the rise of the zombie corporation, those that don’t earn enough profit to cover their interest payments, surviving solely through refinancing – part of the reason we’ve seen ballooning corporate debt. The Bank for International Settlements estimates that zombie companies today account for 12% of all companies listed on stock exchanges around the world. In the United States zombies account for 16% of publicly listed companies, up from just 2% in the 1980s. 

This is why central bankers around the world are so desperate for inflation and fear deflation. In a deflationary environment, the record level of debt would become more and more expensive, which would trigger delinquencies, defaults and downgrades, creating a deflationary cycle that feeds upon itself. Debtors love inflation, for as purchasing power falls, so does the current cost of that debt. But in a world of large zombie corporations, a slowing economy means the gap between profit and interest payments would continue to widen, making their survival ever more precarious. This economic reality is one of the reasons that nearly 20% of the global bond market has negative yield and 90% trade with a negative real yield (which takes inflation into account).

Debt Ceiling Debate – I’m baack!

While we are on the topic of bonds, the Bipartisan Policy Center recently reported that they believe there is a “significant risk” that the US will breach its debt limit in early September if Congress does not act quickly. Previously it was believed that the spending wall would not be hit until October or November. As the beltway gets more and more, shall we say raucous, this round could unnerve the markets.

Trade Wars – the gift that keeps on giving

Aside from the upcoming fun (sarcasm) of watching Congress and the President whack each other around over rising government debt, the trade war with China, which gave the equity markets a serious pop post G20 summit on the news that progress was being made, is once again looking less optimistic. China’s Commerce Minister Zhong Shan, who is considered a hardliner, has assumed new prominence in the talks, participating alongside Vice Premier Liu He (who has headed the Chinese team for over a year) in talks this week. The Chinese are obviously aware that with every passing month President Trump will feel more pressure to get something done before the 2020 elections and may be looking to see just how hard they can push.

Trade tensions between the US and Europe are back on the front page. This week, senators in France voted to pass a new tax that will impose a 3% charge on revenue for digital companies with revenues of more than €750m globally and €25m in France. This will hit roughly 30 companies, including Apple (AAPL), Facebook (FB), Amazon (AMZN) and Alphabet (GOOGL) as well as some companies from Germany, Spain, the UK and France. The Trump administration was not pleased and has launched a probe into the French tax to determine if it unfairly discriminates against US companies. This could lead to the US imposing punitive tariffs on French goods.

Not to be outdone, the UK is planning to pass a similar tax that would impose a 2% tax on revenues from search engine, social media and e-commerce platforms whose global revenues exceed £500m and whose UK revenue is over £25m. This tax, which so far appears to affect US companies disproportionately, is likely to raise additional ire at a time when the US-UK relationship is already on shaky ground over leaked cables from the UK’s ambassador that were less than complimentary about President Trump and his administration.  

That’s just this week. Is it any wonder the DHL Global Trade Barometer is seeing a contraction in global trade? According to Morgan Stanley research, just under two thirds of countries have purchasing manager indices below 50, which is contraction territory and further warning signs of slowing global growth. This week also saw BASF SE (BASFY), the world’s largest chemical company, warn that the weakening global economy could cut its profits by 30% this year.

Domestic Economy – more signs of sputtering

The ISM Manufacturing index weakened again in June and has been declining now for 10 months. The New Orders component, which as its name would imply, is more forward-looking, is on the cusp of contracting. It has been declining since December 2017 and is at the lowest level since August 2016. Back in 2016 the US experienced a bit of an industrial sector mini-recession that was tempered in its severity by housing. Recall that back then we saw two consecutive quarters of decline in S&P 500 earnings. Today, overall Construction is in contraction with total construction spending down -2.3% year-over-year. Residential construction has been shrinking year-over-year for 8-months and in May was down -11.2% year-over-year. Commercial construction is even worse, down -13.7% year-over-year in May and has been steadily declining since December 2016. What helped back in 2016 is of no help today.

While the headlines over the employment data (excepting ADP’s report last week) have sounded rather solid, we have seen three consecutive downward revisions to employment figures in recent months. That’s the type of thing you see as the data is rolling over. The Challenger, Gray & Christmas job cuts report found that employer announced cuts YTD through May were 39% higher than the same period last year and we are heading into the 12thconsecutive month of year-over-year increases in job cuts – again that is indicative of a negative shift in employment.

Stocks – what does it all mean?

Currently, US stock prices, as measured by the price-to-sales ratio (because earnings are becoming less and less meaningful on a comparative basis thanks to all the share buybacks), exceed what we saw in the late 1999s and early 2000s. With all that central bank supplied liquidity, is it any wonder things are pricey?

On top of that, the S&P 500 share count has declined to a 20-year low as US companies spent over $800 million on buybacks in 2018 and are poised for a new record in 2019 based on Q1 activity. Overall the number of publicly-listed companies has fallen by 50% over the past 20 years and the accelerating pace of stock buybacks has made corporations the largest and only significant net buyer of stocks for the past 5 years! Central bank stimulus on top of fewer shares to purchase has overpowered fundamentals.

This week, some of the major indices once again reached record highs and given the accelerating trend in central bank easing, this is likely to continue for some time — but investors beware. Understand that these moves are not based on improving earnings, so it isn’t about the business fundamentals, (at least when we talk about equity markets in aggregate as there is always a growth story to be found somewhere regardless of the economy) but rather about the belief the central bank stimulus will continue to push share prices higher. Keep in mind that the typical Federal Reserve rate cut cycle amounts to cuts of on average 525 basis points. Today the Fed has only about half of that with which to work with before heading into negative rate territory.

The stimulus coming from most of the world’s major and many of the minor central banks likely will push the major averages higher until something shocks the market and it realizes, there really are no new clothes. What exactly that shock will be — possibly the upcoming debt ceiling debates, trade wars or intensifying geological tensions — is impossible to know with certainty today, but something that cannot go on forever, won’t.

The market is going great so no need to worry, right?

The market is going great so no need to worry, right?


There are weeks when sitting down to write this piece is tough because not much worthy of note has happened in the markets or the economy outside of the usual noise. This week, that was most definitely not the case. Thank God it is Friday – we all need a break.


New Market Highs and the Economy Gets Uglier

Thursday the S&P 500 closed at a new all-time high and is now above its 50-day, 100-day and 200-day moving averages. The post Federal Reserve Open Market Committee meeting debrief gave the market essentially what it wanted, a significantly more dovish stance with plenty of reasons to believe future rate cuts are imminent. Perhaps the Marty Zweig adage, “Don’t fight the Fed,” has been flipped on its head to “Fed, don’t fight the markets.” Unemployment is at multi-decade lows with more job openings than unemployed persons, rising hourly earnings, and improving retail sales while the market hits all-time highs and yet the Fed is preparing to stimulate. Yeah, something’s off here.

Stocks may be partying like it is 1999 (for those who remember that far back) but the yield on the 10-year closed at 2.01% Thursday. To put that in context, on June 9th when the 10-year was down to 2.09%, the Wall Street Journal ran an article asserting that, “Almost nobody saw the nosedive in bond yields coming, but a few players were positioned well enough to profit. Some think there is more room for yields to fall further,” along with this chart. To be clear, despite not one respondent predicting the yield on the 10-year would fall below 2.5% in 2019, none of these economists are idiots, but the thing is they all tend to read from the same playbook.

The stock market is giddy over its expectations for lower rates, yet the spread between the 3-month and the 10-year Treasury has been inverted for four weeks as of this writing, not exactly a ringing endorsement for economic growth prospects. Every time this curve has been inverted for 4 consecutive weeks, it has been followed by a recession (hat tip @Saxena_Puru) for this chart. Note that the chart uses 10-year versus 1-year until the 3-month became available in 1982. Much of the mainstream financial media and fin twit believe this time is different. Time will tell.

The red arrows denote 4 consecutive weeks of inversion and the blue arrows mark bear-market lows (20% declines).

Then there is this, with a hat tip to Sven Henrich whose tweet with a chart from Fed went viral – that in and of itself says a lot.

Both US imports and exports have declined from double-digit growth in 3Q 2018 to essentially flat today. The recent CFO Outlook by Duke’s Fuqua School of Business found that optimism about the US and about their own companies amongst CFO’s had fallen from the prior year.

The shipments of goods being moved around the country have plummeted since the beginning of 2018, as shown by the Cass Freight Index.

The Morgan Stanley Business Conditions Index fell 32 points in June, the largest one-month decline in its history.

If all that doesn’t have your attention, consider that the New York Fed’s recession probability model puts the probability that we are in a recession by May 2020 at 30%. Note that going back to 1961, whenever the probability has risen to this level we have either already been in a recession or shortly entered one with the exception of 1967 – 7 out of 8 times.

But hey, the market is going great so no need to worry right? If that’s what you are thinking, skip this next chart from @OddStats.


Geopolitics – From Bad to Oh No, No No

Brinksmanship with Iran continues as in the early hours of Friday we learned that the US planned a military strike against Iran in response to the shooting down of an American reconnaissance drone. The mission was called off at the last minute after the President learned that an estimated 150 people would likely have been killed. Frankly, the official story sounds a bit off, but what we do know is that we are in dangerous territory and one can only hope that some cooler heads prevail, and the situation gets dialed back a whole heck of a lot.

Given we weren’t enjoying enough nail-biting out of the Middle East news, an independent United Nations human rights expert investigating the killing of Saudi journalist Jamal Khashoggi is in a 101-page report recommending an investigation into the possible role of the Saudi Crown Prince Mohammed bin Salam citing “credible evidence,” and while not specifically assigning blame to bin Salam, did assign responsibility to the Saudi government. This week the US Senate voted to block arms sales to Saudi Arabia, rebuking the President’s decision to use an emergency declaration to move the deal forward. This matters when it comes to investing because there are some seriously high-stakes games being played out that have the potential to suddenly rock markets without any warning.

Over in Europe more and more data points pointing to a slowing economy, which led to European Central Bank President Mario Draghi to announce that more stimulus could be in the works if inflation fails to accelerate. At the ECB’s annual conference in Sintra, Portugal Draghi stated that, “In the absence of improvement, such that the sustained return of inflation to our aim is threatened, additional stimulus will be required.” It isn’t just inflation that is troubling the region. Euro Area Industrial Production (ex Construction) has only seen increases in 2 of the last 11 months.

Italy continues to struggle with its budget deficit outside the limits allowed by the European Union, leading to a battle between Rome and Brussels. Friday Deputy Prime Minister Matteo Salvini (head of the euro-skeptic Lega party) threatened to quit his position if he is not able to push through tax cuts for at least €10 billion. While the US has been laser-focused on the Fed (and the president’s tweets) the Italian situation is getting more tense and a time when UK leadership with respect to Brexit is also getting a lot more tense. To put the Italian problem in perspective and understand why this problem is not going away, look at the chart below.

Today, Italy’s per capita GDP is 2.8% BELOW where it was in 2000 while Germany is 24.8% higher. Even the beleaguered Greece has outperformed Italy. Italy’s debt level is material to the rest of the world, its economy is material to the European Union, its citizens are losing their patience and its leadership consists of a tenuous partnership between a far-right, fascist-leaning Lega and a far-left, communist(ish) 5 Star movement lead by folks that very few in the nation respect. So that’s going well.

As if the European Union didn’t have enough to worry about as its new parliament struggles to find any sort of direction or agreement on leadership, the parliamentary process for selecting the next Prime Minister of the UK is down to two finalists. Enthusiam is rampant.

A hard Brexit is looking more likely and that is not going to be smooth sailing for anyone.


The Bottom Line

All this is a lot to take in, but there is a bright light for the week. Anna Wintour, Vogue’s editor-in-chief and eternal trend-setter, has given flip-flops her seal of approval. So, we’ve got that going for us. If that didn’t put a little spring into your step, I suggest you check out this twitter feed from Paul Bronks. Your soon-to-be more swimsuit ready abs will thank me, but your neighbors will wonder what the hell is going on at your place.

Betting on Central Banks as it Gets Plain Ugly

Betting on Central Banks as it Gets Plain Ugly


In this week’s piece

  • The Central Bank Prayer
  • Labor Markets Take a Dive
  • Global Wobbles
  • Geopolitical Angst
  • Definitive Proof of Peak


Central Bank Prayer

The market is hoping, praying and pricing for a Federal Reserve rate cut ostensibly driven by the now dual trade wars, which means the actions of the president are driving both monetary and fiscal policy – surely this will not end well. That is not a political statement as in this game one cannot afford (literally) to be influence by biases towards either the left or right, but it is rather a lesson of history. One individual driving both fiscal and monetary policy for a nation has never come to a utopic end.

The market participants, however, have learned their lesson over the past 10+ years, weak fundamentals are meaningless, trivial details in the face of the power of the world’s major central banks. Or are they? It has been said that something that cannot go on forever, won’t. I know, I know, this time it’s different.

This week Federal Reserve officials gathered in Chicago for a research conference and signaled in interviews and speeches that they are aware of the rising risk of a weaker-than-expected economy. According to the CME Group, traders in futures markets have placed about a 25% chance of a rate cut at the Federal Reserve’s June 18-19 meeting and a 75% chance of at least one cut by the July 30-31 meeting. Chairman Powell on Tuesday stated that, “We do not know how or when these trade issues will be resolved…We are closely monitoring the implications of these development for the US economic outlook and, as always, will act as appropriate to sustain the expansion.”

Across the pond, European Central Bank president Mario Draghi, while wearing the bright blue tie that has often accompanied unexpected stimulus announcements, surprised markets on Thursday by making it clear that the ECB expects rates to stay at their current levels until at least mid-2020. That is longer than had previously been indicated which pushed the euro unexpectedly higher. Investors back in the States ought to take note that central bankers may not be quite as eager as the market hopes to provide immediate support upon signs of weakness. In the US, the issue may very well be complicated by one of the drivers of the weakness – the trade war. One can imagine that as Fed officials ponder the data coming in, the question could arise, “Would it be wise to use stimulus to counter the effects of trade negotiating tactics? Where might that road lead?”

In the Fed’s most recent Beige Book the word ‘uncertain’ appears 21 times, a 6-year high. For a longer-term perspective, in data going back to 1996, that word only appeared more between 2011 and 2013 during the debt ceiling drama, the US debt downgrade, two rounds of quantitative easing and the euro area recession. Uncertainty, you think?


Labor Markets Take a Dive

It was a dour week for labor market data as our Middle-Class Squeeze investing theme came to the forefront.

This week’s ADP private sector payroll report was a big surprise to the downside with only 27k net new jobs added versus consensus expectations for 185k and an enormous decline from the prior month’s addition of 271k and the previous 12-month average of 223k. This was the weakest growth in jobs since March 2010 (in orange below). Looking back to prior to the financial crisis, this rate was similar to the warning signs from the December of 2006 report (in red below). The declines were widespread across sectors, making it tough to write this one off, which undoubtably the bulls will be looking to do. Small businesses, which typically lead the cycle, saw employment contract by 52k in May, also the weakest result since March 2010. To really hammer it home, the goods-producing sector saw a drop in jobs of 43k – this is the same level of decline we saw back in December 2007, the month that the Great Recession began. In the good-producing sector, there were declines across the board from small, mid-sized and large firms with the small businesses (that canary in the economic coal mine) seeing the lion’s share.

The day after the ADP report, the Challenger, Gray & Christmas Job Cut report revealed that US-based employers announced plans to cut 58,577 jobs from their payrolls in May, a 46% increase from April and an 86% increase from May of 2018. Year-to-date cuts are up 39% over the same period from last year with most of the cuts coming from the tech sector. Cuts in the Auto industry for the first five months of 2019 are 211% higher than 2018 and have hit the highest 5-month total since 2009. Keep in mind this sector is highly sensitive to the business cycle.

Those that were looking for the Bureau of Labor Statistic’s Nonfarm Payroll report to contradict ADP’s report from earlier in the week were stunned on Friday to see the economy added just 75k jobs in May versus expectations for 175k.

Average hourly earnings rose just 0.2% month-over-month versus the 0.3% expected. More concerning is that while net new jobs were just 75k, the number of persons employed part time for economic reasons (meaning they cannot get a full-time job) declined by 299k, meaning these people lost the only work they could find. So far monthly job gains have averaged 164k in 2019 versus 223k in 2018.


Global Wobbles

The JPMorgan Global Manufacturing PMI dropped from 50.4 in April to 49.8 in May, the lowest reading since October 2012. The slowdown has been broad – Austria, Canada, Czech Republic, Denmark, Germany, Japan, Italy, Malaysia, Poland, Russia, Switzerland, Taiwan, Turkey, and the U.K. are all in contraction. Germany, the main horsepower for the EU, experienced the biggest drop in Industrial Output in four years, down -1.9% in April versus expectations for -0.5%. US exports of capital goods (ex. Autos) fell by 5.7%, the sharpest decline since September 2008, while imports fell 3.0%. Capex momentum has left the building. In the US the HIS Markit Composite PMI Index (Manufacturing and Services) saw activity drop to its lowest level since May 2016.


Geopolitical Angst

With the drama of the trade wars dominating headlines, it would be easy for US-based investors to miss the fireworks going on elsewhere. Here’s a quick rundown:

  • The recent European Parliament elections saw the coalition of center-left and center-right parties lose its majority for the first time ever. The Greens group became the fourth-largest voting block and the far-right (anti-euro and anti-immigration) gained ground, but less than expected. Silvio Berlusconi (who has become the unbeatable mole in the game of political whac-a-mole) managed to get elected as a member of the European Parliament for his Forza Italia party, go figure. Bottom Line: The widening political divide we see in the US is happening in Europe as well, with those against the EU gaining ground and common ground becoming a lot less common.
  • Friday Theresa May formally steps down as leader of the Conservative Party in the UK. She will remain prime minister of record until undoubtedly. The betting markets currently have Boris Johnson in the lead by a material margin. Now this matters because Boris and the EU don’t exactly get along. Given the ugly relationship there it is unlikely that the European Union would grant him a Brexit deal that would be more attractive to the UK than the one they gave May.  Bottom Line: Brexit is becoming more of a barbell with the most likely outcomes either a hard exit (brutal for both the UK and the European Union) or not exit at all.
  •  This week the European Commission issued a report that Italy has missed targets to rein in public spending and having failed to put its sovereign debt on a diet, is set to break through a cornerstone rule requiring deficits to remain below 3% of GDP. Within Italy, the leader of the far-right, Matteo Salvini, has been gaining political ground, setting the stage for one hell of a showdown. His tweet below says, “The only way to cut debt generated in the past is to cut taxes via the flat tax and allow Italians to work more and better. With the cuts, the sanctions and austerity, the only things that have grown are debt, poverty, temp-employment, and unemployment, we must do the opposite.” I’m getting out the popcorn for this battle! By the way, for those who think President Trump tweets a lot for someone with a full-time job, check out Salvini’s feed. My twitter feed is telling me that I clearly do not drink nearly enough coffee.
  • While the trade wars between China and now Mexico are taking much of the headlines, many of you might have been hearing how China is facing pressures internally from its banking sector. Recently Baoshang Bank was taken over by China’s banking and insurance regulator, the first such takeover in nearly 20 years. This may be just the tip of the banking iceberg. While China and India sit comfortably in our New Global Middle Class Investing themes, that growth is anything but linear and the level of debt China has been taking on to fuel growth has many very concerned. Remember that during the Great Recession, China served as the buyer of last resort, putting a floor under global demand. Its public/private sector balance sheet is a lot less attractive today.


Definitive Proof of Peak

Finally, if you aren’t yet convinced that we have already hit the peak of the economic cycle with the major economic risks now to the downside as we look forward, consider Cangoroo and this $890 BMW Scooter – yes, a scooter. I need a drink.

Revisiting Position Ratings as the Stock Market Grinds Higher

Revisiting Position Ratings as the Stock Market Grinds Higher

DOWNLOAD THIS WEEK’S ISSUE
The full content of Tematica Investing is below; however downloading the full issue provides detailed performance tables and charts.Click here to download.

Since our last issue, the stock market continued to move higher on the news that President Trump will soon be sharing his tax overhaul plan and Fed Chairwoman’s Yellen’s congressional testimony yesterday. We review Yellen’s comments below in greater detail, but the point is the Fed, in aggregate, sees enough oomph in the economy to keep its stated goal of up to three rate increase this year in the mix. Candidly, we didn’t expect Yellen to deviate from the script given the next Fed meeting is still several weeks away, and far more data will be had ahead of it.

With the market climbing, we had a number of strong performers on the Tematica Select List, including recently added Disruptive Technology company Nuance Communications (NUAN) and  Safety & Security play PureFunds ISE Cyber Security ETF (HACK). Both of those remain Buys at current levels. Several other positions are closing in fast on their respective price targets. Last week we trimmed back the position in Costco Wholesale (COST) and reduced it to a Hold from Buy. We’d note that’s a true Hold, not to be interpreted in the herd mindset as a loose Sell recommendation. We continue to see Costco benefitting from our Cash-strapped Consumer theme and its plan to open additional warehouse clubs, which boosts higher margin membership fee income.

Similarly, this morning we are reducing our ratings on both Universal Display (OLED) and PowerShares NASDAQ Internet Portfolio ETF (PNQI) from Buy to Hold. Both have enviable runs, the former as more talk of Apple’s next iPhone iteration heats up and the potential of OLED screen and the latter given the moves we’ve enjoyed in our Facebook (FB) and Alphabet (GOOGL) shares. As we adjust these ratings, we’re also going to layer in stop losses as well:

  • We will set the OLED stop loss at $60, which ensures a gain of at least 13 percent.
  • And set a stop loss at $88 for PNQI shares, which ensures a 5 percent gain.

Positions that we’ll be watching closely as they move closer to our price targets include AMN Healthcare (AMN), Facebook FB), Alphabet (GOOGL) and Disney (DIS) shares.


What’s all the Yellin’ About Yellen?

As we mentioned above, yesterday Fed Chairwoman Janet Yellen began her two day session in front of Congress for her semiannual testimony on monetary policy. Last night Tematica Chief Investment Officer, Chris Versace, joined CGTN’s Global Business to discuss the testimony, which was very much a non-surprise given the Fed Chair is not likely to tip the Fed’s policy hand in between meetings, particularly when we have ample economic data ahead and we’ve yet to get the particulars on several Trump policies. In her prepared speech to the Senate Banking Committee yesterday, Yellen said the central bank can continue to raise interest rates slowly although it would be “unwise” to wait too long. Pretty much more of the same if you ask us.

Over the last few months, the pace of manufacturing activity has picked up as evidenced by the monthly ISM manufacturing data and manufacturing PMI metrics from Markit Economics. And while it has us thinking another hike is in the cards, we agree with Yellen that with little meat on the Trump policy bone as yet, the Fed might hold out until more specifics are shared before boosting rates. This also means much more economic data to factor into their economic group-think. Odds are this means a rate hike is more likely at the May FOMC meeting than at the March one.

Today Yellen takes the stage in front of the House Financial Services Committee, and while it’s a bit mean to say we do tend to get a hearty chuckle out of watching some of those folks ask questions they don’t really understand. That good fun aside, we don’t expect Yellen to deviate from the Fed script anytime soon.


Updates, Updates, Updates

Over the last few days, there were several noteworthy items for a few of our Tematica Select List holdings. The following is a roundup of those developments.

The Walt Disney Co. (DIS)    Content is King

Disney raised admission prices for U.S. theme parks, by as much as $5 for certain one-day tickets at the Magic Kingdom theme park in Orlando and Disneyland. The cost of a regular ticket at the Magic Kingdom, effective yesterday, is now $115, while the same at Disneyland is now $110. The $124 peak price at Magic Kingdom, which includes many summer days and holidays, is unchanged.

As a consumer, we may cringe at the Disney’s ticket prices, but there is no denying its parks remain a key attraction, and new exhibits/rides, such as Frozen and eventually Star Wars, will only serve to keep people coming. From an investor perspective, price increases like these tend to drive margin expansion and profits, and that’s something we certainly like.

  • Our price target on Disney remains $125, and we continue to rate DIS shares a Buy. 


AT&T (T)  Connected Society

AT&T competitor Verizon (VZ) announced it was returning to unlimited data plans, in part to combat Sprint (S) and T-Mobile USA (TMUS). Typically, there tends to be a herd mentality when such programs are introduced, which means we’ll be watching to see if AT&T joins the fray — and if so, how the company tiers its product offering.

Also with AT&T, when asked about the pending merger with Time Warner (TWX), CEO Randall Stephenson said, “We still think we’ll be closed by the end of the year.” That matches recent comments from Time Warner, and likely means AT&T shares will be somewhat rangebound until the proposed merger clears its review by the Department of Justice. Time Warner shareholders will meet today to decide on the company’s proposed $86B merger with AT&T — a “yes” vote is expected.

  • We continue to rate T shares a Hold, with a $45 price target. All things being equal, we’d look to revisit our rating on the shares below $40.
Amazon (AMZN)    Connected Society

As it relates to our position in Amazon, over the weekend there was news that FedEx (FDX) has launched FedEx Fulfillment, a logistic network for small and medium businesses. Given the accelerating shift to digital commerce (one of our key investment pillars for AMZN shares), it comes as little surprise that FedEx would seek to replicate Amazon’s Fulfilled By Amazon (FBA) business. For FBA transactions, Amazon receives a portion of each sale, but could, at the same time, be competing with the vendor.

The differentiator, in our view, is Amazon’s Prime service, which offers “free” two-day delivery for the shopper, and a growing list of items/services. Given the overall shift to digital commerce, odds are this rising tide will lift several boats, but to us, the real question is how vendors will offset shipping costs paid by shoppers. If they stick it to shoppers, this effort by FedEx could be more sizzle than steak.


AMN Healthcare (AMN)    Aging of the Population

The December JOLTS report showed yet another month-over-month increase in health-care and social assistance jobs, which led to a 12 percent increase in December 2016 compared to December 2015. Meanwhile, hiring levels in December remained relatively unchanged, up only 2.1 percent year over year.

In our view, this confirms the difficulty in finding quality staff, which bodes well for AMN’s business. Longer term, by 2020, the U.S. is expected to need 1.6 million more direct-care workers than in 2010, which equates to a 48 percent increase for nursing, home-health and personal-care aides over the decade, due primarily to the aging of 78 million baby boomers.

Our intent remains to nibble on AMN shares closer to $35 to build out the position at better prices. AMN will report its quarterly earnings tomorrow (Feb. 16) and consensus expectations call for EPS of $0.54 and revenue of $476.4 million.

  • We have a $47 price target on AMN and at current levels, that leaves 21 percent upside; as such we will look to revisit the rating and the price target after the company’s earnings announcement.


Dycom Industries (DY)  Connected Society

Our shares of this Connected Society infrastructure play rose more than 2 percent since last week following the news that CenturyLink’s (CTL) 2017 capital spending will be $2.6 billion vs. $3.0 billion in 2016. While overall spending is ticking down, on its earnings call CenturyLink management shared that its “broadband investments for 2017 are expected to actually be a little higher than 2016 levels.” Combined with 2017 capital spending plans for AT&T, Verizon, and Comcast, it looks like total capital spending on broadband and wireless will be up modestly year over year with a greater portion of spending on network capacity and new technologies (5G, Gigabit fiber).

We continue to see Dycom as a prime beneficiary of that wireless and wireline capital spending. We are going to sit tight and be patient with the position given our view that, worst case, it’s only a matter of time for next-generation network technologies to be deployed.

  • We rate Dycom shares a Buy with a $115 price target.


International Flavors & Fragrances (IFF) Rise & Fall of the Middle Class

After today’s market close, IFF will report its December quarter earnings. Consensus expectations have the company delivering EPS of $1.16 on revenue of $752.3 million. As we’ve shared previously, flavor and fragrance competitor results set a sound footing for IFF’s quarterly earnings that will be reported this week (Feb. 15).

We remind subscribers that given IFF’s international exposure, currency is likely to weigh on its December-quarter results as well as its near-term outlook. But, as we have said before, we see that largely reflected in the share price over the last few months.

  • We continue to see ample upside to our $145 price target over the coming quarters fueled by rising disposable income, particularly in the emerging markets, but also from the shift in consumer preferences to natural/organic flavors.


Nuance Communications (NUAN)  Disruptive Technology

Following solid December-quarter earnings last week, shares of this voice technology company rose more than 6 percent over the last several days, bringing our return in the shares to roughly 9 percent. In our view, the performance in the most recent quarter shows that despite all the headway we are hearing about Amazon’s (AMZN) Alexa voice digital assistant and similar offerings from Alphabet (GOOGL), there is ample opportunity in this expanding voice technology market for Nuance and its offerings to the health-care, mobile/auto, enterprise and imaging markets.

During the conference call Nuance shared that while there has been growing interest in voice interface technology in the last few years, the arrival of Amazon and Alphabet products has accelerated the pace of investment across several Nuance customer verticals. These opportunities along with Nuance’s expanding solution set, which includes artificial intelligence and analytics, bodes well for the company’s competitive position in the coming quarters.

Longer term, Tractica forecasts total voice digital assistant revenue will grow from $1.6 billion in 2015 to $15.8 billion in 2021. That is also likely to put Nuance on the M&A contender list for those larger entities that need to expand their voice technology capabilities.

  • Our price target on the shares remains $21 and our rating a Buy. All things being equal, the line at which we will revisit that rating is around $19

DOWNLOAD THIS WEEK’S ISSUE
The full content of Tematica Investing is above; however downloading the full issue provides detailed performance tables and charts. Click here to download.