
Improving Data? Income or Tax Receipts
This morning we learned that Real Disposable Personal Income rose at the fastest month-over-month rate since April 2015, up 0.6 percent.
Looking at a year-over-year basis, real Disposable Personal Income rose at the fastest rate since October 2016. That growth in income however, didn’t translate into spending with Personal Consumption Expenditures nearly flat, with an increase of just 0.055 percent on a month-over-month basis.
On a year-over-year basis, May’s spending was up 4.2 percent, although the rate of increase has been slowing since March.
Rising income levels are supported as well by recent comments we’ve seen.
“Labor, we continue to see some pretty good inflationary pressure…there’s 3% to 4% wage inflation in our labor number, right now; we’re able to offset some of that with productivity enhancements. But labor continues to be something that we’re focused on” —Darden CEO Gene Lee (Restaurants)
This is consistent with the Consumer Confidence data we’ve been seeing that show strong sentiment for Current Conditions, but Expectations have been trending down significantly. Folks feel pretty good about their situation today, which makes sense if incomes are rising at a faster rather, but aren’t too confident in the future, which would reasonably result in less spending and more saving.
Looking at federal tax receipts gives us a different image and shows an economy in no way accelerating, which is consistent with much of the data we have been discussing recently, but contrasts with today’s income data. In fact, individual income taxes on are track to drop by 0.2 percent of GDP this year.
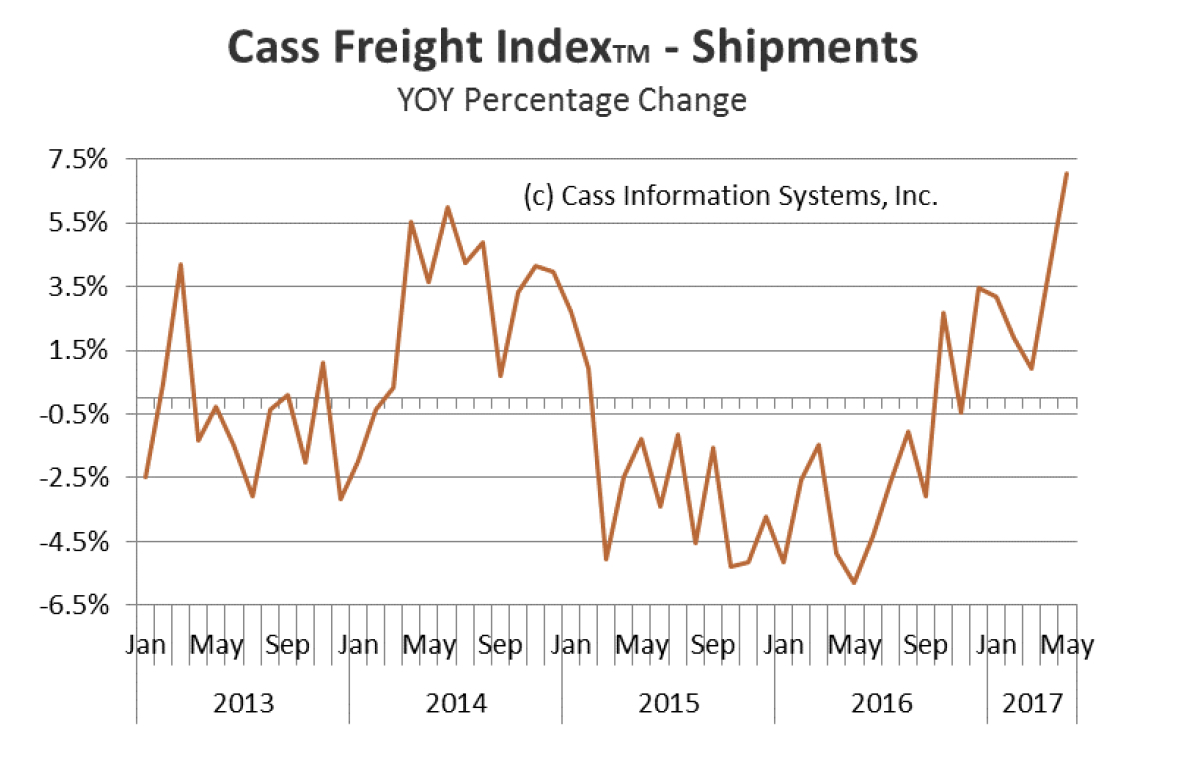
Back to the positive side, the recent Cass Freight Index Report gives us cause for optimism. Cass shows that both Shipment and Expenditures have been positive for five consecutive months and even more importantly, look to be accelerating. This index had been in negative territory for 20 months, breaking out back in last October, making it one of the first indicators that a recovery in freight had begun.
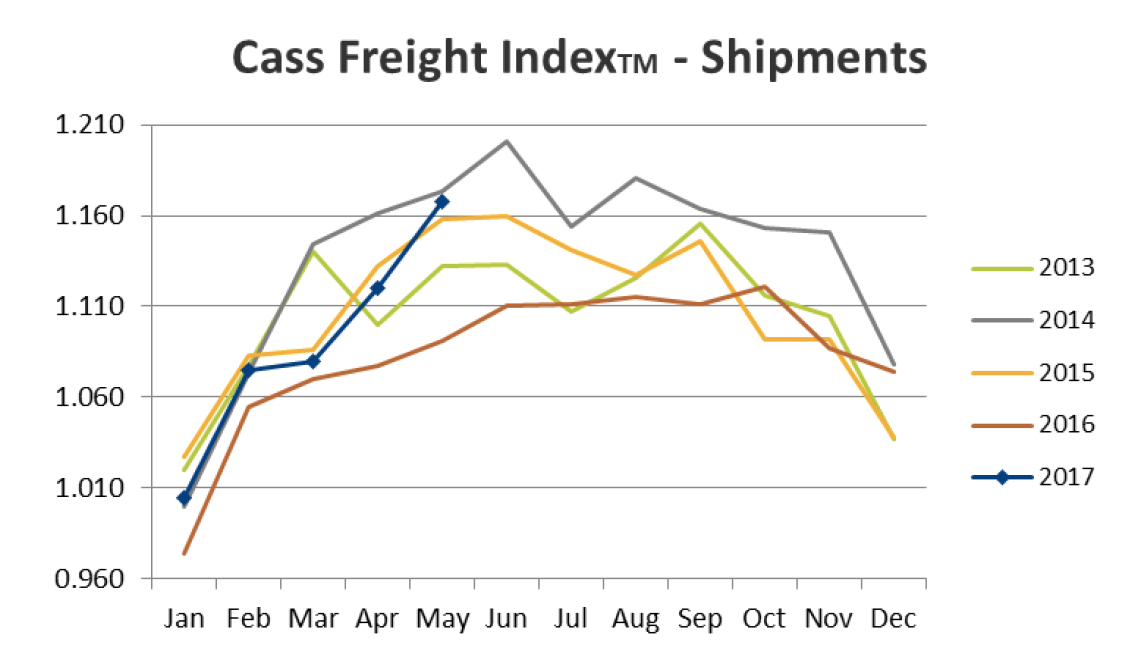
If we look at the typical trends during a year, 2017 is shaping up to look pretty good as well.
This more optimistic view is supported by the Baltic Dry Index.
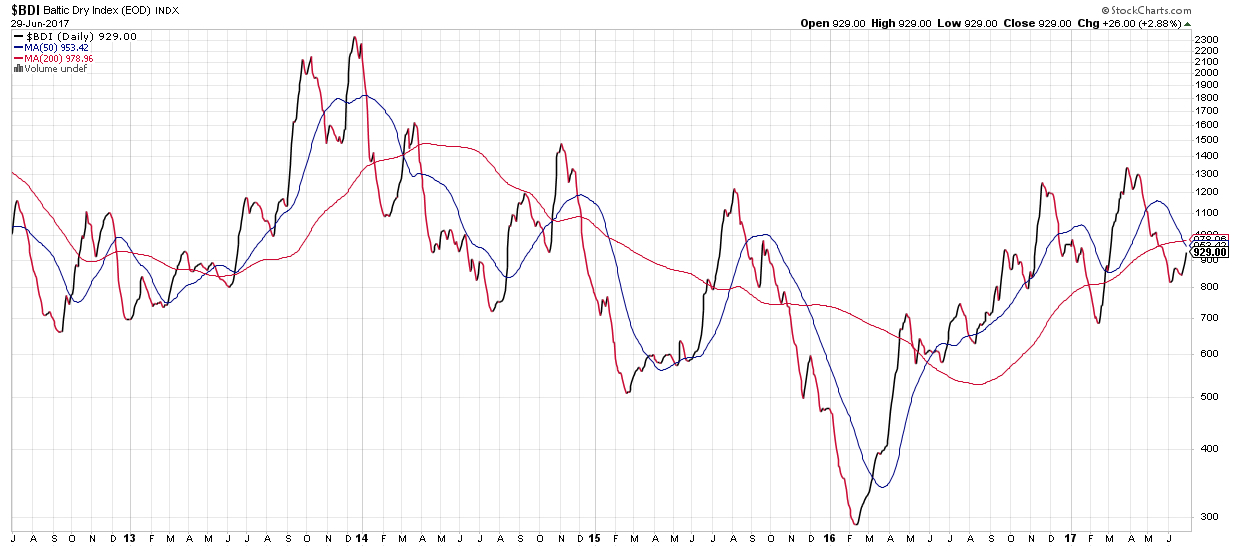
However, we do have some concerns when we look at the Index today. After having moved up since February 2016, with a few bumps along the road, we now see the 50-day moving average has turned negative and the 200-day moving average looks to be flatlining. The 50-day had turned negative earlier this year, then reverted, but this is the first time we’ve seen the 200-day flatlining since the start of this uptick, which could indicate a material change in direction. This could then be reflected later in the Cash Freight as this index revealed an upturn prior to Cass and could be foreshadowing a directional change again.
Bottom Line: Consumers feel good about today which makes sense with improving incomes. They are nervous about the future though, so spending isn’t keeping up with incomes. When we look at other data coming in, we see that businesses have excessive levels of inventory on hand, which is more problematic when spending declines. How long can transports look good when businesses have too much inventory and consumers are spending less?
Taking a step back we recall that 1.5 million baby boomers are hitting 70 every year for the next 15 years and most don’t have enough in savings and on top of that, Millenials are saddled with record levels of student loan debt.