The market is going great so no need to worry, right?

The market is going great so no need to worry, right?


There are weeks when sitting down to write this piece is tough because not much worthy of note has happened in the markets or the economy outside of the usual noise. This week, that was most definitely not the case. Thank God it is Friday – we all need a break.


New Market Highs and the Economy Gets Uglier

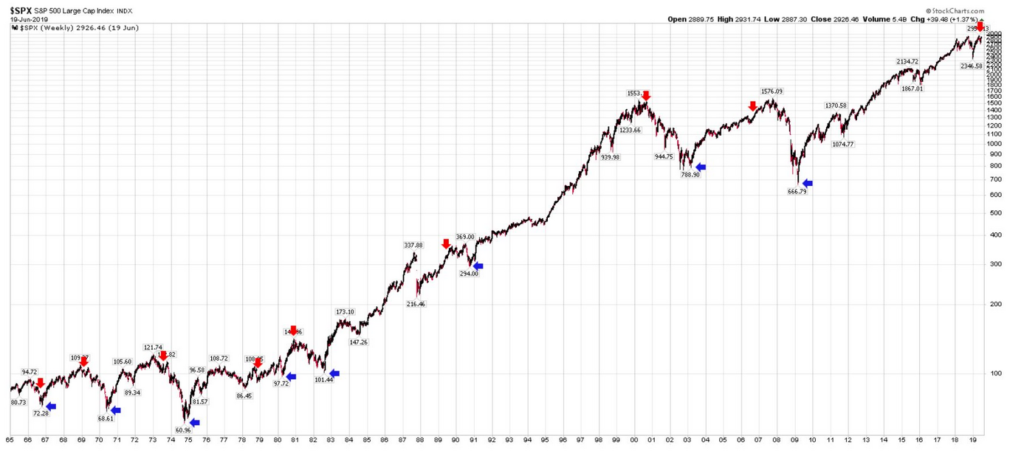
Thursday the S&P 500 closed at a new all-time high and is now above its 50-day, 100-day and 200-day moving averages. The post Federal Reserve Open Market Committee meeting debrief gave the market essentially what it wanted, a significantly more dovish stance with plenty of reasons to believe future rate cuts are imminent. Perhaps the Marty Zweig adage, “Don’t fight the Fed,” has been flipped on its head to “Fed, don’t fight the markets.” Unemployment is at multi-decade lows with more job openings than unemployed persons, rising hourly earnings, and improving retail sales while the market hits all-time highs and yet the Fed is preparing to stimulate. Yeah, something’s off here.

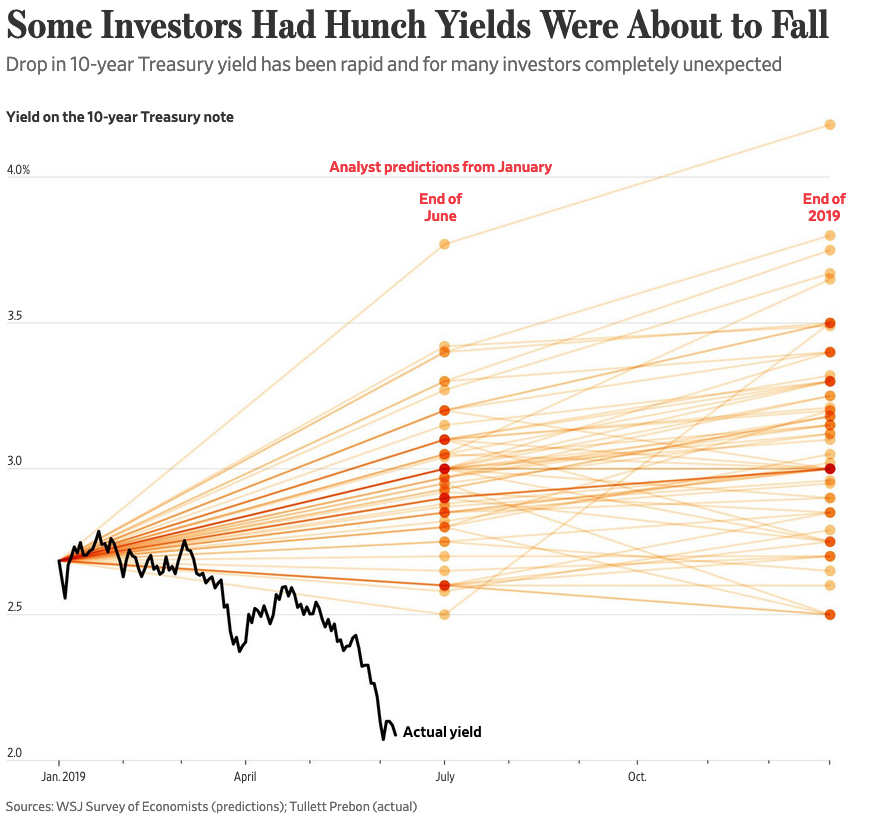
Stocks may be partying like it is 1999 (for those who remember that far back) but the yield on the 10-year closed at 2.01% Thursday. To put that in context, on June 9th when the 10-year was down to 2.09%, the Wall Street Journal ran an article asserting that, “Almost nobody saw the nosedive in bond yields coming, but a few players were positioned well enough to profit. Some think there is more room for yields to fall further,” along with this chart. To be clear, despite not one respondent predicting the yield on the 10-year would fall below 2.5% in 2019, none of these economists are idiots, but the thing is they all tend to read from the same playbook.

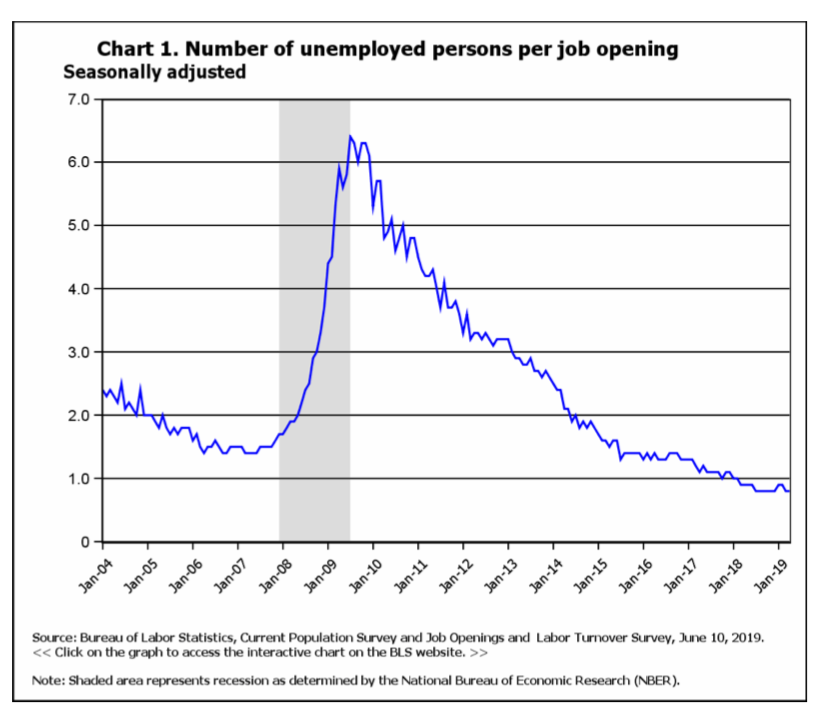
The stock market is giddy over its expectations for lower rates, yet the spread between the 3-month and the 10-year Treasury has been inverted for four weeks as of this writing, not exactly a ringing endorsement for economic growth prospects. Every time this curve has been inverted for 4 consecutive weeks, it has been followed by a recession (hat tip @Saxena_Puru) for this chart. Note that the chart uses 10-year versus 1-year until the 3-month became available in 1982. Much of the mainstream financial media and fin twit believe this time is different. Time will tell.

The red arrows denote 4 consecutive weeks of inversion and the blue arrows mark bear-market lows (20% declines).

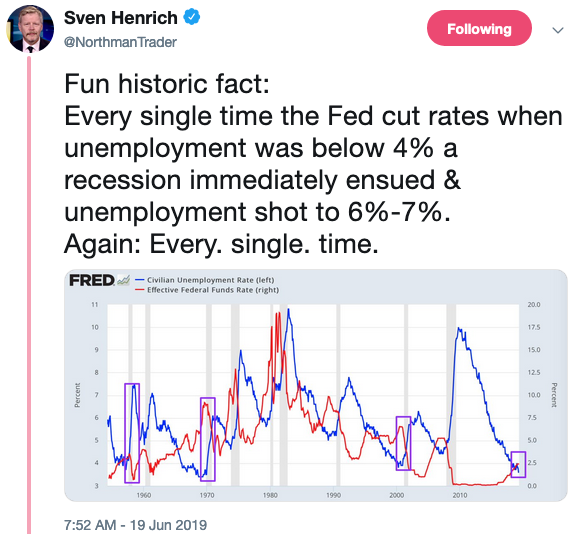
Then there is this, with a hat tip to Sven Henrich whose tweet with a chart from Fed went viral – that in and of itself says a lot.

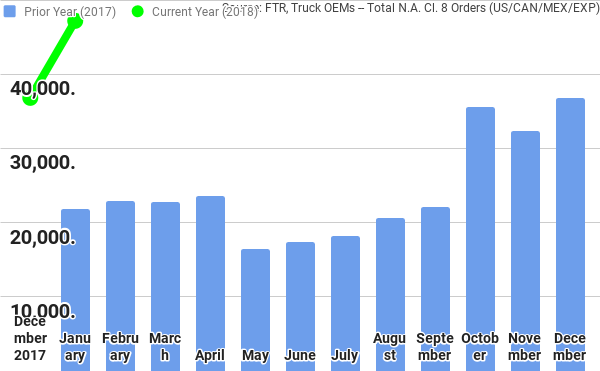
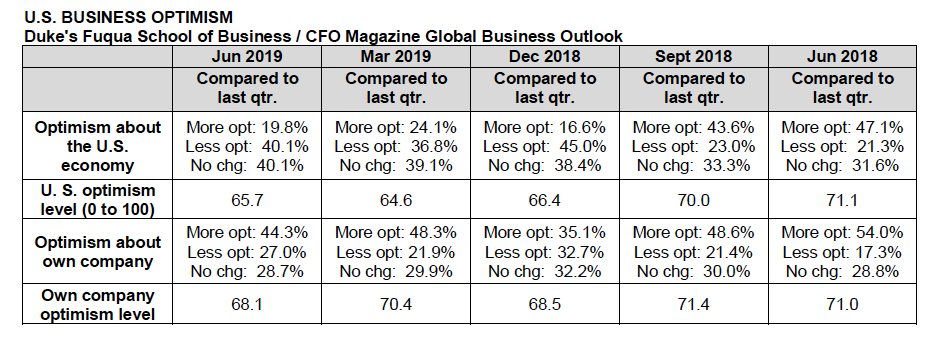
Both US imports and exports have declined from double-digit growth in 3Q 2018 to essentially flat today. The recent CFO Outlook by Duke’s Fuqua School of Business found that optimism about the US and about their own companies amongst CFO’s had fallen from the prior year.

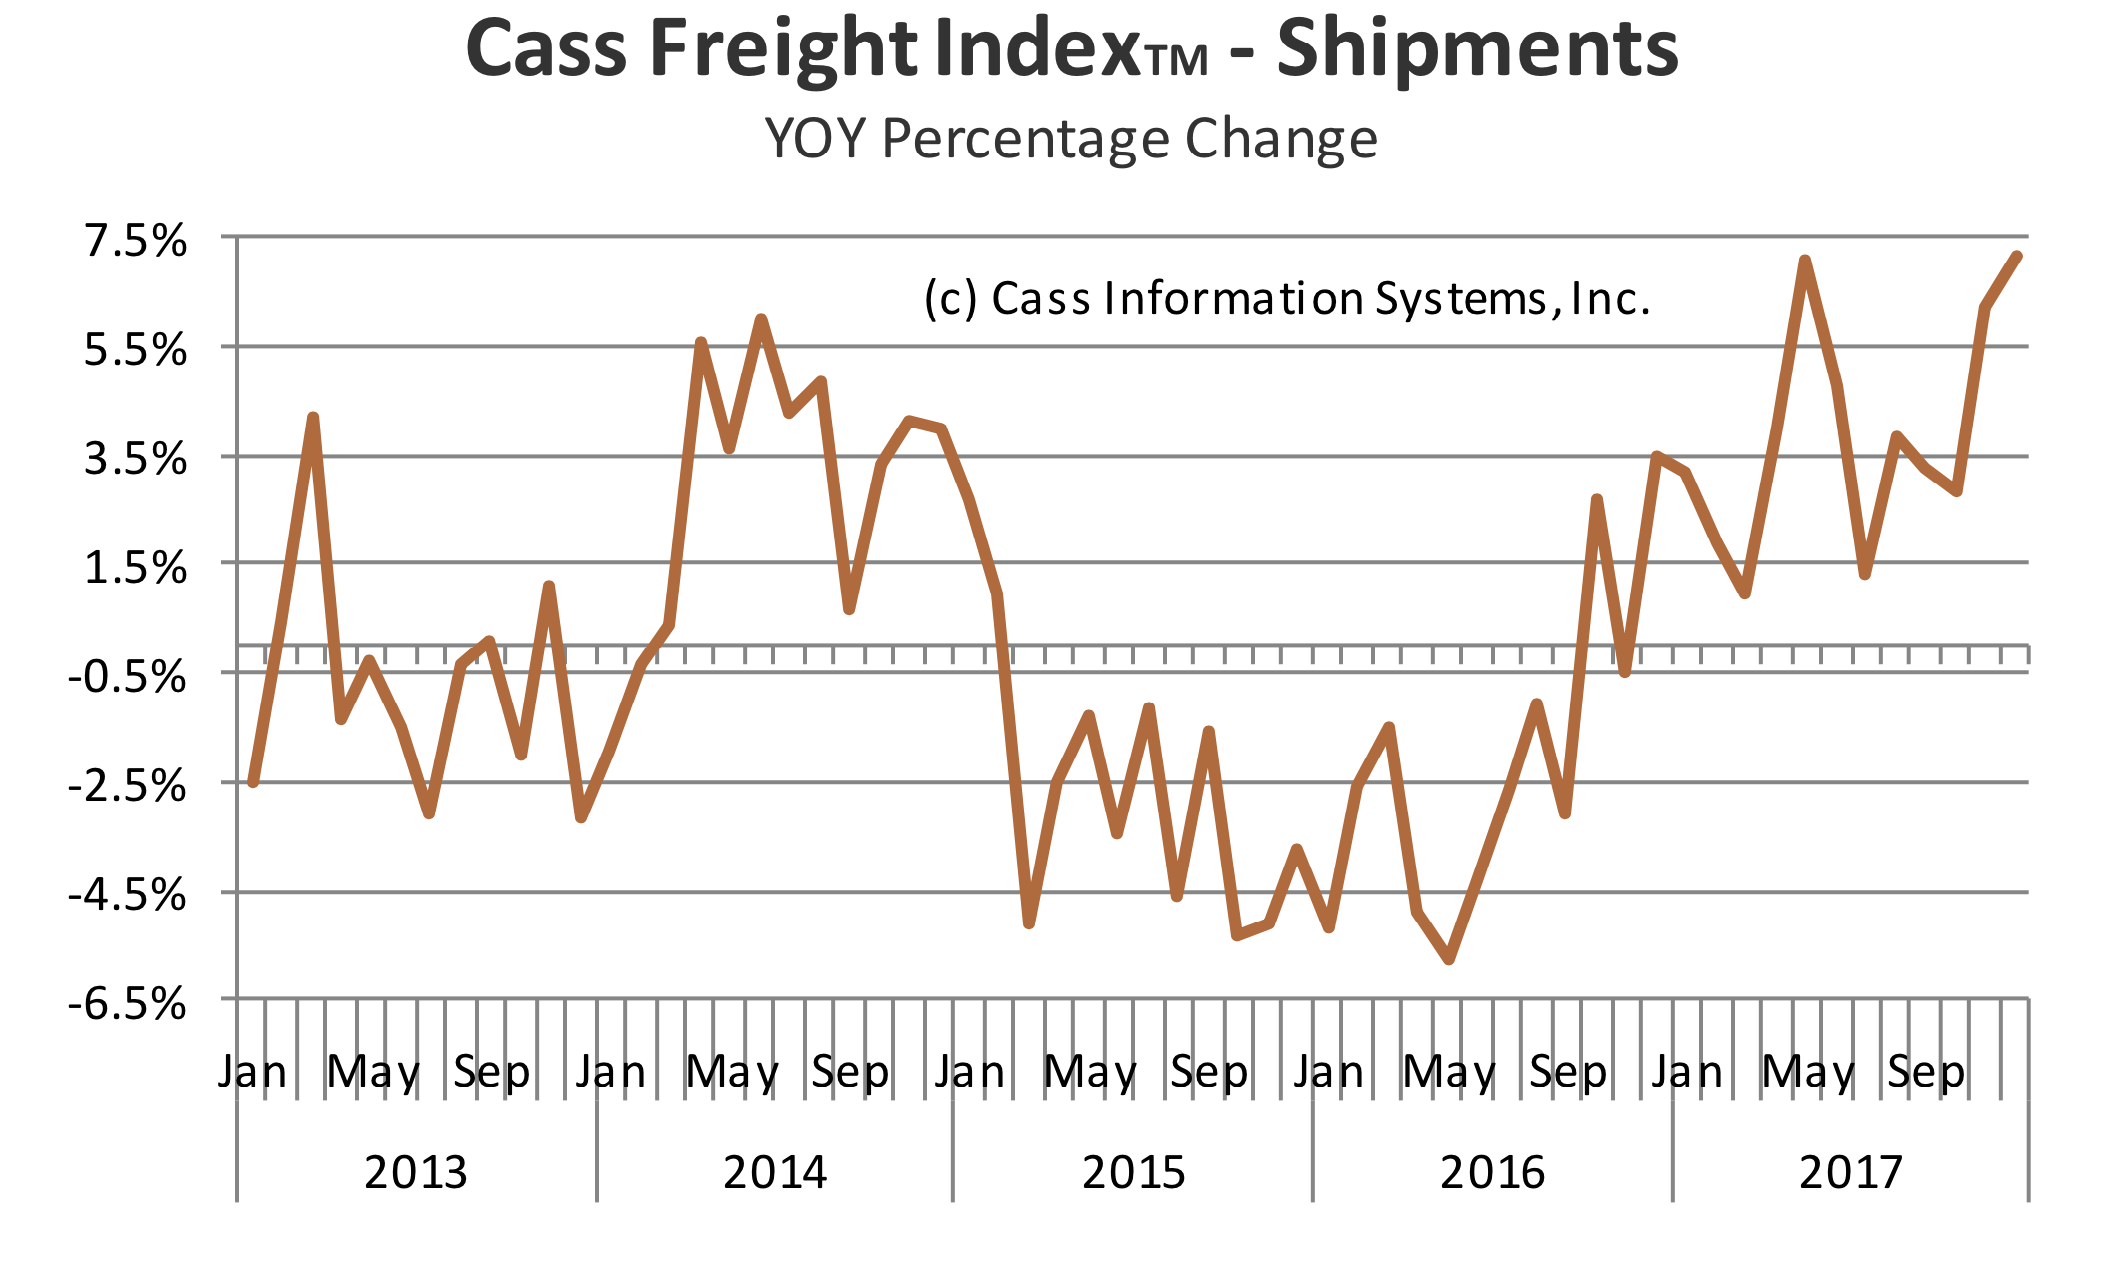
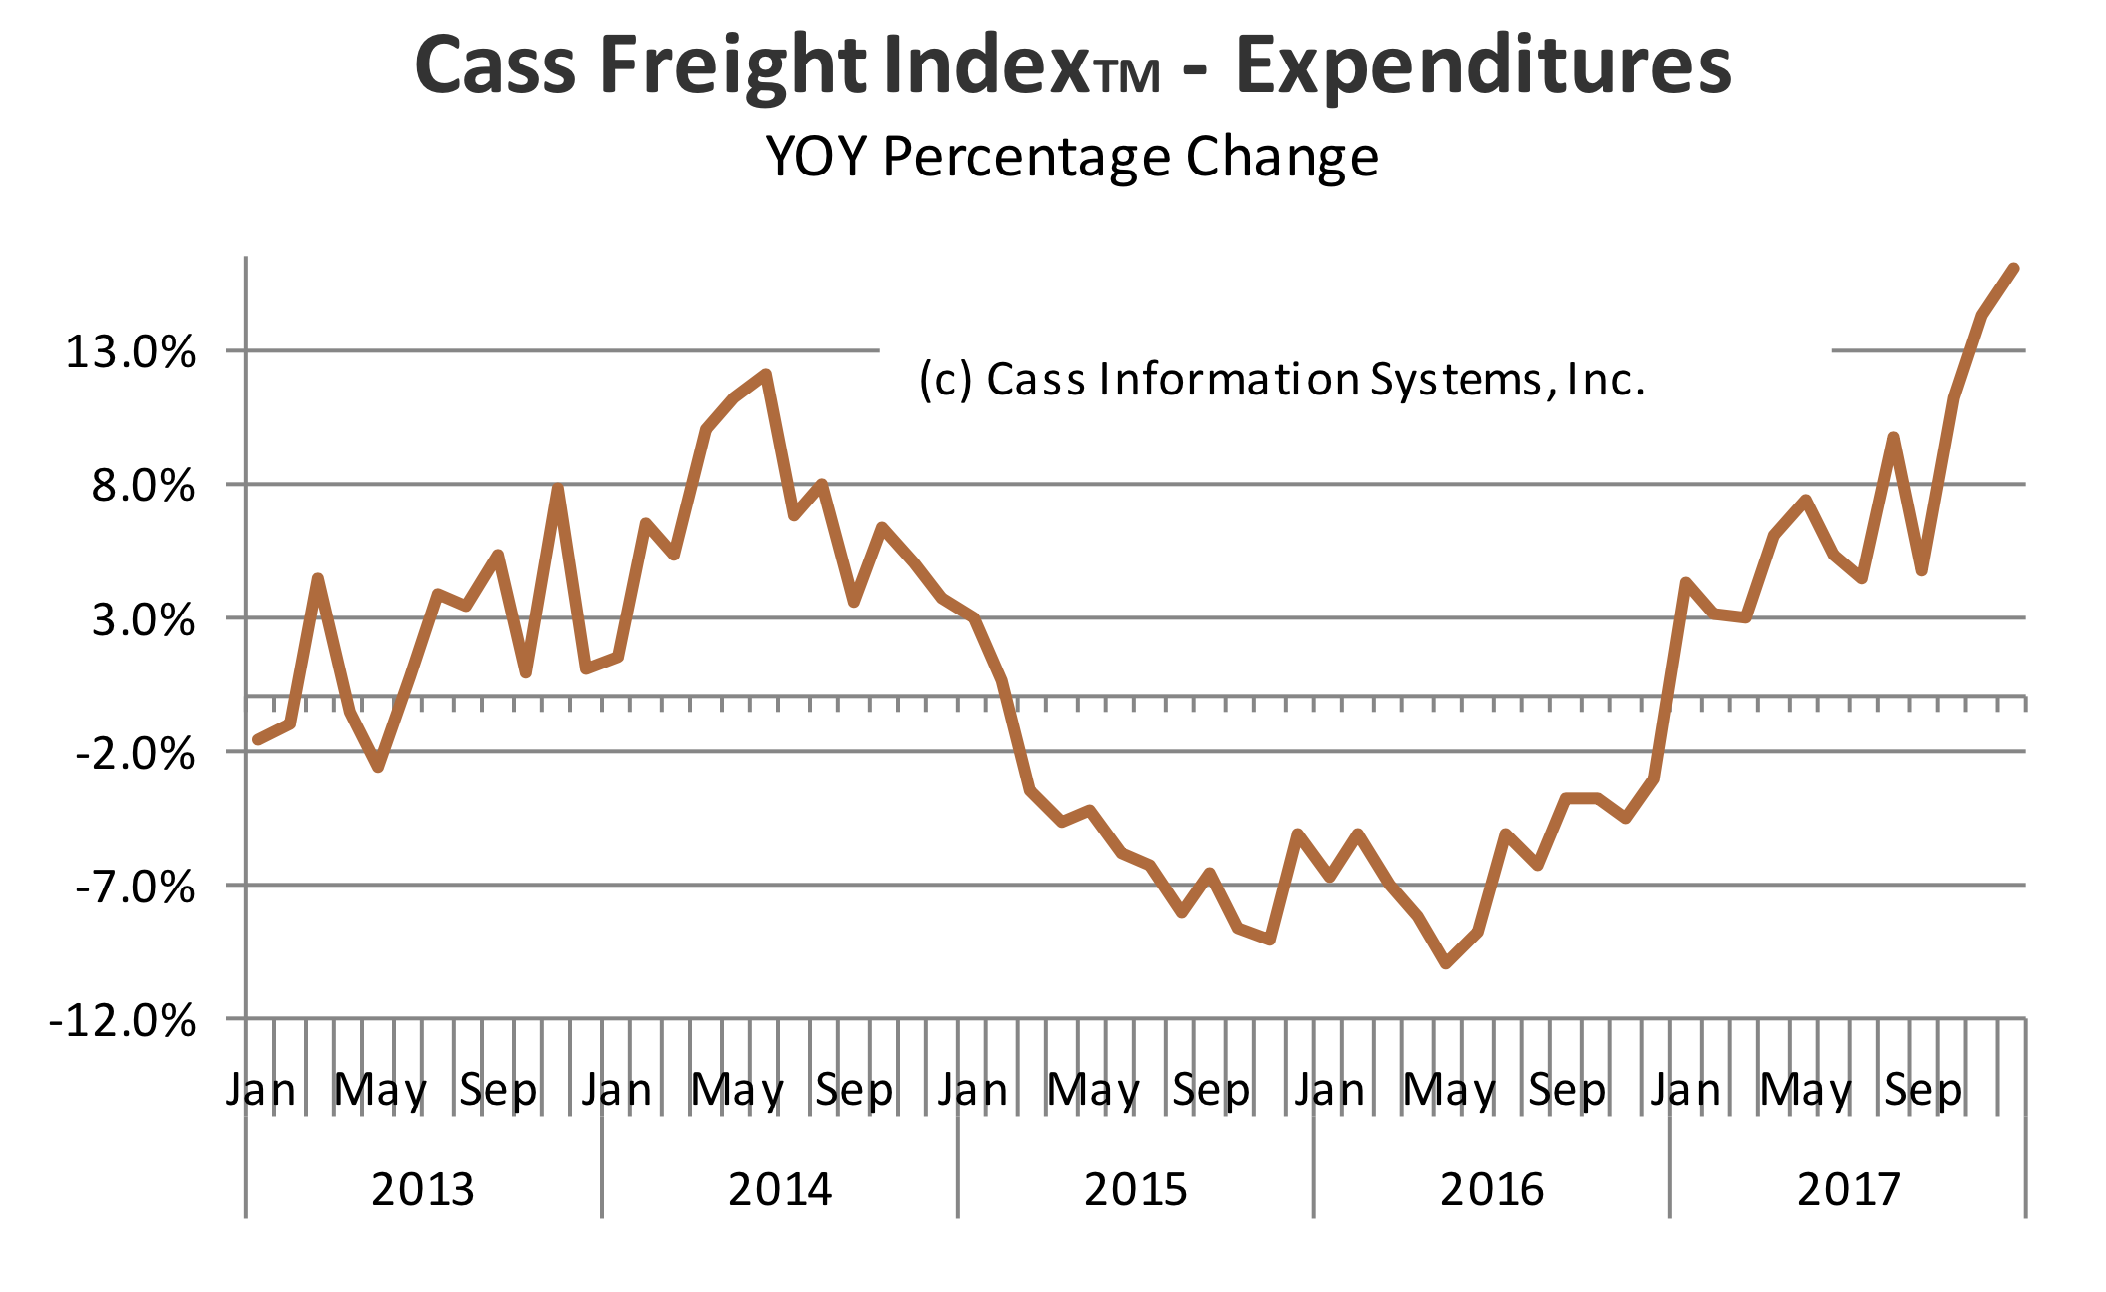
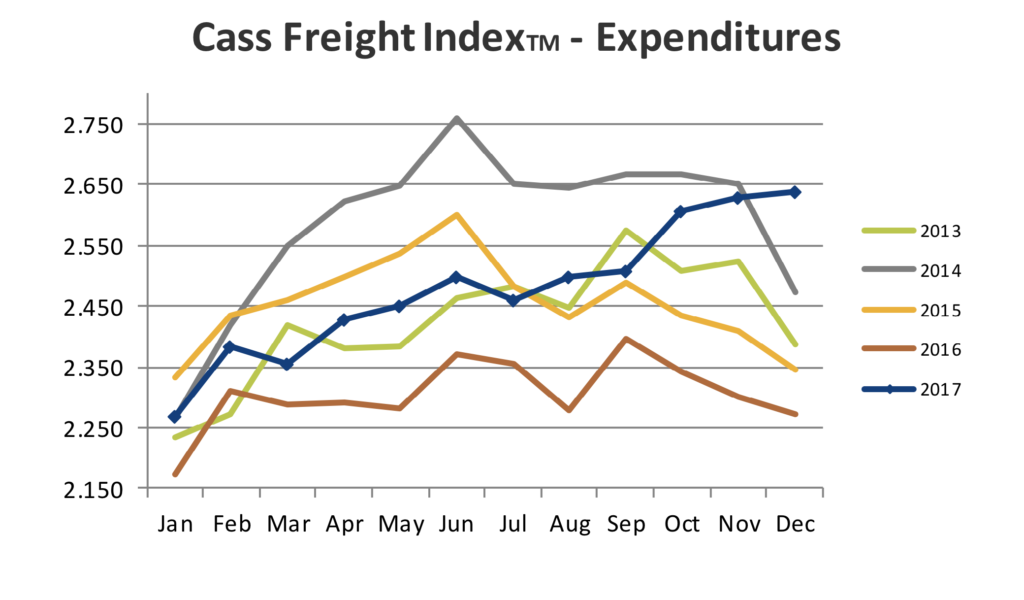
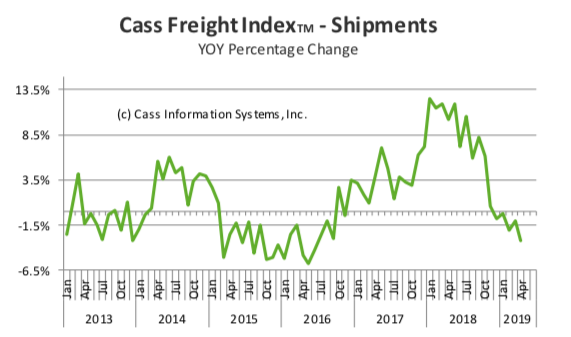
The shipments of goods being moved around the country have plummeted since the beginning of 2018, as shown by the Cass Freight Index.

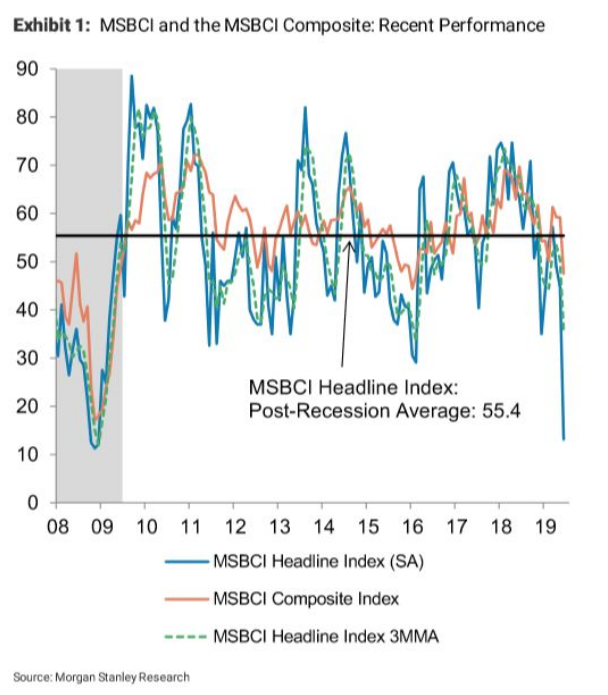
The Morgan Stanley Business Conditions Index fell 32 points in June, the largest one-month decline in its history.

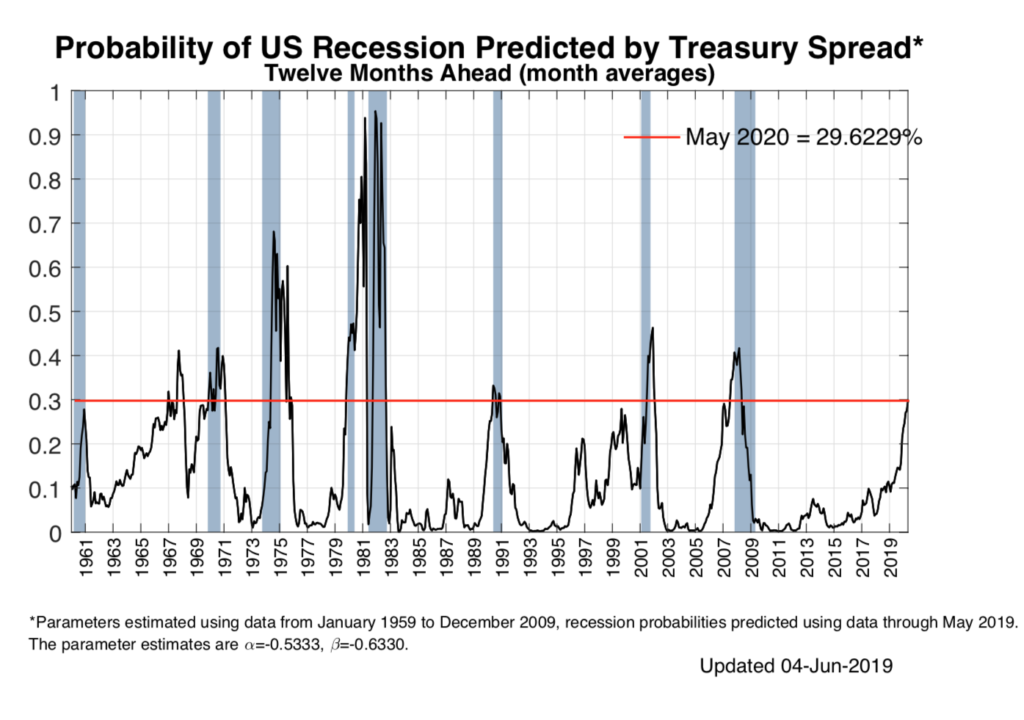
If all that doesn’t have your attention, consider that the New York Fed’s recession probability model puts the probability that we are in a recession by May 2020 at 30%. Note that going back to 1961, whenever the probability has risen to this level we have either already been in a recession or shortly entered one with the exception of 1967 – 7 out of 8 times.

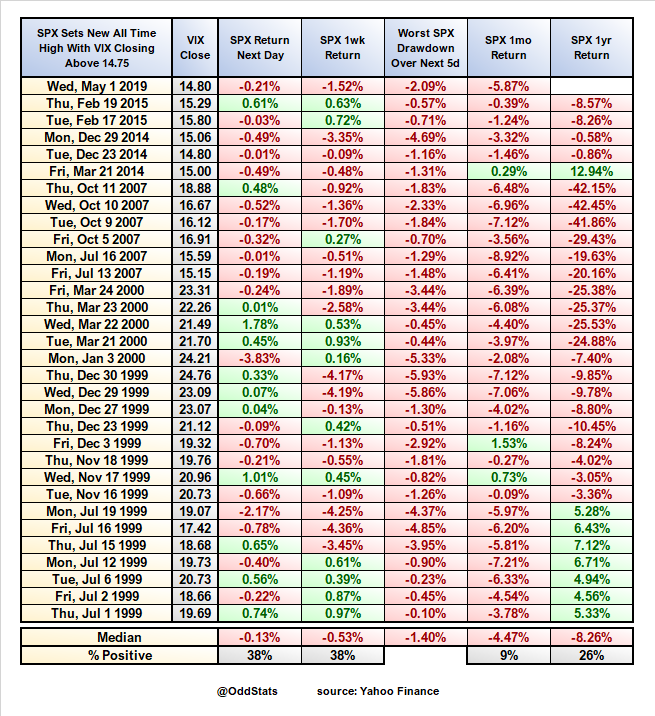
But hey, the market is going great so no need to worry right? If that’s what you are thinking, skip this next chart from @OddStats.


Geopolitics – From Bad to Oh No, No No

Brinksmanship with Iran continues as in the early hours of Friday we learned that the US planned a military strike against Iran in response to the shooting down of an American reconnaissance drone. The mission was called off at the last minute after the President learned that an estimated 150 people would likely have been killed. Frankly, the official story sounds a bit off, but what we do know is that we are in dangerous territory and one can only hope that some cooler heads prevail, and the situation gets dialed back a whole heck of a lot.

Given we weren’t enjoying enough nail-biting out of the Middle East news, an independent United Nations human rights expert investigating the killing of Saudi journalist Jamal Khashoggi is in a 101-page report recommending an investigation into the possible role of the Saudi Crown Prince Mohammed bin Salam citing “credible evidence,” and while not specifically assigning blame to bin Salam, did assign responsibility to the Saudi government. This week the US Senate voted to block arms sales to Saudi Arabia, rebuking the President’s decision to use an emergency declaration to move the deal forward. This matters when it comes to investing because there are some seriously high-stakes games being played out that have the potential to suddenly rock markets without any warning.

Over in Europe more and more data points pointing to a slowing economy, which led to European Central Bank President Mario Draghi to announce that more stimulus could be in the works if inflation fails to accelerate. At the ECB’s annual conference in Sintra, Portugal Draghi stated that, “In the absence of improvement, such that the sustained return of inflation to our aim is threatened, additional stimulus will be required.” It isn’t just inflation that is troubling the region. Euro Area Industrial Production (ex Construction) has only seen increases in 2 of the last 11 months.

Italy continues to struggle with its budget deficit outside the limits allowed by the European Union, leading to a battle between Rome and Brussels. Friday Deputy Prime Minister Matteo Salvini (head of the euro-skeptic Lega party) threatened to quit his position if he is not able to push through tax cuts for at least €10 billion. While the US has been laser-focused on the Fed (and the president’s tweets) the Italian situation is getting more tense and a time when UK leadership with respect to Brexit is also getting a lot more tense. To put the Italian problem in perspective and understand why this problem is not going away, look at the chart below.

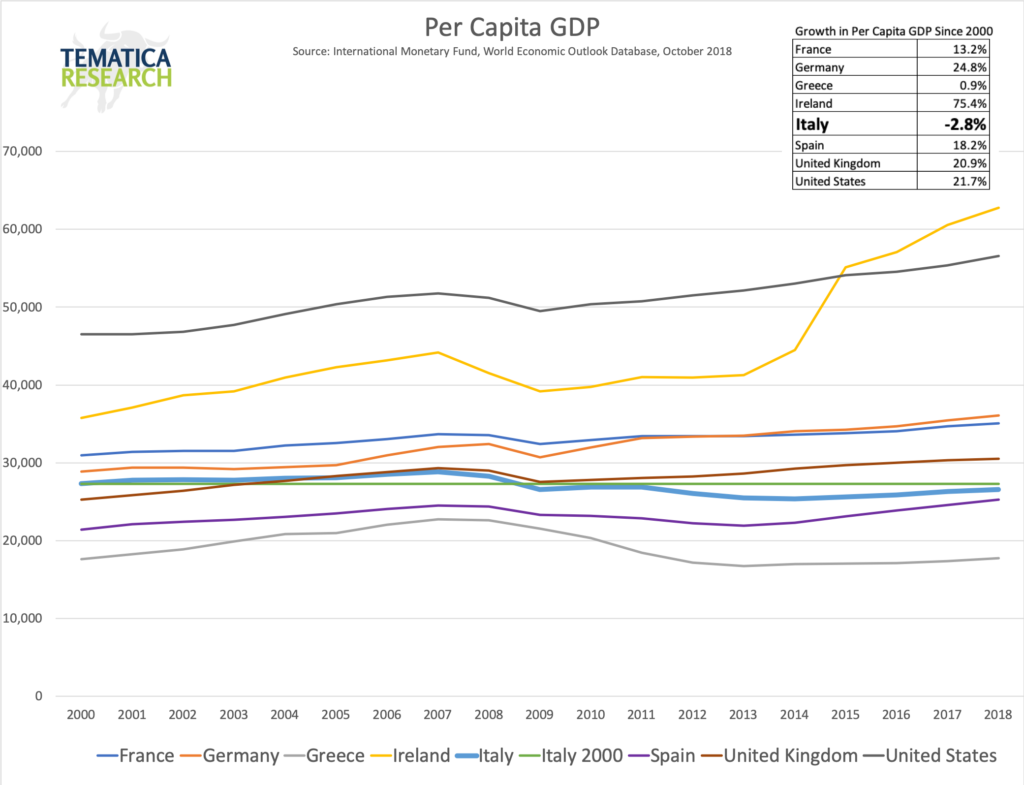
Today, Italy’s per capita GDP is 2.8% BELOW where it was in 2000 while Germany is 24.8% higher. Even the beleaguered Greece has outperformed Italy. Italy’s debt level is material to the rest of the world, its economy is material to the European Union, its citizens are losing their patience and its leadership consists of a tenuous partnership between a far-right, fascist-leaning Lega and a far-left, communist(ish) 5 Star movement lead by folks that very few in the nation respect. So that’s going well.

As if the European Union didn’t have enough to worry about as its new parliament struggles to find any sort of direction or agreement on leadership, the parliamentary process for selecting the next Prime Minister of the UK is down to two finalists. Enthusiam is rampant.

A hard Brexit is looking more likely and that is not going to be smooth sailing for anyone.


The Bottom Line

All this is a lot to take in, but there is a bright light for the week. Anna Wintour, Vogue’s editor-in-chief and eternal trend-setter, has given flip-flops her seal of approval. So, we’ve got that going for us. If that didn’t put a little spring into your step, I suggest you check out this twitter feed from Paul Bronks. Your soon-to-be more swimsuit ready abs will thank me, but your neighbors will wonder what the hell is going on at your place.

TRADE ALERT: Freight pain leads to this Economic Acceleration/Deceleration addition

TRADE ALERT: Freight pain leads to this Economic Acceleration/Deceleration addition


KEY POINTS FROM THIS ALERT:

  • We are issuing a Buy on truck company Paccar (PCAR) with an $85 price target as part of our Economic Acceleration/Deceleration investment theme.

With the market’s volatility over the last several days, a number of stocks are revisiting levels that are 5%, 10%, 15% lower than they stood at end of January. And while investors have been thunderstruck by the market gyrations, the day to day data from the December quarter earnings season as well as recent economic data, has continued to confirm certain opportunities. One of the recurring drum beats this earnings season has been companies ranging from Tyson Foods (TSN, Hershey (HSY), Packaging Corp. of America (PKG), Sysco (SYY) and J.M. Smucker (SJM) to Tractor Supply (TSCO) and Prestige Brands (PBH) talking about rising freight costs and the impact on earnings.

One of the culprits is the national shortage in available trucks, which has sent shipping costs soaring, with retailers and manufacturers in some cases paying over 30% above typical rates to book last-minute transportation for cargo. This, of course, goes hand in hand with the accelerating shift toward digital commerce that we talk about, a shift that led Amazon to correctly assess back in 2013 that as more shoppers bought products online, “parcel volume was growing too rapidly for existing carriers to handle.” As that shift to digital commerce has happened, we’ve seen that forward-looking view come to play out, and odds are it’s only going to get worse. According to Statista, e-commerce sales accounted for 9.1% of total U.S. retail sales in 3Q 2017, but we see that only growing further. In South Korea, e-commerce represented 18% of all retail sales in 2016 with forecasts calling for that percentage to reach 31% by 2021. We may not reach such a level for years to come, but each percentage point that e-commerce gains, means more product that needs to be shipped from a warehouse to the buyer.

Historically, the trucking industry has been associated with the economic cycle. When the economy is growing, more goods (parts, subassemblies, products) need to be shipped to customers at factories, distribution sites, warehouses and so on. According to the American Trucking Association, the trucking industry accounts for 70.6% of tonnage carried by all modes of domestic freight transportation, including manufactured and retail goods. This has made freight traffic a good barometer of the economy, and the December year over year increase of 7.2% in the Cass Shipments Index capped off a year in which the ATA’s truck tonnage index rose 3.7%, the strongest annual gain since 2013.


As truck tonnage climbed in late 2016 and 2017, industry capacity has been tightening after tepid tonnage in most of 2015 and the first half of 2016 leading to the robust jump in freight costs we described above. This data point from DAT Solutions puts in all into perspective – “there were about 10 loads waiting to be moved for every available truck in the week ending Jan. 20, compared with three in the same week last year…”


As freight costs climbed in the back half of 2017, so too did heavy truck orders, which have continued to climb into 2018. According to ACT Research, December 2017, which saw a 76% increase in truck order volume was the best month for orders since December 2014. In full, due to the year-end surge, 2017 saw truck orders hit 290,000 units, up 60% year over year. That strength continued into January with monthly truck orders hitting some 47,000 units, the highest level since 2006.


This data is not surprising, given that for the first three weeks of January, national average spot truckload rates were higher than during the peak season in 2017, according to DAT. January was also the fourth consecutive month in which truck orders were above the 30,000 mark. Initial heavy truck forecasts put orders near 300,000 for 2018, however tight industry capacity combined with companies that are benefitting from tax reform and looking to replace older, less fuel-efficient trucks, we could see that some lift to that forecast in the coming months.

But that’s heavy truck orders, and while four months above 30,000 paves the way for a pick-up in business, the real question to focus on is heavy truck retail sales. Heavy truck, otherwise known in the industry as class 8 trucks, industry retail sales were 218,000 units in 2017, compared to 216,000 vehicles sold in 2016, with forecasts calling for 235,000-265,000 trucks to be sold in the U.S. and Canada during 2018.

Looking outside the U.S. and Canada, the data shows an improving European economy and that should give way to a favorable truck market there as well. European truck industry sales above 16-tonnes were a robust 306,000 trucks in 2017, and It is estimated that European truck industry sales in that category will be in the range of 290,000 to 320,000 trucks in 2018.


Paccar – more than a leading heavy truck company

And that brings us to Paccar (PCAR), whose shares have fallen some 15% as the domestic stock market moved sharply lower over the last two weeks. The company is an assembler of heavy-duty trucks, with an estimated market share near 31% in the U.S. and Canada, as well as medium duty trucks (think the kind you see being driven locally by United Parcel Services (UPS) and FedEx (FDX)). That business drove 53% of its truck deliveries in 2017, with the balance coming from Europe (36%) and other markets (11%). As truck retail sales improve in the U.S., Canada and Europe, even absent additional share gains, Paccar’s truck business in terms of revenues and profits should see a nice lift.

The improving truck market also bodes well for Paccar’s high margin truck financing business – while it generated just 6.5% of total revenue in 2017 with operating margins that are more than double the truck business, it accounted for 12% of overall operating profits.

The third leg to the Paccar stool is its Parts business (20% of 2017 revenue, 28% of 2017 operating profit), which stands to benefit from the time lag between truck orders and sales in a capacity constrained industry, where up-time for existing equipment will be crucial.

Given the industry dynamics and Paccar’s position, we are seeing revenue and earnings expectations move higher in recent weeks, with the current consensus calling for EPS of $5.34 this year up from $4.26 in 2017 on a 13% revenue increase to $20.6 billion. With the company only recently sharing its 2018 tax rate will be 23%-25% vs. 31% in 2017, we could see the 2018 consensus move higher in the coming weeks.

As mentioned above, Paccar’s share price has fallen some 15% in the last two weeks, which in our view makes the shares rather compelling given our $85 price target. That target equates to just under 16x 2018 EPS. Over the prior seven years, PCAR shares have bottomed at an average P/E of 12.2x, which derives a downside target of $67.65 based on current 2018 EPS expectations. On the upside, the average peak multiple over those same years of just over 17x hints at a potential price target near $95. Looking at a dividend yield valuation, we see upside vs. downside of $82 vs. $60.

As we add the shares, we’ll split the difference with an $85 price target, and we’ll look to aggressively scale into the shares should the market come under further pressure and drag PCAR shares closer to $60. In terms of sign posts to watch for the shares in the coming days and weeks, monthly heavy truck data as well as tonnage stats and manufacturing industrial production data is what we’ll be watching. As the current earnings season winds on, we’ll be focusing on the results and outlook from Rush Enterprises (RUSHA), which owns the largest network of commercial dealerships in the U.S., with more than 100 dealerships in 21 states.


The bottom line for this alert today:

  • On Monday morning we are adding Paccar (PCAR) shares to the Tematica Investing Select List.
  • Our price target for PCAR shares is $85, nearly 26% above where the shares closed on Friday February 9.
  • At this time we are not setting a protective stop loss, but instead will look to scale further into the shares should further pressure drag them closer to $60 per share.