
Recession Proof, Bull Market and More of the Emperor’s New Clothes
This week the markets have been all about the on again/off again trade talks between the US and China and the latest updates from the Tweeter-in-Chief. The Volatility Index (VIX) is reaching a four-month high, which is seriously hurting all those who helped build up the record net short position on VIX futures during the last week of April.
The headlines are now asking, is this going to break this ever-so-fabulous bull market despite the booming economy. Bull market? Robust economy? These days I feel an awful lot like one of the few that see the emperor in fact does not have new clothes.
- The S&P 500 is up 17% this year while the New York Fed recession probability measure has risen from 21% at the end of 2018 to 27%, the highest in 12 years, and has risen every month this year. This measure typically is flagging a recession when it moves between 30% and 40%.
- First quarter earnings so far for the S&P 500 companies have fallen year-over-year and are expected to be negative next quarter as well yet Barron’s roundtable report on portfolio managers found 66% are bullish.
The NYSE Composite Index which is a much broader market metric than the S&P 500 is up all of 1% over the past year as of Wednesday’s close and has not made a new high in almost eight months while the small-cap Russell 2000 was down 1.3%. Yes, the S&P 500 was up 6.7% and the Dow Jones Industrial Average up 5.8%, but the iShares 20+ Year Treasury Bond ETF (TLT) was up 5.5% and the iShares 7-10 Year Treasury Bond ETF (IEF) was up 4.7%. When a longer-term bond ETF is outpacing the overall equity market by a material margin like that, we are not in a massive equity bull market.

When the Utility sector has outperformed the Transport sector by nearly 14% over the past year, I’m not thinking the Bulls are stomping on the Bears nor is it telling me that Mr. Market thinks the overall economy is going like gangbusters.

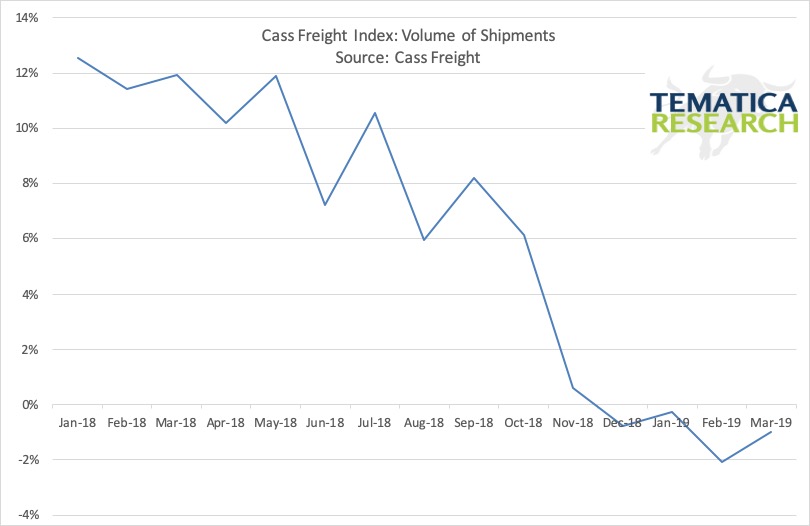
The Cass Freight Index backs up the lack of activity implied by the underperformance of Transports with the volume of shipments falling on a year-over-year basis for four consecutive months. How exactly is the economy accelerating when the volume of shipments has been declining?
Commodities support what we see in transportation.

The Institute for Supply Management (ISM) Purchasing Managers Index (PMI) isn’t all that supportive of the S&P 500’s recent moves and also indicates an economy not exactly revving up.

US ISM PMI data by YCharts
But what about last week’s jobs report that had everyone cheering? Just like the first Q1 GDP estimate, which we debunked here, the April jobs report was strong on headline data, weak in the details and lacking confirming data from other sources. The headline new jobs number came in 70k over expectations at 263k, which sounds fantastic, but as always, the details need to be investigated.
- 93k (35%) of those jobs came from the BLS birth-death model which is a total guestimate of how many jobs were created from net new businesses.
- The workweek actually contracted 0.3% in April and has now decreased or been unchanged in 3 of past 4 months. That is not telling me that employers are desperate to hire additional staff. Rising hours worked indicates that a company is in need of additional hands, but this decline in hours worked– add hours to translates into a loss of 373k jobs. If we add that number to the headline payroll number and you get a reduction of 110k in employment. Talk about lack of confirming data.
- There may have been an estimated 263k new jobs, but the total aggregate hours worked declined 0.1%! This figure has declined in 2 of the past 3 months and has remained flat since the start of the year. That means the total hours worked in the economy for everyone hasn’t changed in 4 months – that’s not growth.
- The headline unemployment rate dropped to 3.6%
from 3.8% in March, the lowest since December 1969. That’s got to be good
right?
- Don’t forget that back in 1969, a recession started the very next month, in January 1970.
- Last month’s drop in the unemployment rate came because of a 490k drop in the labor force. The total pool of available labor is today at the lowest level since May 2001! Remember that economic growth is the sum of growth in the labor pool and improvements in productivity.
We always look for confirming data points both within any particular report but also from similar reports. There is another employment report that didn’t get much attention Friday, the Household survey. This report has been around since the late 1940s and has a completely different methodology.
- This report found a drop of 103k in employment in April and has declined in 3 of the past 4 months by a total of 300k.
- Full-time employment dropped by 191k after 190k decline in March.
- Those working for economy reasons, which means they cannot get a full-time job but want one, rose 155k after a 189k increase in March.
No confirming data on that booming jobs report is coming from the Household survey.
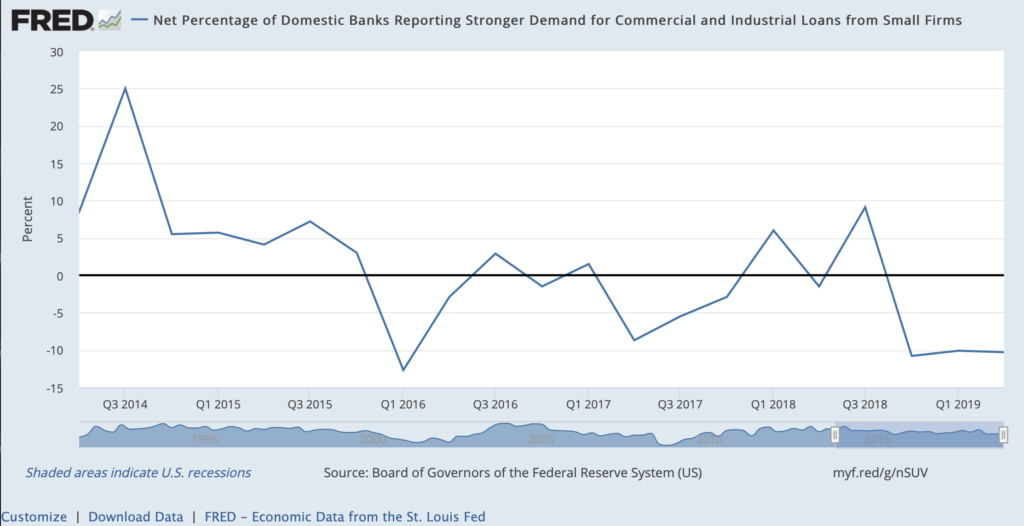
Another area of non-confirmation of the rumored US economy firing on all cylinders comes from the Federal Reserve’s Senior Loan Officer Survey. When times are good and folks feel confident in the future, they are more likely to borrow. So let’s take a look, shall we?
Mid-sized and large companies aren’t looking to borrow.
Small guys are also not in the market for a loan.
The consumer isn’t looking to buy a car.
Or borrow for anything else.
Still not convinced? Over 70 million Americans are hearing from the debt collector. With an estimated 247 million Americans aged 18 and older, that makes for roughly 28.3% of the population in financial distress – and this is when we are being told that things are bloody fantastic and the labor market is just fabulous. What happens when we do go into the inevitable recession?
Oh, wait, never mind. That isn’t going to happen, ever, at least according to this expert.
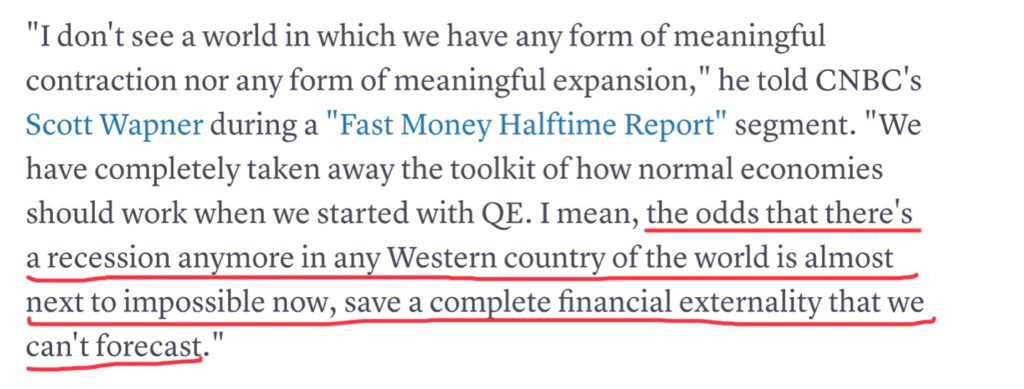
Between you and me, isn’t this the kind of thing you hear before it all goes pear-shaped?