Category Archives: Living the Life

Weekly Issue: While Most Eyes Are on the Fed, We Look at a Farfetch(ed) Idea

Weekly Issue: While Most Eyes Are on the Fed, We Look at a Farfetch(ed) Idea

Key points inside this issue

  • The Fed Takes Center Stage Once Again
  • Farfetch Limited (FTCH) – A fashionable Living the Life Thematic Leader
  • Digital Lifestyle – The August Retail Sales confirms the adoption continues


Economics & Expectations

The Fed Takes Center Stage Once Again

As we saw last week, the primary drivers of the stock market continue to be developments on the U.S.-China trade front and the next steps in monetary policy. As the European Central Bank stepped up its monetary policy loosening, it left some to wonder how much dry powder it had remaining should the global economy slow further and tip into a recession. Amid those concerns, along with some discrepancy among reports that President Trump would acquiesce to a two-step trade deal with China, stocks finished last week with a whimper after rebounding Wednesday and Thursday.

We continue to see intellectual property and national security as key tenets in negotiating a trade deal with China. We will watch as the lead up to October’s next round of trade negotiations unfolds. Given the Fed’s next two-day monetary policy meeting that begins on Tuesday and culminates with the Fed’s announcement and subsequent press conference, barring any new U.S.-China trade developments before then, it’s safe to say what the Fed says will be a key driver of the stock market this week.

Leading up to that next Fed press conference, we will get the August data for Industrial Production and Housing Starts as well as the September Empire State Manufacturing Index. Paired with Friday’s August Retail Sales report and last Thursday’s August CPI report, that will be some of the last data the Fed factors into its policy decision.

Per the CME Group’s FedWatch tool, the market sees an 82% probability for the Fed to cut interest rates by 25 basis points this week with possibly one more rate cut to be had before we exit 2019. Normally speaking, parsing the Fed’s words and Fe Chair Powell’s presser commentary are key to getting inside the central bank’s “head,” and this will be especially important this time around. One of our concerns has been the difference between the economic data and the expectations it is yielding in the stock market. Should the Fed manage to catch the market off guard, odds are it will give the market a touch of agita.

On the earnings front

there are five reports that we’ll be paying close attention to this week. They are Adobe Systems (ADBE), Chewy (CHWY), FedEx (FDX), General Mills (GIS) and Darden Restaurants (DRI). With Adobe, we’ll be examining the rate of growth tied to cloud, an aspect of our Disruptive Innovators investing theme. With Darden we’ll look to see if the performance at its full-service restaurants matches up with the consumer trade-down data being reported by the National Restaurant Association. That data has powered shares of Cleaner Living Thematic Leader and Cleaner Living Index resident Chipotle Mexican Grill (CMG) higher of late, bringing the year to date return to 82% vs. 20% for the S&P 500. Chewy is a Digital Lifestyle company that is focused on the pet market serving up food, toys, medications and other pet products. Fedex will not only offer some confirmation on the digital shopping aspect of our Digital Lifestyle investing theme it will also shed some light on the global economy as well.


Farfetch Limited – A fashionable Living the Life Thematic Leader

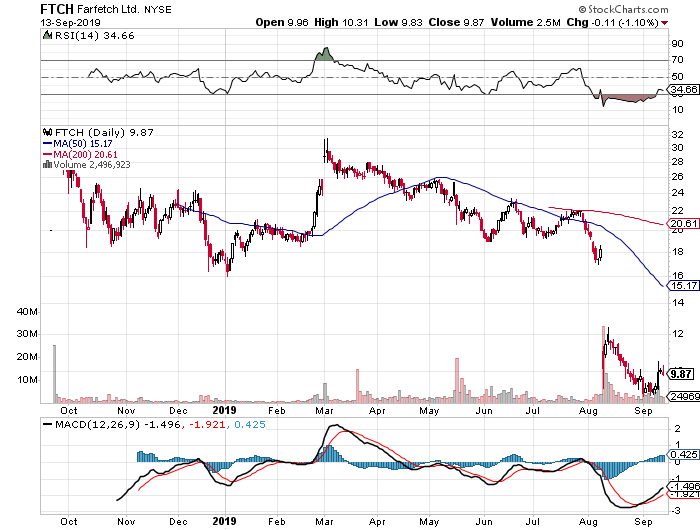
In last week’s issue, I mentioned that I was collecting my thoughts on Farfetch Limited (FTCH), a company that sits at the intersection of the luxury goods market and digital commerce. Said thematically, Farfetch is a company that reflects our Living the Life investment theme, while also benefitting from tailwinds of our Digital Lifestyle theme. Even though the company went public last year, it’s not a household name even though it operates a global luxury digital marketplace. As the shares have fallen over the last several weeks, I’ve had my eyes on them and now is the time to dip our toes in the water by adding FTCH as a Thematic Leader.


Farfetch Provides Digital Shopping to the Exploding Global Luxury Market

Farfetch is a play on the global $100 billion online luxury market with access to over 3,200 different brands across more than 1,100 brand boutique partners across its platform. With both high-end and every-day consumers continuing to shift their shopping to online and mobile platforms, we see Farfetch attacking a growing market that also has the combined benefit of appealing to the aspirational shopper and being relatively inelastic compared to mainstream apparel.

Part of what is fueling the global demand for luxury and aspirational goods is the rising disposable income of consumers in Asia, particularly China. According to Hurun’s report, The Chinese Luxury Traveler, enthusiasm for overseas travel shows no signs of abating, with the proportion of time spent on overseas tourism among luxury travelers increasing 5% to become 70% of the total. Cosmetics, (45%), local specialties (43%), luggage (39%), clothing and accessories (37%) and jewelry (34%) remain the most sought — after items among luxury travelers. High domestic import duties and concerns about fake products contribute to the popularity of shopping abroad.

It should come as little surprise then that roughly 31% of FarFetch’s 2018 revenue was derived from Asia-Pacific with the balance split between Europe, Middle East & Africa (40%) and the Americas (29%). At the end of the June 2019 quarter, the company had 1.77 million active customers, up from 1.35 million exiting 2018 and 0.9 million in 2017. As the number of active users has grown so too has Farfetch’s revenue, which hit $718 million over the 12 months ending June 2019 compared to $602 million in all of 2018 and $386 million in 2017.

Farfetch primarily monetizes its platform by serving as a commercial intermediary between sellers and end consumers and earns a commission for this service. That revenue stream also includes fees charged to sellers for other activities, such as packaging, credit-card processing, and other transaction processing activities. That business accounts for 80%-85% of Farfetch’s overall revenue with the balance derived from Platform Fulfillment Revenue and to a small extent In-Store Revenue.

New Acquisition Transformed Farfetch’s Revenue Mix 

In August, Farfetch announced the acquisition of New Guards Group, the Milan-based parent company of Off-White, Heron Preston and Palm Angels, in a deal valued at $675 million. New Guards will serve as the basis for a new business segment at Farfetch, one that it has named Brand Platform. Brand Platform will allow Farfetch to leverage New Guards’ design and product capabilities to expand the reach of its brands as well as develop new brands that span the Farfetch platform. For the 12-month period ending April 2019, the New Guards portfolio delivered revenue of $345 million, with profits before tax of $95 million. By comparison, Farfetch posted $654 million in revenue and an operating loss of $183 million over that time frame.

Clearly, another part of the thought behind acquiring New Guards and building the Brand Platform business is to improve the company’s margin and profit profile. And on the housekeeping front, the $675 million paid for New Guards will be equally split between cash and stock. Following its IPO last year, Farfetch ended the June quarter with roughly $1 billion in cash and equivalents on its balance sheet.

In many ways what we have here is a baby Amazon (AMZN) that is focused on luxury goods. Ah, the evolution of digital shopping! And while there are a number of publicly traded companies tied to digital shopping, there are few that focus solely on luxury goods.

Why Now is the Time to Add FTCH Shares

We are heading into the company’s seasonally strongest time of year, the holiday shopping season, and over the last few years, the December quarter has accounted for almost 35% of Farfetch’s annual sales. With the company’s active user base continuing to grow by leaps and bounds, that historical pattern is likely to repeat itself. Current consensus expectations have Farfetch hitting $964 million in revenue for all of 2019 and then $1.4 billion in 2020.

At the current share price, FTCH shares are trading at 1.6x expected 2020 sales on an enterprise value-to-sales basis. The consensus price target among the 10 Wall Street analysts that cover the stock is $22, which equates to an EV/2020 sales multiple of near 3.5x when adjusting for the pending New Guards acquisition. As we move through this valuation exercise, we have to factor into our thinking that Farfetch is not expected to become EBITDA positive until 2021. In our view, that warrants a bit of haircut on the multiple side and utilizing an EV/2020 sale multiple of 2.5x derives our $16 price target.

  • Despite that multiple, there is roughly 60% potential upside to that target vs. downside to the 52-week low of $8.82.
  • We are adding FTCH shares to the Thematic Leaders for our Living the Life investing theme.
  • A $16 price target is being set and we will wait to put any sort of stop-loss floor in place.


Digital Lifestyle – The August Retail Sales confirms the adoption continues

One of last week’s key economic reports was the August Retail Sales report due in part to the simple fact the consumer directly or indirectly accounts for two-thirds of the domestic economy. Moreover, with the manufacturing and industrial facing data – both economic and other third-party kinds, such as truck tonnage, railcar loadings and the like – softening in the June quarter, that quarter’s positive GDP print hinged entirely on the consumer. With domestic manufacturing and industrial data weakening further in July and August, the looming question being asked by many an investor is whether the consumer can keep the economy chugging along?

In recent months, I’ve voiced growing concerns over the spending health of the consumer as more data suggests a strengthening tailwind for our Middle-Class Squeeze investing theme. Some of that includes the Federal Reserve Bank of New York’s latest Household Debt and Credit Report, consumer household debt balances have been on the rise for five years and quarterly increases continue on a consecutive basis, bringing the second quarter 2019 total to $192 billion. Also a growing number of banks are warning over rising credit card delinquencies even as the Federal Reserve’s July Consumer Credit data showed revolving credit expanded at its fastest pace since November 2017.

Getting back to the August Retail Sale report, the headline print was a tad better than expected, however once we removed auto sales, retail sales for the month were flat. That’s on a sequential basis, but when viewed on a year over year one, retail sales excluding autos rose 3.5% year over year. That brought the year over year comparison for the three-months ending with August to up 3.4% and 1.5% stronger than the three months ending in May on the same basis.

Again, perspective can be illuminating when looking at the data, but what really shined during the month of August was digital shopping, which rose 16.0% year over year. That continued strength following the expected July surge in digital shopping due to Amazon Prime Day and all the others that looked to cash in on it led year over year digital shopping sales to rise 15.0% for the three months ending in August.

Without question, this aspect of our Digital Lifestyle investing theme continues to take consumer wallet share, primarily at the expense of brick & mortar retailers, especially department stores, which saw their August retail sales fall 5.4%. That continues the pain felt by department stores and helps explain why more than 7,000 brick & mortar locations have shuttered their doors thus far in 2019. Odds are there is more of that to come as consumers continue to shift their dollar purchase volume to online and mobile shopping as Walmart (WMT), Target (TGT) and others look to compete with Amazon Prime’s one day delivery.

  • For all the reasons discussed above, Amazon remains our Thematic King as we head into the seasonally strong holiday shopping season. 


Weekly Issue: As trade concerns escalate, investors brace for an expectations reset

Weekly Issue: As trade concerns escalate, investors brace for an expectations reset


Key points inside this issue

  • Safety & Security Thematic Leader is up big year to date, and new body camera and digital records products hitting later this year should accelerate the company’s transition. Our long-term price target on AAXN shares remains $90.
  • The April Retail Sales Report should offer confirmation for Thematic King Amazon (AMZN) as well as Middle-Class Squeeze Thematic Leader Costco Wholesale (COST). 


Given the wide swings in the market over the last few days that are tied back to the changing US-China trade talk landscape, I thought it prudent to share my latest thoughts even if it’s a day earlier than usual. 

As we discussed in the last issue of Tematica Investing, we knew that coming into last week, it was going to be a challenging one. Trade tensions kicked up to levels few were expecting 10 days ago and as the week progressed the tension and uncertainty crept even higher. We all know the stock market is no fan of uncertainty, but when paired with upsized tariffs from both the US and China that will present new economic and earnings headwinds, something that was not foreseen just a few weeks ago, investors will once again have to revisit their expectations for the economy and earnings. And yes, odds are those past and even more recent expectations will be revisited to the downside. 

What was originally thought to have been President Trump looking to squeeze some last- minute trade deal points out of the Chinese instead turned out to be more of a response to China’s attempt to do the same. This revealed the tenuous state of U.S./China trade talks. Last Friday morning, the U.S. had boosted tariffs to 25% from 10% on $200 billion worth of Chinese goods with President Trump tweeting there is “absolutely no need to rush” and that “China should not renegotiate deals with the U.S. at the last minute.” Even as the new tariffs and tweets arrived, trade negotiations continued Friday in Washington with no trade deal put in place, which dashed the hopes of some traders. Candidly, I didn’t expect a trade deal to emerge given what had transpired over the prior week. 

That hope-inspired rebound late Friday in the domestic stock market returned to renewed market pressure over the weekend and into this week as more questions over U.S.-China trade have emerged. As we started off this week, the trade angst between the U.S. and China has edged higher as China has responded to last week’s U.S. tariff bump by saying it would increase tariffs on $60 billion of U.S. goods to 25% from 10% beginning June 1st. Clearly, the latest round of tweets from President Trump won’t ease investor concern as to how the trade talks will move forward from here.

As the trade war rhetoric kicks up alongside tariffs, the next date to watch will be the G-20 economic summit in Japan next month. According to Trump economic adviser Larry Kudlow, there is a “strong possibility” Trump will meet Chinese President Xi and this morning President Trump confirmed that. 

The cherry or cherries on top of all of this is the growing worries over increasing tension with Iran, which is weighing on the market this morning, and yet another 2019 growth forecast cut by the EU that came complete with a fresh warning on Italy’s debt levels. Growth projections by the European Commission showed a mere 0.1% for GDP growth this year in Italy. The country has the second-largest debt pile in the EU and, according to the latest forecasts by the commission, the Italian debt-to-GDP ratio will hit 133% this year and rise to 135% in 2020. I point these out not to worry or spook you, but rather remind you there are other issues than just US-China trade that have to be factored into our thinking.

The natural market reaction to all of these concerns is to adopt a “risk off” attitude, which, as we’ve seen before, can ignite a storm of “fire first, ask questions later.” And as should be no surprise, that has fueled the sharp move lower in the major market indices. Over the last several days, the S&P 500, which as we know if the barometer used by most institutional and professional investors, fell 4.7% while the small-cap heavy Russell 2000 dropped 5.7%.

At times like this, it pays to do nothing. Hard to believe but as you’ve often heard few will step in to catch a falling knife and given the sharp declines, we also run the risk of a dead cat bounce in the market. We should be patient until the market finds its footing, which means parsing what comes next on the economic and earnings as well as trade front.  

I’ll continue to look for replacements for open Thematic Leader slots as well as other contenders poised to benefit from our pronounced thematic tailwinds. In the near-term, that will mean focusing on ones that also have a more U.S.-focused business model, a focus on inelastic and consumable products. Another avenue that investors are likely to revisit is dividend-paying companies, particularly those that fall into the Dividend Aristocrats category because they’ve consistently grown their dividends for the past 10 years. As I sift through the would-be contenders, I’ll be sure to look for those that intersect our investing themes and the aristocrats. 


Tematica Investing

As the stock market has come under pressure, a number of our Thematic Leaders, as well as companies on the Select List, have given back some of their year-to-date gains. One that has rallied and moved higher in spite of the market sell-off is Safety & Security Thematic Leader Axon Enterprises (AAXN) and are up some 48% year to date. That makes it the second-best performer on the Thematic Leaderboard year to date behind Clean Living company Chipotle Mexican Grill (CMG) that is up nearly 60% even after the market’s recent bout of indigestion.

Axon reported its March quarter earnings last week, which saw revenue grow 14% year over year as Axon continues to shift its business mix from Taser hardware to its Software & Sensor business that fall under the Axon Body and Axon Records businesses. During the company’s earnings conference call, the management team shared its next gen products will be available during the back half of the year. These include the Axon Body, its first camera with LTE live streaming, will launch during the September quarter and Axon Records, its first stand-alone software product. Records w will launch with a major city police department and it is already testing with a second major police department. As far as the new Axon Body product, I suspect the untethering of this camera could spur adoption much the way Apple’s (AAPL) Apple Watch saw a pronounced pick up when it added cellular connectivity to its third model. 

These new products, which leverage the intersection between our Digital Infrastructure investing theme and our Safety & Security one, should accelerate the transition to a higher margin, recurring revenue business in the coming quarters. In other words, Axon’s transformation is poised to continue and as that happens investors will be revisiting how they value the company’s business. More than likely that means further upside ahead for AAXN shares. 

  • Our price target on Safety & Security Thematic Leader Axon Enterprises (AAXN) remains $90.


Here comes the April Retail Sales Report

Later this week, we’ll get the April Retail Sales Report, which should benefit for the late Easter holiday this year. Up until the March report, this data stream was disappointing during December through February but even so from a thematic perspective the reports continued to reinforce our Digital Lifestyle and Middle-class Squeeze investing themes. 

When we look at the April data, I’ll be looking at both the sequential and year over year comparisons for Nonstore retailers, the government category for digital shopping and the category that best captures Thematic King Amazon (AMZN). I’ll also be looking at the general merchandise stores category with regard to Middle-Class Squeeze Thematic Leader Costco Wholesale (COST). Costco has already shared its April same-store sales, which rose 7.7% in the US despite having one less shopping day during the month compared to last year. Excluding the impact of gas prices and foreign exchange, Costco’s April sales were up 5.6% year over year. From my perspective, the is the latest data point that shows Costco continues to take consumer wallet share. 

With reported disposable income data inside the monthly Personal Income & Spending reports essentially flat for the last few months and Costco continuing to open new warehouse locations, which should spur its high margin membership revenue, I continue to see further upside ahead in COST shares. And yes, the same applies to Amazon shares as well.

  • Our $250 price target for Middle-class Squeeze Thematic Leader Costco Wholesale (COST) is under review.


Recession Proof, Bull Market and More of the Emperor’s New Clothes

Recession Proof, Bull Market and More of the Emperor’s New Clothes

This week the markets have been all about the on again/off again trade talks between the US and China and the latest updates from the Tweeter-in-Chief. The Volatility Index (VIX) is reaching a four-month high, which is seriously hurting all those who helped build up the record net short position on VIX futures during the last week of April.

The headlines are now asking, is this going to break this ever-so-fabulous bull market despite the booming economy. Bull market? Robust economy? These days I feel an awful lot like one of the few that see the emperor in fact does not have new clothes.

  • The S&P 500 is up 17% this year while the New York Fed recession probability measure has risen from 21% at the end of 2018 to 27%, the highest in 12 years, and has risen every month this year. This measure typically is flagging a recession when it moves between 30% and 40%.
  • First quarter earnings so far for the S&P 500 companies have fallen year-over-year and are expected to be negative next quarter as well yet Barron’s roundtable report on portfolio managers found 66% are bullish.

The NYSE Composite Index which is a much broader market metric than the S&P 500 is up all of 1% over the past year as of Wednesday’s close and has not made a new high in almost eight months while the small-cap Russell 2000 was down 1.3%. Yes, the S&P 500 was up 6.7% and the Dow Jones Industrial Average up 5.8%, but the iShares 20+ Year Treasury Bond ETF (TLT) was up 5.5% and the iShares 7-10 Year Treasury Bond ETF (IEF) was up 4.7%. When a longer-term bond ETF is outpacing the overall equity market by a material margin like that, we are not in a massive equity bull market.

^NYA Chart

^NYA data by YCharts

When the Utility sector has outperformed the Transport sector by nearly 14% over the past year, I’m not thinking the Bulls are stomping on the Bears nor is it telling me that Mr. Market thinks the overall economy is going like gangbusters.

IYT Chart

IYT data by YCharts

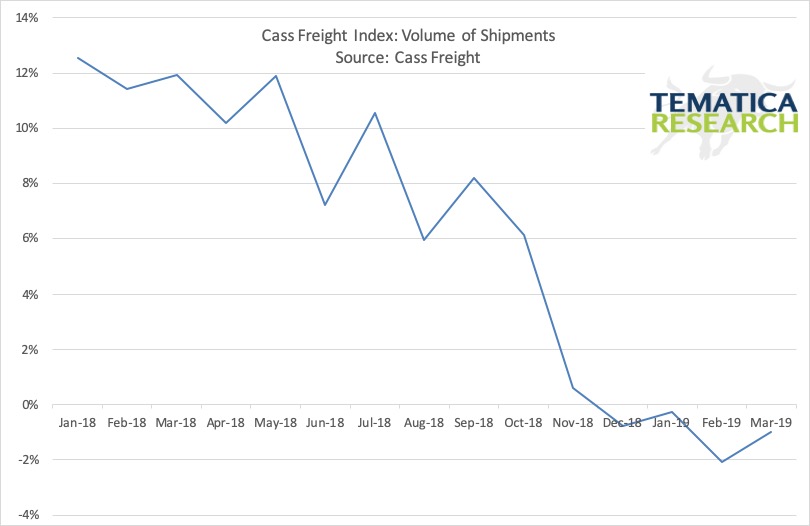
The Cass Freight Index backs up the lack of activity implied by the underperformance of Transports with the volume of shipments falling on a year-over-year basis for four consecutive months. How exactly is the economy accelerating when the volume of shipments has been declining?

Commodities support what we see in transportation.

^SG3J Chart

^SG3J data by YCharts

The Institute for Supply Management (ISM) Purchasing Managers Index (PMI) isn’t all that supportive of the S&P 500’s recent moves and also indicates an economy not exactly revving up.

US ISM PMI Chart

US ISM PMI data by YCharts

But what about last week’s jobs report that had everyone cheering? Just like the first Q1 GDP estimate, which we debunked here, the April jobs report was strong on headline data, weak in the details and lacking confirming data from other sources. The headline new jobs number came in 70k over expectations at 263k, which sounds fantastic, but as always, the details need to be investigated.

  • 93k (35%) of those jobs came from the BLS birth-death model which is a total guestimate of how many jobs were created from net new businesses.
  • The workweek actually contracted 0.3% in April and has now decreased or been unchanged in 3 of past 4 months. That is not telling me that employers are desperate to hire additional staff. Rising hours worked indicates that a company is in need of additional hands, but this decline in hours worked– add hours to translates into a loss of 373k jobs. If we add that number to the headline payroll number and you get a reduction of 110k in employment. Talk about lack of confirming data.
  • There may have been an estimated 263k new jobs, but the total aggregate hours worked declined 0.1%! This figure has declined in 2 of the past 3 months and has remained flat since the start of the year. That means the total hours worked in the economy for everyone hasn’t changed in 4 months – that’s not growth.
  • The headline unemployment rate dropped to 3.6% from 3.8% in March, the lowest since December 1969. That’s got to be good right?
    • Don’t forget that back in 1969, a recession started the very next month, in January 1970.
    • Last month’s drop in the unemployment rate came because of a 490k drop in the labor force. The total pool of available labor is today at the lowest level since May 2001! Remember that economic growth is the sum of growth in the labor pool and improvements in productivity.

We always look for confirming data points both within any particular report but also from similar reports. There is another employment report that didn’t get much attention Friday, the Household survey. This report has been around since the late 1940s and has a completely different methodology.

  • This report found a drop of 103k in employment in April and has declined in 3 of the past 4 months by a total of 300k.
  • Full-time employment dropped by 191k after 190k decline in March.
  • Those working for economy reasons, which means they cannot get a full-time job but want one, rose 155k after a 189k increase in March.

No confirming data on that booming jobs report is coming from the Household survey.

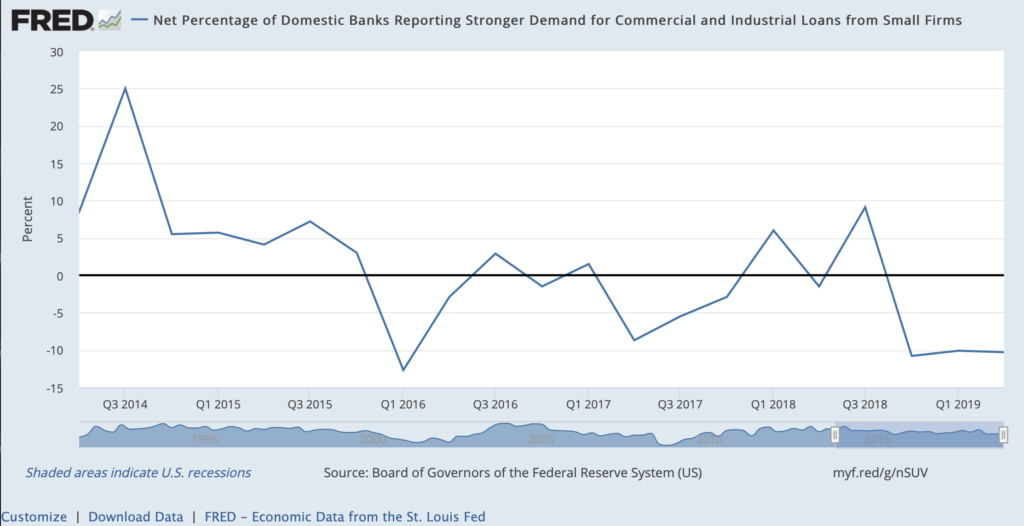
Another area of non-confirmation of the rumored US economy firing on all cylinders comes from the Federal Reserve’s Senior Loan Officer Survey. When times are good and folks feel confident in the future, they are more likely to borrow. So let’s take a look, shall we?

Mid-sized and large companies aren’t looking to borrow.

Small guys are also not in the market for a loan.

The consumer isn’t looking to buy a car.

Or borrow for anything else.

Still not convinced? Over 70 million Americans are hearing from the debt collector. With an estimated 247 million Americans aged 18 and older, that makes for roughly 28.3% of the population in financial distress – and this is when we are being told that things are bloody fantastic and the labor market is just fabulous. What happens when we do go into the inevitable recession?

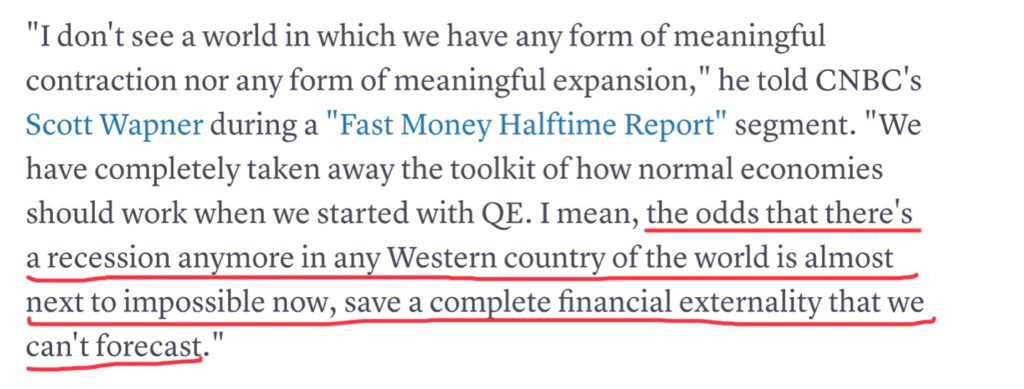
Oh, wait, never mind. That isn’t going to happen, ever, at least according to this expert.

Between you and me, isn’t this the kind of thing you hear before it all goes pear-shaped?

Weekly Issue: Trump Brings Volatility Back to the Market

Weekly Issue: Trump Brings Volatility Back to the Market


Key points inside this issue:

  • Getting the check on shares of Del Frisco’s Restaurant Group

Volatility has returned to the market, not due to the March quarter earnings season, which in aggregate is shaping up so far to be better than expected but rather to the latest development on the US-China trade front. Over the weekend President Trump said he planned to increase tariffs on $200 billion of Chinese goods to 25% from 10% this Friday even as negotiations for a U.S.-China trade deal are set to resume on Wednesday. In addition, Trump threatened to impose 25% tariffs on an additional $325 billion of Chinese goods “shortly.”


Recall that at the start of this year Trump was poised to boost tariffs to the 25% level but opted to postpone such a move as the U.S. and China began to hold trade talks. The thing that makes this latest threat rather interesting is the reports that China and U.S. were close to a trade deal, with an agreement potentially as soon as this Friday.

As I noted several months ago, odds are Trump is using some of the tactics he laid out in his book, “The Art of the Deal.” One of those tactics is “use your leverage,” and this is the one Trump is likely employing with this weekend’s talk of tariffs following last week’s IHS Markit PMI data.

That data showed the China manufacturing economy slowing in April as its PMI reading fell to 50.2 for the month, down from 50.8 in March, and its new order component also slowed month over month. Per IHS Markit, “Data indicated that subdued sales largely stemmed from weaker foreign demand, as new export business fell for the second time in the past three months.” While the IHS Markit April PMI data for the U.S. also cooled compared to March, other indicators point to the domestic economy continuing to grow at or near 2%.

In my view, the likely scenario is Trump is “using his leverage” given the state of the Chinese economy to garner incremental concessions from China as the next round of trade talks begins later this week. We will see how this develops in the coming weeks, especially as the administration appears to be hell bent on enacting this new round of tariffs on Friday. 

My strong suspicion is this is all playing out like an episode of “The Apprentice” — as we near the last key segment of the show, the drama ramps up considerably ahead of the big reveal, which is pretty much what we suspected all along. In other words, I see this latest salvo by President Trump and ramping up the drama, and odds are we will see some forward progress on the US-China trade front. 

Again, that is my suspicion and we don’t invest on suspicions, but rather on the addressing the evolving landscape. As such, I’ll look to position the Thematic Leaders and the Tematica Select List as needed come a trade resolution or another round of tariffs, that could spark a retaliatory move by China. Either way, more to come!


The Eurozone gets another growth haircut

As if the latest act in the US-China trade war and recent economic data isn’t enough for you, yesterday the European Commission cut its growth forecast the EU in general and for Germany in particular and warned on the ballooning debt level for Italy.  The EU now sees the 19-nation single currency bloc growing 1.2% this year, which is down from the already tepid level of 1.3% it called for in February. 

The EU also warned that Italy’s public debt would balloon to a record of almost 134% of GDP in 2019 and grow even further in 2020 to 135% of GDP, well over commitments made to Brussels and more than double the EU’s 60% limit. Clearly,  we haven’t heard the last of this, and let’s not forget  with negotiations for the EU’s divorce with the UK stalled and no agreement in sight we run the risk of a no-go Brexit deal. 

The moral of the investing story this week is that risks to the market’s vapid increase year to date in 2019 remain even though the March quarter earnings season is, so far, coming in ahead of expectations. 

While former Intel CEO Andy Grove made “only the paranoid survives” famous, I still prefer this quote from Warren Buffett at times likes this – “Look at market fluctuations as your friend rather than your enemy; profit from folly rather than participate in it.”


Tematica Investing

The renewed concern over trade has weighed on the market in general and on shares of not only the Thematic Leaders but also those that reside on the Tematica Select List. As I discussed above, it’s too soon to tell if this is a real threat or something designed to prod the Chinese at the negotiating table. As usual, the herd is shooting first and asking questions later, which has rarely served long-term investors well. As we look at the majority of the Thematic Leaders and companies that have earned their place on the Select List, the thematic tailwinds continue to favor them. 

Should the trade landscape change in a meaningful way – read that as Trump goes forward with the threatened tariff increase and/or China retaliates – then we will likely see expectations for economic growth and earnings be meaningfully reset. The likely knee jerk reaction will be for investors to flee multinational companies in favor of those whose businesses have greater exposure to domestic economy. Should this scenario come to pass, I’ll be focusing our thematic lens on domestic opportunities, but let’s wait a few days and see what happens. As always, the devil is in the details. 


Getting the check on Del Frisco’s shares

Above I said the vast majority of Thematic Leaders are performing well thus far in 2019. One that has been under pressure of last has been Guilty Pleasure thematic leader Del Frisco’s Restaurant Group (DFRG). We’ve been patient with the company, which since December has been conducting a strategic review. However, following the company’s March quarter results that beat on the top line, but missed on EPS, we are exiting the name. 

While the company saw comparable restaurant sales increase 1.3% during the quarter compared to year-ago levels, margins felt the impact of new location openings, which is slated to continue as DFRG expands its restaurant footprint in the coming quarters. Then there is the issue of the company’s strategic review. Per the earnings press release,

“… we are limited in what we can disclose or comment, but the Board is continuing to work with Piper Jaffray and Kirkland & Ellis in a diligent manner. No assurances can be made with regard to the timeline for completion of the strategic review, or whether the review will result in any particular outcome.”

Remember, this review began in December, and it’s been hinted that part of what’s been dragging the process out is multiple buyers for different pieces of Del Frisco’s. Our growing concern is that even if a partial or full M&A transaction arrives, given the margin prospects for the coming quarters any takeout premium could be modest at best.

Turning to Del Frisco’s balance sheet, the company had $4.6 million in cash at the end of the March quarter, down from $8.5 million at the end of 2018. Even after accounting for non-recurring items during the quarter, Del Frisco’s still delivered a net loss of $3.4 million for the quarter. And with new location openings expected to weigh on margins near-term, odds are the company will continue to bleed cash.

And that brings us back full circle to something that may be delaying a potential M&A transaction. A smart buyer will look to squeeze the company it wishes to buy in order to get the best possible acquisition price, which benefits not only the buying company’s shareholders but also the integration and cost savings process.

Clearly this holding is not working out exactly as planned, and it has been rather frustrating. As new details inside of Del Frisco’s have become available, my growing concern is that either no M&A deal will emerge, and if it does, we run the risk of takeout offers being near current share price levels.

In my view, either of the above scenarios would be read as a disappointment given that inside the current DFRG share price there is likely some implied takeout valuation factor. Currently DFRG shares are trading at more than 12x enterprise value to 2019 EBITDA expectations vs. 11.2x for competitor Ruth’s Hospitality (RUTH).

To sum it up, I see the risks associated with holding DFRG shares mounting, with any resolution not likely to recoup the losses to date that we’ve endured. Better to get out now and minimize additional losses is my thinking.

  • We are issuing a Sell on shares of Del Frisco’s Restaurant Group (DFRG) and removing them from the Thematic Leaders. 

Weekly Issue: Despite a better than expected March quarter GDP print, April signs point to a slowing global economy ahead

Weekly Issue: Despite a better than expected March quarter GDP print, April signs point to a slowing global economy ahead

Key points inside this issue:

  • Earnings season notables from Amazon, Disney, Alphabet/Google and Nokia
  • We are sitting out this week with a new option recommendation, waiting for the market to find its footing rather than get stopped out due to either an earnings season swing one way or the other. 


Last Friday we received the better than expected initial March GDP quarter print of 3.2%, which was well ahead of the expected range of 2.3%-2.5% depending on the source. Digging into that report, we found that inventory build was a key factor in the upside surprise. In our weekly Roundup comments, we shared that such builds tend to be temporary factor for the economy, and we’ll be watching to see the speed at which that inventory build is utilized in what the data shows to be a slowing global economy. To gauge that speed of inventory digestion, it means examining some of the key economic data, and this being the start of the month, there is no shortage of that to be had. 

Yesterday morning we received the IHS Markit Caixin China General Manufacturing PMI reading for April and at 50.2, it was down meaningfully from 50.8 in March. Technically still in expansion territory, but barely so. Inside the report, new export orders returned to contractionary territory, suggesting cooling overseas demand, and while “stocks of purchased items returned to contractionary territory, the measure for stocks of finished goods fell more markedly. 

Granted this is somewhat better than the data from a few months ago that showed China’s manufacturing economy contracting full on, but the April data does not suggest a meaningful upturn is imminent. 

Over the next few days, we’ll get the April IHS Markit PMI data for Japan, eurozone and the US, but yesterday’s National Association of Business Economics’ (NABE’s) April survey of economists showed 53% of respondents now see the economy growing by more than 2% this year. That’s down from 67% in January. When we factor in the initial GDP print of 3.2% for the March quarter, it suggests a more pronounced slowdown in the coming quarters than was thought at the start of 2019. That likely means business’s ability to chew through that March quarter inventory build will not be brisk and will serve as an economic headwind in the current quarter. 

Like always, I’ll be watching the economic tea leaves in the coming days and weeks as we look to zero in on the true speed of the domestic and larger global economy. This includes keeping tabs on what appears to be the never-ending US-China trade conversation. Yesterday morning, it was reported that Treasury Secretary Steven Mnuchin suggested the U.S. and China are closing in on a trade deal. Our position remains the same as it has been for some time – hopeful, but we acknowledge the details of any agreement will be what matters most, not headlines touting victory.

Tematica Investing

As we all know, we are smack dab in the middle of the March quarter earnings season, and there have been some high-profile beats, but also some high-profile misses complete with revised outlooks to the downside. Stepping back, the market is coming to grips with the data we’ve received over the last few months and its impact on company business models. In some cases, as we saw with results from Clean Living Thematic Leader Chipotle Mexican Grill, or those from Procter & Gamble Co. (PG) and The Hershey Co. (HSY), specific corporate strategies are paying off. Meanwhile, results from 3M (MMM), Tesla (TSLA), The Sherwin-Williams Co. (SHW), GATX (GATX), The Gorman-Rupp Co. (GRC), and others, remind us that pockets of the global economy have slowed considerably. 

I expect this dichotomy to continue into next week as the March-quarter earnings season continues. As we and the market digest these reports, the coming of additional economic data, and any progress on trade talks, we’ll be able to triangulate on the next likely move for the market as we move further into the second trading month of the quarter.

Now let’s review some of the recent results for stocks on the Thematic Leaderboard and the Select List:

Amazon (AMZN)     Thematic King

Shares of Amazon climbed following the company’s March-quarter results last week that simply crushed expectations. The likely follow through on those results was offset by Amazon once again providing in-line guidance which is likely to prove to be conservative. From an operations perspective, sales and profit growth were posted by the company’s two largest business segments — North America and AWS — while continued revenue growth at International and cost containment dramatically shrank that segment’s operating profit drag during the quarter. And while Amazon’s advertising business shrank quarter over quarter as the holiday shopping season subsided, year over year the company grew that business by 34%, putting to rest chatter concerning its level of growth. 

Perhaps the most noteworthy item exiting the company’s earnings call was the announcement that free Prime two-day shipping would become free one-day shipping. In my view, this changes the table stakes for retail, and will no doubt lead to share gains for Amazon ahead of the upcoming Prime Day, but also as we move through the remainder of the year. Our price target on Amazon shares remains $2,250.

Walt Disney (DIS)    Digital Lifestyle

Disney shares continued their march higher this week, adding to impressive gains in recent weeks that were sparked by the formal unveiling of its Disney+ streaming service. Fueling the move higher were several items, including the growing euphoria surrounding “Avengers: Endgame,” its latest tent pole franchise film that as expected pierced the $1 billion level at the box office in record time. Also last week, Comcast (CMCSA) shared it will sell its ownership stake in Hulu to Disney, which I expect will shore up its forthcoming Disney+ offering. 

As I have shared previously, as Disney+ gains traction, I expect Wall Street will re-think how it values DIS shares. Disney will report its quarterly results on May 8 and no doubt remind investors of its vibrant film slate for the balance of 2019. With both of those factors in mind, I am boosting our price target on DIS shares to $140 from $125.

Alphabet/Google (GOOGL)       Disruptive Innovators

Earlier this week, Alphabet/Google reported mixed March quarter results with a beat on the bottom line, but quarterly revenue that fell shy of Wall Street consensus forecasts. Heading into the report, our GOOGL shares were up more than 22% year to date, even as recent reports from Facebook, Inc. (FB), Amazon and Twitter  (TWTR) showed them gaining in digital advertising. Google bears have been pointing to growing traction from Amazon.com, Inc. (AMZN) in the digital advertising space, which continues to attract advertising spend from radio, TV and print. All of this set a very high bar for Google in terms of expectations, as it has been putting up 20% revenue growth in a string of recent quarters.

By the numbers, Google delivered EPS $11.90 per share vs. the expected consensus of $10.61 expected on revenue of $36.34 billion, vs. $37.33 billion expected. Digging into that 17% revenue increase year over year, Google’s core advertising revenue rose 15.3% year over year, down sharply from the 20%-24.4% range during 2018. 

To some extent, this is the law of large numbers at play, and if we take a longer view, we see Google’s advertising revenue rose some 43% in the March 2019 quarter compared to the March 2017 quarter. Digging deeper into the figures, we find that YouTube, in particular, had difficult year-over-year comparisons following advertising changes implemented in early 2018.

So, what’s the issue?

According to forecasts from the likes of eMarketer, digital advertising spend is expected to grow 19%-20% this year compared to 2018.

It would appear that Google is off to a slow start in 2019, especially compared to the 26% year-over-year gain in advertising revenue put up by Facebook during its March quarter. Again, some perspective — Facebook’s March quarter advertising revenue was $14.9 billion, which is impressive, but is far behind the $30.7 billion captured by Google during the same quarter.

Despite its size, there are opportunities for Google to grab incremental digital advertising spend share in the coming quarters. Two such examples include new shoppable ad units in Google Images, which would allow brands companies to highlight multiple products available for sale in sponsored image results. The other ties to the company’s comping streaming gaming service introduced at its Game Developers Conference, allowing developers to reengage players with relevant ads across Google’s properties. And then there is Google’s position in mobile search and advertising as mobile utility continues to increase across the globe.

In short, Google’s core advertising business has several drivers of growth remaining. That said, I will monitor these and other efforts to grow the advertising business to ensure these plans are capturing revenue as expected. As one might expect, some across Wall Street trimmed their price targets, while the bears take the expected victory lap. I’ll continue to focus on the next 12-18 months, not the next few weeks. Our price target on GOOGL shares remains $1,300.

Nokia Corp. (NOK) Disruptive Innovators

Last Thursday morning, we received the March Durable Orders and Shipments report, which showed a 2.7% sequential increase in total orders and a 0.3% increase for shipments on the same basis. That’s a favorable order figure and suggests better-than-expected strength in the economy. However, with this report in particular, we need to ferret out the drivers between core capital goods, defense and aircraft. In doing so, we find core capital goods, the data series that ties best with the industrial and manufacturing economy, saw orders rise 6.6% month over month, while core capital goods shipments advanced 0.2%.

Digging a bit deeper into the March Durable Orders and Shipments report, we find considerable order strength in Communications Equipment (+9.0% month over month), Transportation (+7.0%) and Nondefense Aircraft & Parts (+31.2%), with more modest gains for Machinery, Motor Vehicles & Parts, and Electrical Equipment, Appliances and Components. Order declines were seen from Primary Metals, Fabricated Metal Products and Computers & Related Products.

Donning my investing hat, we see the surge in Communications Equipment adding confidence to the expected increase in 5G activity that should bolster its business in the coming quarters. Last week, Nokia delivered the telegraphed weak March quarter it signaled in January. If we were in the later stages of 5G network deployments, we would be far more concerned with these misses relative to Wall Street expectations. However, as both Verizon Communications Inc. (VZ) and AT&T Inc. (T) both shared this week, we are still in the very early earnings for 5G both here in the U.S. and abroad. Verizon even shared that it plans to announce more 5G-capable devices in the coming months. And this speaks to one of the key differentiators for Nokia — namely, Nokia Technologies, its IP licensing arm that delivers operating margins near 82%. That’s more than head and shoulders above historical margins for the Networks business during peak periods of demand. For the March quarter, nearly all of Nokia’s operating profit was generated by Nokia Technologies, which is on a run rate to deliver €1.4 billion (roughly $900 million).

The growing momentum in the 5G market is what allowed Nokia to keep its 2019 earnings forecast intact as the combination of revenue growth and improving margin profile falls to the bottom line. As Nokia noted in its earnings release, “5G revenues are expected to grow sharply, particularly in the second half of the year, driven by our 36 commercial wins to date.” As more device companies look to tap the 5G market opportunity, Nokia Technologies is positioned for further upside in the coming quarters. Should that come to pass, which in our view is more likely than not, it translates into either greater comfort with Nokia’s 2019 earnings-per-share targets or potential upside in the second half of 2019 and beyond.

Our position has been that 5G is a market opportunity that will gain momentum in the coming quarters and likely hit the U.S. commercial tipping point in 2020 with China/Japan to follow and then Europe. With hindsight being 20/20, we were likely early on adding Nokia to the Thematic Leaderboard, however, as the 5G inflection point approaches the shares will remain on the board. Subscribers who are underweight NOK shares should consider using post-March quarter earnings weakness in the shares to add to their holdings. Our long-term price target for NOK shares remains $8.50.

Q1 GDP . . . Don’t Break Out the Champagne Quite Yet

Q1 GDP . . . Don’t Break Out the Champagne Quite Yet

This morning we received the first estimate for Q1 2019 GDP, and it looked at first glance to be considerably better than was expected with the economy expanding at a 3.2% annual pace versus consensus expectations for 2.3% and growth of 2.2% in Q4 2018. Just don’t break out the champagne quite yet as right away we see reasons to dig deeper.

Net exports plus a build-up in inventories contributed 1.68% to GDP. That’s the biggest bump in 6 years and muddies the economic waters. We’ve now had three consecutive quarters of buildup in nonfarm inventories, likely in defense against further tariff increases. That buildup is a pull forward of growth from the future. The 103-basis point contribution from net exports in the face of ongoing cuts to global growth makes this unlikely to continue. The 46% annualized increase in food exports looks to be more about trade wars than sustainable improvements in trade. Despite the government shutdown, government spending, (primarily at the state and local level) contributed 41 basis points, driven primarily by 35 basis points at the state and local level in “Gross investment.” Given the condition of most government budgets, this isn’t sustainable.

Digging further into the details we find areas of weakness that are more in line with the weaker expectations:

  • Final sales to private domestic purchases fell to the weakest level since Q1 2016.
  • Disposable personal income was the weakest in 6 quarters.
  • Real consumer spending slowed to 1.2% on an annual basis, the weakest rate in a year with spending on those big ticket “durable goods” items falling -5.3%, the worst pace since the end of 2009.
  • Gross domestic purchases were the weakest in 3 years.

On the plus side, durable goods orders grew at the fastest pace in 7 months with a sign that business investment is rebounding. Perhaps on the hope that those China trade talks might actually get somewhere beyond hopeful sound bites that something wonderful is right around the corner? The bigger picture year-over-year factory orders data is less rosy, painting a picture of more slowing. Keep in mind that orders can be cancelled. Shipments for capital goods on a year-over-year basis is solid, but has been consistently slowing.

For a different view on the economy, we can look at how 3M (MMM) and Intel (INTC) have fared, both of whom are bellwether cyclicals. Both companies have seen their shares get pummeled recently thanks to their less-than-rosy outlook. Take a look at United Parcel Service (UPS) whose profits are down 17%. What can be more reflective of the economy than deliveries?

So far Q1 earnings are at a -3% year-over-year decline and Q2 forecasts are expected a -0.5% decline. At the start of the year, expectations were for both to be in positive territory. At the same time, the major market indices have managed to break through to new highs with the Nasdaq up 22% and enjoying its best year since 1991 and the S&P 500 up around 17% and enjoying the best performance since 1987. Then again, look at how 1987 ended. The market’s rally so far this year has been all about multiple expansion, rising from 16.5x to 18.7x on a trailing basis.

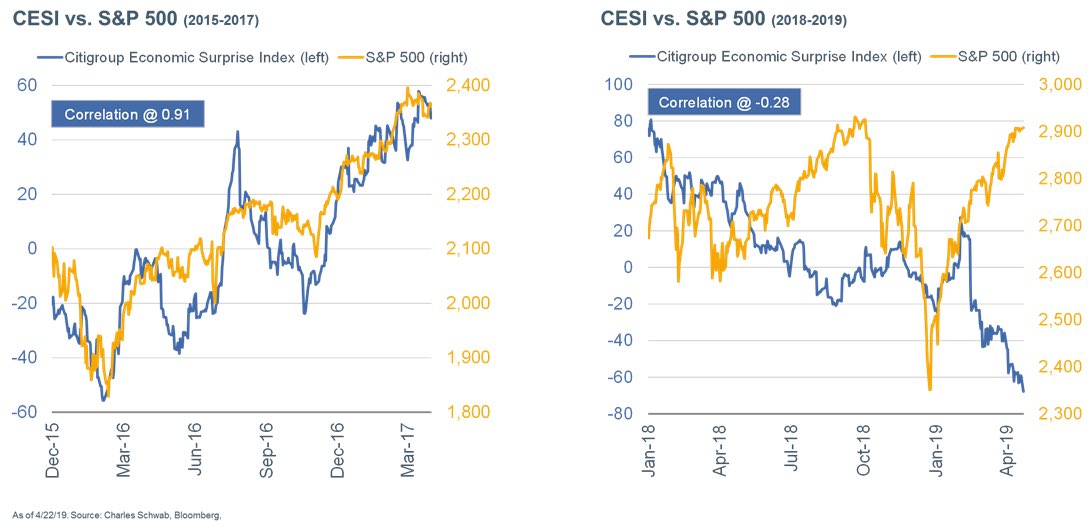
As the Federal Reserve once again indicates that it has the market’s back, the S&P 500 has decided that the economic data just isn’t all that relevant.

Yes, jobless claims are still exceptionally low by historical standards, but we always look for confirming data points and we aren’t finding them.

  • The Household Survey found that employment has contracted by 197k since the start of the years.
  • The nonfarm payroll report showed slowing of hiring at temporary employment agencies. This figure tends to be a leading indicator as companies often first fill a roll with a temp before committing to a full-time position.
  • The JOLTS (Job Openings Labor Turnover Survey) report for February was overall the weakest since 2013.
  • The latest Manpower report saw hiring intentions declined for the second quarter of 2019.
  • The Challenger, Gray and Christmas report found that announced job cuts are up 35.6% year-over-year for the first quarter and the worst first quarter since 2009.
  • Finally, while initial jobless claims do remain very low, this year they have risen above where they were the same time last year, possibly indicating a shift in momentum.

For a different look on how the consumer is faring, household formation declined in the first quarter – the kids are back to living at home with mom and dad. Mortgage originations at Wells Fargo (WFM), the nation’s fourth largest bank by assets, declined 23% year-over-year in the first quarter and 18% and JP Morgan (JPM), the nation’s largest bank by assets. In fact, revenues at Wells fell across all business lines with profits only coming as a result of cost reductions. Today’s GDP report saw residential construction decline -2.8% on an annual rate, the fifth consecutive quarterly decline.

Let’s keep this simple and just look at growth in the major parts of the private sector on an annual basis – consumer spending, housing, nonresidential construction, business capital spending:

  • Q2 2018 4.0%
  • Q3 2018 3.0%
  • Q3 2018 2.3%
  • Q1 2019 0.9%

Tell me again how the economy is growing like gangbusters?

This Week’s Issue: Hear those engines? It’s earnings season!

This Week’s Issue: Hear those engines? It’s earnings season!

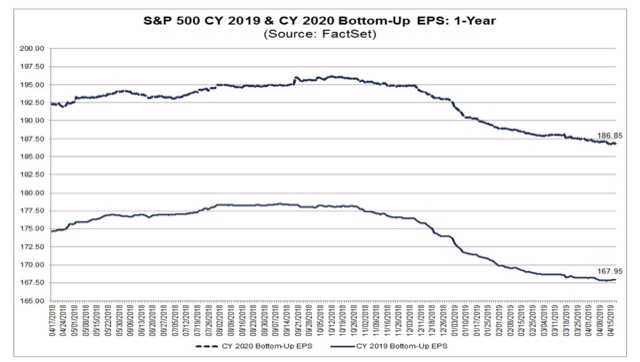
Coming into this week 15% of the S&P 500 companies have reported and exiting it that percentage will jump to 45%. What the market and investors will be focusing on this week is what led to upside or downside surprises for the reported quarter and how is the current quarter shaping up relative to expectations. Remember, that during the March quarter we saw downward revisions in S&P 500 EPS expectations for the quarter such that the consensus called for EPS declines year over year. Currently, expectations for the current June quarter are up 10% sequentially but are flat year over year. 


If we get the data to show these March reports and prospects for the current quarter are better than expected or feared, we could see the 2019 view for S&P 500 earnings move higher vs. the meager 3.7% growth forecast to $167.95. If that happens, it will mark a change in view for 2019 expectations, which have been eroding over the last several months, and could drive the market higher. However, if we see a pickup in downward EPS cuts, we could see those 2019 S&P 500 consensus expectations come under pressure, which would make the stock market even more expensive following its year to date run of 16%. 

Now to sift through the onslaught of more than 680 companies reporting this week, which based on what we’re seeing this morning from Coca-Cola (KO), Lockheed Martin (LMT), Twitter (TWTR) and Pulte Group (PHM) suggest potential upside to be had. Tucked inside those results were positive data points for several of our investing themes:

Coca-Cola is feeling the tailwind of our Cleaner Living investing theme as sales of its flavored waters and sports drinks rose 6% year over year, significantly faster than the 1% growth posted by its carbonated drinks business. During the earnings conference call, CEO James Quincy shared that the management team is looking to make Coca-Cola a “total beverage company” by adding coffees, teas, smoothies and flavored waters to a portfolio that has traditionally offered aerated drinks.

Lockheed Martin Corp reported better-than-expected quarterly profit yesterday, benefitting from the Safety & Securitytailwind associated with President Donald Trump’s looser policies on foreign arms sales boosted demand for missiles and fighter jets.

Efforts to improve its advertising business model helped Twitter capture some of our Digital Lifestyletailwind as year over year monetizable daily user growth returned to double digits for the first time in several quarters. 

Verizon (VZ) beat quarterly expectations and on its earnings conference call 5G and its deployment in the coming quarters was a key topic during the question and answer session. Verizon will continue to build out its network and bring more 5G capable smartphones to market, which in my view continues to bode well for our Digital Infrastructureand Disruptive Innovators Thematic Leaders, Dycom (DY) and Nokia (NOK). Nokia will report its quarterly results later this week, and following Ericsson’s better than expected results that tied to strength in North America and 5G, Nokia could surprise on the upside as well.


Splitting the Housing and Retail Sales hairs

Late last week we received some conflicting economic data in the form of the March Retail Sales report and the March Housing Starts data. While retail sales for the month came in stronger than expected — a welcome sign following the last few months in which that data disappointed relative to expectations — March housing starts fell to their weakest point since 2017 despite a tick down in mortgage rates. Now let’s take a deeper dive into those two reports:

In looking at the March Retail Sales report, total retail rose 1.7% month over month (3.5% year over year) with broad-based sales strength and nice gains seen across discretionary spending categories. While we are quite pleased with the month’s data, subscribers know we tend to favor a longer-term perspective when it comes to identifying data trends. Consequently, as we are bracing for the March quarter earnings onslaught it makes sense to examine how retail sales in this year’s March quarter compared to the year-ago quarter. Here we go:

Leaders for the March 2019 quarter vs. March 2018 quarter:

  • Nonstore retailers up more than 11%, which bodes very well for Thematic King Amazon  (AMZN) and to a lesser extent our Alphabet (GOOGL). Let’s remember that those packages need to get to their intended destinations, which likely means positive things for United Parcel Service (UPS), and I’ll be checking that report, which is out later this week. 
  • Food services & drinking places rose 4.4%, which points to favorable data for Guilty Pleasure Thematic Leader Del Frisco’s Restaurant Group (DFRG). And yes, I continue to wait on more about its strategic review process. 
  • Health & personal care stores were up 4.6%.
  • Building material & garden suppliers and dealers increased by 4.7%.

Laggards for the March 2019 quarter vs. March 2018 quarter:

  • Sporting goods, hobby, musical instrument, & book stores were down 7.9 
  • Department Stores fell 3.8%, which comes as no surprise to me given the accelerating shift to digital shopping that is part of our Digital Lifestyle investing theme. 
  • Miscellaneous store retailers were down 3.8%

Turning to the March Housing Starts report, the aggregate starts data fell to the weakest level since 2017, but that decline includes both single-family and multifamily housing starts. Breaking down those two components, single-family starts were down 0.4% to 781,000, the slowest pace since September 2016, while permits decreased 1.1% to 808,000, the lowest since August 2017. Multifamily starts, which include apartments and condominiums, were unchanged month over month at 354,000, while those permits fell 2.7%. 

The March results may have been influenced to some degree by harsh weather in the Northeast, which contended with heavy snowfalls, and in the South as it dealt with record flooding along the Mississippi and Missouri rivers. Even so, the housing data were off despite a decline in the 30-year mortgage rate to roughly 4.15% this month from 4.86% last October, according to data from Marcrotrends. This decline likely signals that consumers are being priced out of the market as developers and home builders continue to struggle with building affordable properties amid rising labor and materials costs. We also must consider the state of the consumer, who is dealing with the impact of higher debt levels across credit cards, auto loans and student loans — a combination that is sapping disposable income and the ability to service mortgages on homes they may not be able to afford.

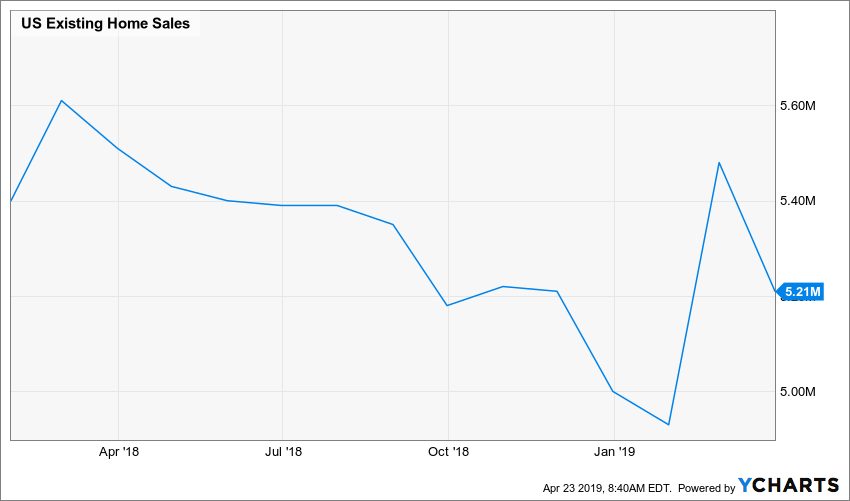
Generally speaking, most existing homeowners in the U.S. use the capital from selling their current homes to help fund the purchase of their next dwellings. This means we as investors should watch Existing Home Sales data as a precursor to new home sales and housing starts. Despite February’s better-than-expected sequential print, Existing Home Sales have been falling on a year-over-year basis since February 2018.

Per March Existing Home Sales report, which showed a 5.4% sequential drop vs. February and a similar decline vs. a year ago. For the March quarter, existing home sales fell 5.3%, which in our opinion does not augur well for a near-term pick up in the overall housing market, especially as the recent decline in mortgage rates has not jump started new mortgage applications.

Generally speaking, the housing market has two seasonally strong periods during the year, the spring and fall selling seasons, of which spring tends to be the stronger one. This year, it could be argued that harsh weather in various parts of the U.S. has resulted in the spring selling season getting off to a slow start. Leading up to it, we have seen a climb in the inventory of new homes listed for sale, according to Realtor.com. That’s the supply side of the equation, but the side we remain concerned about is demand.

As we get more data in the coming weeks, we’ll be better able to suss out if we are dealing with a weather related situation, a consumer affordability one or some combination of the two. If the data points to a consumer affordability one, we may consider Home Depot (HD), which is a company that cuts across our Middle Class Squeeze and Affordable Luxury investing themes. Through last night, however, HD shares are up some 28% year to date, and are sitting in over bought territory. Should we see a sizable pullback over the coming weeks as more earnings reports are had and digested, this could be one to revisit. 

Weekly Issue: A number of Thematic Leaders delivered outsized returns during Q1

Weekly Issue: A number of Thematic Leaders delivered outsized returns during Q1


Key points inside this issue

  • Despite a slowing global economy, the March quarter was a barn burner for stocks, but risks remain heading into the March quarter earnings season.
  • Our price target on Apple (AAPL) remains $225. 
  • Our price target on shares of Living the Life Thematic Leader Del Frisco’s Restaurant Group (DFRG) remains $14.
  • Our price target on Universal Display (OLED) shares of $150 is under review. 


Last week brought the March quarter to a close, and even though Friday’s personal income and spending data confirmed a slowing economy, it was the best quarter in nearly a decade for stocks. 

The bulk of the double-digit gains across all of the major domestic stock market indices — the Dow Jones Industrial Average, S&P 500, Nasdaq Composite Index, and the Russell 2000 — came early in the quarter due to positive expectations for U.S.-China trade talks, even as the market shrugged off the federal government shutdown. As the quarter wore on, data pointed to a slowing global economy, with more pronounced weakness in China, Japan and Europe, leaving the U.S. the best house on the slowing economic block. Even so, the domestic data point to a markedly slower U.S. economy compared to the second half of 2018, which in part reflects the anniversary of tax reform, but also consumers that increasingly appear to be hitting a spending wall.

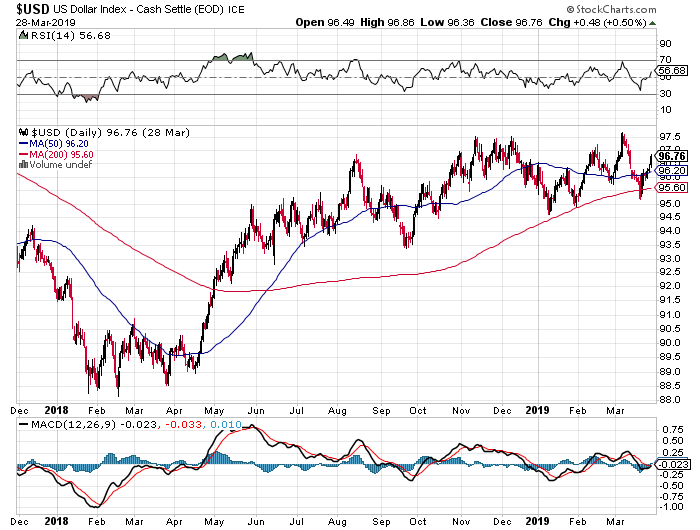
Companies are also contending with higher wage costs, due in part to minimum wage hikes, as well as certain higher input costs. And of course, there is the current trade war with China that is also presenting a headwind, as is the slowing economies in Europe and Japan, especially given the year-over-year strength in the dollar, as you can see in the chart below.

In sum, we’ve seen a number of these headwinds result in reduced earnings expectations for the current quarter, and we’re now beginning to see companies once again trim back expectations. Last Thursday night DowDuPont Inc. (DWDP) slashed its sales and profits forecasts, joining the ranks of Infineon Technologies AG (IFX), Samsung Electronics Co., Ltd., Osram and others. This week, it was Walgreens Boots Alliance (WBA) that shared it had “the most difficult quarter we have had since the formation of Walgreens Boots Alliance.

On Monday we received a slew of economic data that included the March Manufacturing PMI data for China, Japan, the eurozone and the U.S. as well as the March ISM Manufacturing Index and February Retail Sales figures. There were bright spots inside this sea of data, most notably the March ISM Manufacturing Index that surprised modestly to the upside and showed a pickup in orders and employment.

That positive report was tempered by the IHS Markit Manufacturing PMI for the U.S., which showed a month-over-month decline in March and hit its lowest level since mid- 2017. As that report noted, “New order growth has fallen close to the lows seen in the 2016 slowdown, often linked to disappointing exports, tariffs and signs of increasing caution among customers.” This trend points to continued slow growth ahead for the domestic economy, though the latest data as a whole still leave the U.S. as the fastest-growing economy compared to China, Japan and the eurozone.

As for the February Retail Sales Report, it once again missed expectations, declining 0.2% month over month. This marks the third flat to down sequential comparison for this data set in the last four months. Viewing the data on a year-over-year basis, retail sales for the month rose 2.1%, which confirms a slower but still growing U.S. economy. While we don’t want to put too sunny of a view on it, the February year- over-year comparison was ahead of the 2.0% growth pace of the trailing three months. Still, there was no question the year-over-year rate of spending in February slowed compared to January.

While we don’t want to put too sunny of a view on it, the February year- over-year comparison was ahead of the 2.0% growth pace of the trailing three months. Still, there was no question the year-over-year rate of spending in February slowed compared to January.

In my view, this looks to be setting up a volatile earnings season, with earnings guidance that is likely to disappoint and lead to downward revisions for the June quarter as companies reset expectations. We will continue to be prudent, longer-term focused investors that take our cues from our 10 investing themes and the confirming signals to be had.


Tematica Investing

As we put the March quarter in the rear-view mirror, the market will continue to look for hope in a U.S.-China trade deal but given the factors outlined above, I see greater risk to the downside, generally speaking, than upside, as we begin the March-quarter earnings season. The stalwart among them was Clean Living Leader Chipotle Mexican Grill (CMG), as its shares rose more than 60% during the first three months of the year. Digital Lifestyle Leader Netflix (NFLX) as well as New Global Middle Class Leader, Alibaba (BABA), soared more than 30% during the quarter, and Thematic King Amazon (AMZN) climbed 20%. 

The quarter wasn’t without its challenges given declines experienced at Aging of the Population Leader AMN Healthcare (AMN), but as I am seeing with my 87 year old father, the need for elder care is pronounced and bodes well for nursing demand in the coming years. We will continue to hold AMN shares. Another laggard is Dycom Industries (DY), better known as the Digital Infrastructure Leader, which is positioned to benefit from the 5G and gigabit network buildout. We’re entering the seasonally strong time of the year for Dycom, which also brings us closer to initial 5G launches from AT&T (T), Verizon (VZ), T-Mobile USA (TMUS) and others. As with AMN shares, we will continue to hold DY shares as well. 

Now let’s dig into several Thematic Leaders and Select List positions that made news over the last week. 


Apple’s video and gaming efforts are interesting but not in the short-term

During the March quarter, Apple’s (AAPL) shares rebounded hard, rising just over 20%. Some of that climb was due to the excitement ahead of Apple’s services focused event last week, which candidly was largely as expected given prior news leaks. Leading up to the event we saw iPad, Mac and AirPod refreshes, but the event itself focused on Apple Card, Apple News+ and AppleTV+. The one surprise was the announcement of a streaming gaming service, which like AppleTV+ will debut later this year. 

As such while they are positives for the Services business, they will have little impact on the company’s bottom line near-term. That said, Canaccord Genuity upped its price target to $230 from $185 this week. The reality of the situation is that as much as we like content and Apple is looking to use it to make its devices and ecosystem even stickier with customers inside the Digital Lifestyle, in the near-term the primary driver of the company’s profits will continue to be the iPhone. 

  • Our price target on Apple (AAPL) remains $225. A key point to that target is the eventual upgrade cycle tied to 5G and the iPhone, which given our Dycom comments above, increasingly looks like it will happen in the second half of 2020.


Frustrated with Del Frisco’s Restaurant Group, but holding steady

If you’re growing frustrated with this Thematic Leader, you are not alone. During the March quarter, DFRG shares fell roughly 10%, but the inter quarter swing was far greater than that. What’s weighing on the shares is lack of news on the company’s strategic review process. Per some reports, the company could be cleaved into two parts to different buyers, which if true would explain the pronounced timetable.

From a fundamental perspective, while overall restaurant traffic and other metrics fell in February according to data published by TDN2K, the bulk of that decline was at fast casual restaurants, to which we have no exposure. Digging into the data, we find  fine dining was the best-performing industry segment during February for same-store sales growth. While I like such confirming data, as I noted above the DFRG share price will continue to be driven by any and all strategic review developments. This will continue to be our point of focus for now.

 Our plan is to hold DFRG as the takeout story evolves further, but as we have said previously, odds are we will use a deal- related pop in the stock to exit the position. 

  • Our price target on shares of Living the Life Thematic Leader Del Frisco’s Restaurant Group (DFRG) remains $14.


Universal Display should continue to shine

Universal Display (OLED) shares shined bright during the first quarter rising easily more than 50%. Yesterday, there were thesis confirming reports for the adoption of organic light emitting diode display that will drive demand for Universal’s chemical and IP licensing businesses. Those reports centered on Apple (AAPL) shifting its entire production of iPhones to organic light-emitting diode displays in 2020.

These same reports also suggest Apple will have three different- size iPhones, measuring 5.42 inches, 6.06 inches and 6.67 inches. While the varied iPhone sizing is new, we heard similar hints about the switch in display technology several months ago. We see this as follow up to that, which in our view increases the likelihood of this happening.

We’d also note the timing of these models and the display transition seem to coincide with the potential debut of a 5G iPhone. In light of the incremental RF chips the 5G model will contain, it makes sense that Apple would look to adopt this display technology for both space as well as power savings.

While we like seeing our investment thesis confirmed here, I’d note that not only have OLED shares climbed substantially over the last three months, but the transition to all organic light-emitting diode displays at Apple, and most likely others, is several quarters out. We will continue to be long- term investors in OLED shares. However, given market conditions and the upcoming earning season we could see OLED shares give some of its gains back in the near-term. We’ll continue to focus on the long-term opportunity not only in the smartphone market but in automotive and eventually the general illumination market. 

  • Our price target on Universal Display (OLED) shares of $150 is under review. 
Weekly issue: Downside Protection Critical Amid These Uncertain Conditions

Weekly issue: Downside Protection Critical Amid These Uncertain Conditions

Key points inside this issue

  • Ahead of the Fed’s latest dot blot, 2019 GDP expectations move lower.
  • With uncertainties again on the rise, we reiterate our Buy rating on the ProShares Short S&P 500 ETF (SH) ahead of the upcoming March quarter earnings season.


Weakening GDP Expectations for the Remainder of 2019

Looking back over the last few weekly issues, it would be fair to say they were a little wordy. What can I say, between the economic data and earnings season, plus thematic data points, there was a lot to share over the last few weeks. Today, however, I’m going to cut to the point with my comments, largely because all investor eyes and ears are waiting to see and hear what Fed Chair Jerome Powell has to say about the speed of the US economy as they look for signs over what is coming next out of the Fed.

We’ve talked quite a bit about the slowing speed of the global economy, and even though there have been some individual bright spots across the aggregated hard and soft economic data from both government and third-party sources, the slowing speed is hard to ignore. Based on the published data, domestic GDP hit 3.1% last year, and as we’ve shared recently we’ve started to see the expectations for 2019 move lower in recent weeks. Per the March CNBC Fed Survey of 43 economists and Fed watcher findings, GDP for 2019 is now expected to clock in around 2.3% — not quite cut in half compared to 2018, but dramatically lower and significantly lower than folks were looking for in the back half of 2018.

When the Fed issues its post FOMC meeting statement today, the focus will more than likely not be on the interest rate decision – almost no one expects a hike. Instead, rapt attention will be paid to the Fed’s updated economic dot plot, which will reveal how it sees the US economy shaping up. Let’s remember that one unofficial aspect of the Fed’s job is to be a cheerleader for the economy, so it becomes a question of “if they are cutting their GDP forecast” how deep of a cut could we really see?

Culprits of the slowing economy and these cuts include aspects of our Middle-Class Squeeze investing theme as consumers in the US grapple with debt levels that have risen precipitously over the last several years. The consumer spending tailwind associated with our Living the Life investing theme appears to be slowing some given the rising debt levels of Chinese consumers. Governments have also run up debt in recent years as the current business cycle has grown longer in the tooth. And of course, there is the impact of currency as well as political and trade uncertainties, including the pushout of US-China trade talks to June.


Downside Protection is Key Under These Circumstances

In a little over 10 days, we will be exiting March, entering the second quarter and beginning the earnings season dance all over again. My concern is that given the above and the several unknowns therein, we are poised to see another earnings season during which aggregate expectations will be adjusted lower. Case in point, with the  US-China trade agreement timetable slipping and slipping, it becomes rather difficult for a company to factor any resolution into its guidance, especially when the terms of the agreement are unknown.

Despite all of the above, the domestic stock market has continued to chug higher, once again approaching overbought levels, even though 2019 EPS cuts for the S&P 500 have made the market even more expensive than it was as we exited 2018.

The potential poster child for this is FedEx (FDX), which saw its shares take a fall last night after the company cut its annual profit forecast for the second time in three months due to slowing global growth, rising costs from a 2016 acquisition in Europe and questions over its ability to withstand U.S.-China trade tensions and uncertainty over the U.K.’s exit from the European Union.

Not to go all Groundhog Day on you, but this looks increasingly like the situation we saw in December when I added the ProShares Short S&P 500 ETF (SH) to the Select List. If we didn’t have those shares to offer some downside protection for what lies ahead, I would be adding them today. If you don’t have any of those shares in your holdings, my advice would be to add some. Much like insurance, you may not know exactly when you’ll need it, but you’ll be happy to have it when something goes bad.

  • With uncertainties again on the rise, we reiterate our Buy rating on the ProShares Short S&P 500 ETF (SH) ahead of the upcoming March quarter earnings season.


Weekly Issue: Talking Thematics, Boeing and Retail Sales

Weekly Issue: Talking Thematics, Boeing and Retail Sales

Key points inside this issue

  • We are issuing a Buy on and adding shares of Energous Corp. (WATT) to the Select List as part of our Disruptive Innovators investing theme with an $11 price target.
  • We will continue to patiently hold Thematic Leader Del Frisco’s Restaurant Group (DFRG) shares as the Board continues to review potential strategic alternatives.


I’m just back from some meeting in New York, and it was a busy trip that included visits with Yahoo Finance and Cheddar to discuss the January retail sales report and the gyrations in the Dow Jones Industrial Average given the issues and concerns that have erupted with Boeing (BA) following another 737 MAX aircraft crash over the weekend. You can watch my appearance on Yahoo Finance here and the one with Cheddar here, but quickly on those two items, while the January retail sales report was better than expected, the headline figure for December was revised lower from the first negative print we received.

Also, we’ve started to get February same-store comp sales and from a growing number of retailers, those figures have been negative. And you’ve probably noticed that we are once again seeing a sea of store closures being announced by retailers. If you haven’t, I walked through some of these on last week’s Cocktail Investing podcast, which you can listen to here. As I pointed out on my appearances on Yahoo Finance and Cheddar, we are seeing a bifurcation in the retail land. Those that are riding the tailwinds associated with our Living the Life and Middle-Class Squeeze investing themes are thriving, while those caught in between – Macy’s (M), Gap (GPS), L Brands (LB) and others – are struggling once again. We here at Tematica have talked about rising consumer debt and delinquency levels, and I continue to see those increasingly cash-strapped consumers turning to off-price retailers and warehouse clubs, like Middle-Class Squeeze leader Costco Wholesale (COST) in the coming months.

With regard to Boeing, while it isn’t a Thematic Leader or on the Select List, the demand for its aircraft is being powered by international air travel, particularly out of Asia, which fits very well with our New Global Middle-Class investing theme. The issue plaguing the company and its shares is two 737 MAX planes have crashed in a relatively short time, and this has led several countries to ground those planes as issues behind the most recent crash are sought. This has raised several questions for Boeing as the 737 family is an important one, accounting for 80% of its aircraft backlog entering 2019 and 58% of its January order book. How long will those planes be grounded? What does it mean for future 737 family orders and production levels that drive revenue, profits, and earnings?

In the past Boeing has quickly dealt with situations such as these, and it has already announced an extensive change to the flight-control system in the 737 MAX aircraft. I’ll continue to watch these developments and gauge the impact to be had on2019 expectations. Odds are they will be coming in from where they were just a few weeks ago. In the past, these situations, while dreadful, have offered a favorable entry point to BA shares provided the timing is right. Right now, it seems to be a tad too early, but with upside to $450, it’s one to watch closely.

On a side note, the Boeing issue highlights a key difference in how the major market indices are constructed. BA shares account for just under 10% of Dow Jones Industrial Average, which means the recent stock pressure has weighed on that index heavily. This explains the wide difference this week between how the Dow has performed vs. the S&P 500, which only has 0.9% exposure to Boeing shares. That’s a huge difference, and it points to understanding the ins and outs of the indices for not only the market but for any passive ETFs that one may own. In the case of Boeing, there are a number of ETFs that hold the shares, but one of the ones with sizable exposure is the ETFMG Drone Economy Strategy ETF (IFLY). That ETF, which looks to invest in drones, holds 4.96% of its assets in BA shares, even though its revenues from drones and other autonomous systems are so small they aren’t even broken out by the company in SEC filings.


Tematica Investing


Powering up the Select List with WATT shares

In our increasingly connected society, two of the big annoyances we must deal with are keeping our devices charged and all the cords we need to charge them. When I upgraded my iPhone to one of the newer models, I was pleasantly surprised by the ease of charging it wirelessly by laying it on a charging disc. Pretty easy.

I’m hardly alone in appreciating this convenience, and we’ve heard that companies ranging from Tesla Inc. (TSLA) to Apple Inc. (AAPL) are looking to bring charging pads to market. That means a potential sea change in how we charge our devices is in the offing, which means a potential growth market for a company that has the necessary chipsets to power one or more of those pads. In other words, if there were no such chipsets, we would not be able to charge wirelessly.

Off to digging, I went to see if there is a pure-play company that fits this Disruptive Innovator investment theme charge (and yes, that was a very poor pun on my part.) What I turned up was Energous Corp. (WATT) and its WattUp solution. WattUp consists of proprietary semiconductor chipsets, software and antennas that enable radio frequency (RF)-based, wire-free charging of electronic devices. Like the charging disc I have, and the ones depicted by Apple, WattUp is both a contact-based charging and at-a-distance charging solution, which means all we need do is lay our wireless devices down be it on a disc, pad or other contraption to charge them. In November 2016, Energous entered into a Strategic Alliance Agreement with Dialog Semiconductor (DLGNF), under which Dialog manufactures and distributes IC products incorporating its wire-free charging technology.

Dialog happens to be the exclusive supplier of these Energous products for the general market and Dialog is also a well-known power management supplier to Apple across several products, including the iPhone. Indeed, last week Dialog bucked the headline trend of late and shared that it isn’t seeing a demand hit from Apple after fellow suppliers Lumentum Holdings Inc. (LITE) and Qorvo Inc. (QRCO) cut guidance earlier this week.

On its September quarter earnings call, Dialog shared it was awarded a broad range of new contracts, including charging across multiple next-generation products assets, with revenue expected to be realized starting in 2019 and accelerating into 2020. I already can feel several mental carts getting ahead of the horse as some think, “Ah, Energous might be the technology that will power Apple’s wireless charging solution!”

Adding fuel to that fire, on its September quarter earnings conference call Energous shared that “given the most recent advances in our core technology” its relationship with its key strategic partner – Dialog – “has now progressed beyond development, exploration and testing to actual product engineering.”

Since then, there have been several additional developments:

  • In late December, Energous announced its first commercial product to receive FCC approval, the WattUp-enabled personal sound amplification products (PSAPs) from Delight. Energous’ WattUp wireless technology allows the Delight PSAP to charge on a charging pad. The products are now certified to be marketed and sold in the United States.
  • At CES in January, Energous launched Wireless Charging 2.0 and demonstrated with Deutsche Telekom (DTEGY) a transmitter design that can charge multiple electronic devices at a distance.
  • We are hearing renewed chatter that Apple’s (AAPL) delayed wireless charging solution, known as the Airpower charging mat, is likely to hit shelves in the coming months. As I pointed out, Apple has long used Dialog Semiconductor (DLGNF) for its power solutions and Dialog is the exclusive supplier for Energous products. In early January, Apple supplier Luxshare Precision initiated AirPower production and that would seem to confirm rumored timetables that AirPower would begin shipping during the first half of 2019.
  • In the company’s December quarter earnings release, Energous shared that on the back of a favorable showing at the CES 2019 and Mobile World Congress 2019, “no less than 10 companies currently tracking for product launches to the consumer in 2019 with chip sales starting in the first half of the year and ramping in the second half.”

Taken together these recent developments point to robust revenue growth for Energous (WATT) compared to the $1.1 million-$1.4 million range between what was reported in 2017 and what’s expected for 2018. Current consensus estimates have the company delivering revenue of $94 million in 2020, which reflects a full year of shipping product. Two points of caution on that forecast: First, it comes from a combination of two Wall Street analysts, which is not a wide enough number that inspires 100% confidence; Second, Energous is on the cusp of going from essentially a start-up company to a real one, and odds are there will be fits and starts, delays and pushouts along the way. This will require us to be patient with the shares, but it also means continuously evaluating the competitive landscape.

As that revenue ramp and bottom-line improvement come to fruition, valuation metrics are likely to move higher for WATT shares. There is also potential upside following the eventual teardown analysis of Apple’s Airpower charging mat, which could very well bring the Apple halo to WATT.

So why now with WATT shares?

Alongside the company’s December quarter earnings report, it also completed a $25 million common stock offering of 3.3 million shares priced “in the hole” at $7.70. I say “in the hole” because prior to that offering the shares were trading well above $9. For some, that was clearly a disappointment, especially given the $20.1 million the company had in cash on its balance sheet exiting 2018. Odds are the company entered into this transaction in order to have sufficient capital as it heads into the oncoming production ramp to meet demand from these “no less than 10 customers.” Not a great transaction, but also not a horrible thing given that it likely heads off an even more painful one later on. For us, it’s given us the opportunity to get into WATT shares at a far better price point.

Our 12-18-month price target on WATT shares is $11, which equates to an enterprise value to 2020 revenue multiple of 4.0x vs. the current 2.4x multiple. If you’re thinking the combination of revenue growth and that valuation framework could make Energous a takeout candidate, I would have to agree.

  • We are issuing a Buy on and adding shares of Energous Corp. (WATT) to the Select List as part of our Disruptive Innovators investing theme with an $11 price target.


Del Frisco’s delivers, but no word on the strategic alternatives

Yesterday, Living the Life Thematic Leader Del Frisco’s (DFRG) reported its December quarter results, which were modestly ahead of expectations. On the company’s earnings call it reviewed the usual metrics and shared a long-term favorable outlook, which candidly was expected. What the company did not say, however, was anything about the strategic initiatives it is reviewing. Recall that several months ago, the company added a new Board member with investment banking experience to spearhead this activity. Given the level of steak house M&A that has happened in recent years, due in part to the more defensive nature of higher-end dining vs. casual restaurants, they’ve been a sought-after asset.

With Just One More Restaurant, the company that licenses the Palm Steakhouse name, filing for Chapter 11 late last week due to fiduciary misconduct, there is one less prospect to be had. Much like a game of musical chairs, as the number of seats or in this case steak house businesses drop, they become more valuable. We will continue to patiently hold DFRG shares as the Board continues to review the alternatives. Should a transaction fail to emerge, I am inclined to revisit the company’s position on the Thematic Leader board.

  • For now, we will continue to patiently hold Thematic Leader Del Frisco’s Restaurant Group (DFRG) shares as the Board continues to review potential strategic alternatives.