
Seeing Through the Smoke of the Trade War
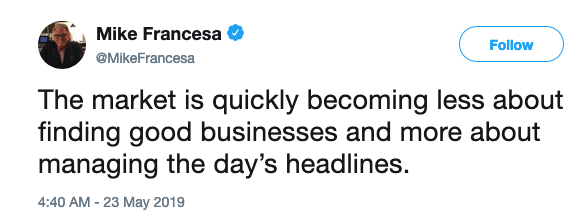
I’d like to open this week’s piece with a bit of Twitter wisdom – as much as an oxymoron as that sounds.
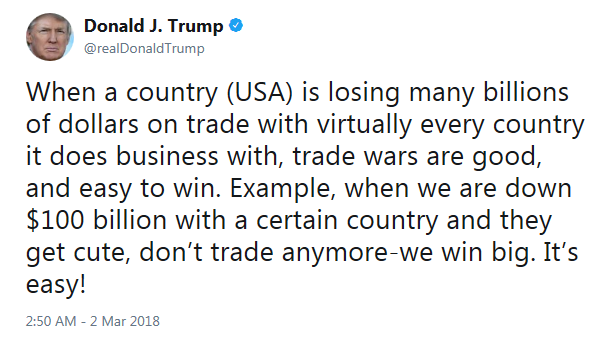
The impact of Federal Reserve Chairman Powell’s sweet whispers to the market that the 2018 rate hikes are on hold for 2019 is wearing off as politics and trade tensions dominate the markets. I’m going to go out on a limb here and suggest that prescriptions for Xanax and the like have been on the rise inside the beltway in recent weeks. Those headlines investors are trying to navigate around are dominated by talk of the trade war with China, which has evolved from last year’s Presidential tweet.
Fourteen months later, the May 23rd, 2019 comment from Ministry of Commerce spokesperson Gao Feng in Mandarin, (according to a CNBC translation) casts a different tone.
“If the U.S. would like to keep on negotiating it should, with sincerity, adjust its wrong actions. Only then can talks continue.”
So that’s going well. China appears to very much be digging in its heels and preparing for a prolonged battle. We are hearing talk of a ‘cold war’ on the tech sector and the New York Times wrote, “Mnuchin Presses Companies For Trade War Contingency Plans.”
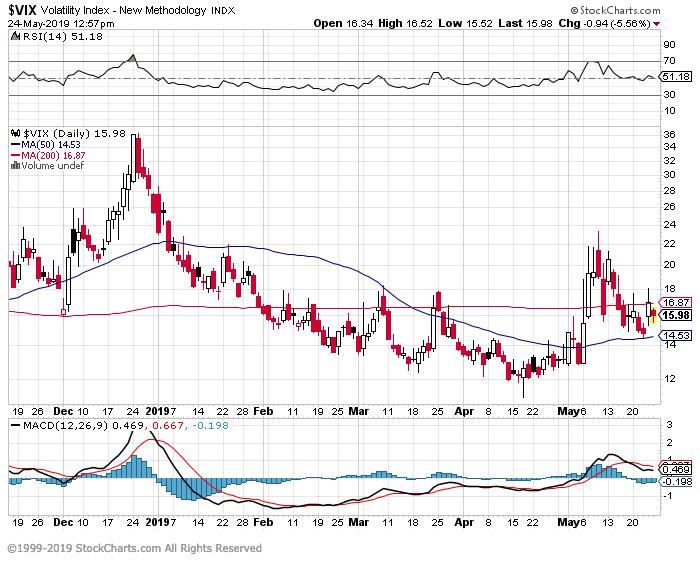
With all that, it is no wonder that the CBOE S&P 500 Volatility Index (VIX) has moved above both its 50-day and 200-day moving average.
May has not been kind to the major US indices.

Many market bellwethers that had previously been investor darlings are in or shortly will be in correction territory.

But the US economy is strong right? As we’ve mentioned in prior pieces here and here, not so much. This week the Financial Times reported that non-performing loans at the 10 largest commercial US banks rose 20% in the first quarter. That was in a quarter in which GDP came in above 3% and above expectations. What happens in a weak quarter? Those banks aren’t being helped by falling interest rates either, which crush their margins. The yield on the 10-year Treasury note has fallen below the mid-point on the Fed’s target range for the overnight funds rate. A flat-to-inverted yield curve just screams economic party-on.
As we look at growth in the second quarter, remember that the first quarter build-up in inventories was a function of the trade war. Businesses were stocking up before tariffs and in response to all the uncertainty. This buildup was a pull forward in demand for stockpiling which serves as a headwind to growth in later quarters.
We are also seeing reports of trade war related supply chain disruptions, which means declining productivity. Remember that the growth of an economy is a function of the growth of the labor pool (all but tapped out) and growth in productivity. The Atlanta Fed’s GDPNow estimate reflects this with second quarter growth down to 1.3% from 1.6% on May 14th. Following the week’s slump in April core-capital goods orders the New York Fed’s Nowcast reading for the current quarter fell to 1.4% from 1.8% last week.
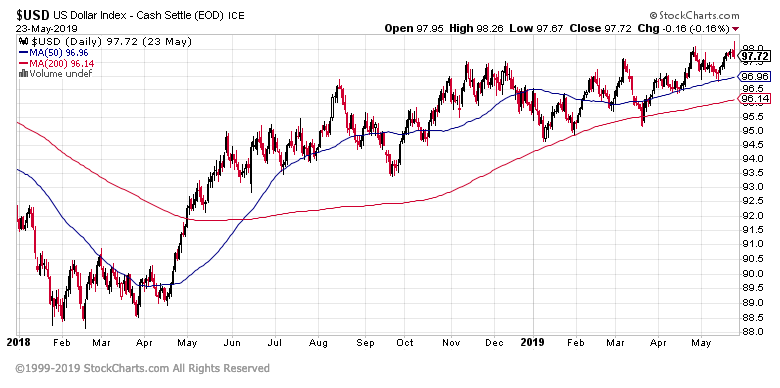
While the headlines are dominated by the trade wars or the latest drama in DC, what most aren’t watching is the most important factor in the global economy today – the rising dollar.
The US Dollar Index (ICE:DX) has been in a steady uptrend for over a year.
The broader Federal Reserve Trade Weighted US Dollar Index has broken above is December 2016 high and may be on its way to new all-time highs – if it breaks above 129.85, we are in unchartered territory.
Why does the dollar matter so much? About 80% of global trade relies on the US Dollar. Last year the Fed’s rate hikes drove up the price (AKA interest rate) of the dollar for other countries. As the US looks to reduce its trade deficit with many of its trading partners, that means less dollars available outside of the US. When the US imports, goods and services come into the country and dollars leave. A shrinking trade deficit creates a double whammy on the dollar of rising interest rate effects (higher price) and a reduction in supply.
The rising dollar obviously hurts the sales of US companies internationally, (think on this in light of that 20% rise in non-performing loans at US banks) but it is also major headwind to emerging markets, particularly given the massive amount of US dollar denominated debt in emerging economies. As quantitative easing pushed the dollar down, emerging economies gorged on US dollar denominated debt. That seemingly free lunch is now getting expensive, and if the dollar breaks into unchartered territory, that free lunch could turn into spewed chunks.
In addition to the problems with existing dollar denominated debt, the rising dollar increases the scarcity of capital in emerging markets. As the dollar increases relative to another nation’s currency, domestic asset values decline which means banks are less willing to lend. Investment declines and there goes the growth in emerging economies.
With respect to China and the dollar, as the US imposes tariffs on China, the roughly 8% decline in the renminbi versus the US Dollar has helped to offset the impact. This week the renmimbi dropped to nearly a six-month low, falling briefly below 7. To put that move in context, from the mid-1990s to July 2005, China had pegged its currency to 8.28 to the dollar. It only dropped below 7 in 2008 before the nation halted all movement as the financial crisis rolled across the globe. Trading resumed in 2010 officially within a managed band of a basket of currencies, but in practice primarily against the dollar. The big question now is will China let the renminbi stay below the 7 mark.
As global trade slows amidst trade wars, rising populism and dollar scarcity, exports in April in Asia showed the strain.
- Indonesia -13.1%
- Singapore NODX -10%
- Taiwan -3.3%
- China -2.7%
- Thailand -2.6%
- Japan -2.4%
- South Korea -2%
- Vietnam 7.5% (woot woot)
Looking at South Korea, semiconductors account for 1/5th of the nation’s exports and we’ve seen global semiconductor sales decline the fastest since 2009. With the ubiquitous nature of these chips, this says a lot above overall global growth. And that’s before the growing ban placed on China telecom company Huawei, which reportedly consumes $20 billion of semiconductors each year, is factored into the equation.

Worldwide Semiconductor Sales data by YCharts
It isn’t just the emerging economies that are struggling with a rising dollar. The Brexit embattled UK, (who just lost its current Prime Minister Theresa May) has seen its currency weaken significantly against the dollar, losing around 25% over the past 5 years – effectively a 25% tax on US imports from currency alone.

Pound Sterling to US Dollar Exchange Rate data by YCharts
The euro hasn’t fared well either. While above the 2017 lows, it has lost nearly 20% versus the dollar in the past 5 years – effectively a 20% tax on US imports from currency alone.

Euro to US Dollar Exchange Rate data by YCharts
If all that isn’t enough to get your attention, then just wait until later this summer when we have another debt ceiling drama to which we can look forward. With how well the left and right are getting along these days on Capitol Hill, I’m sure this will be smooth sailing. With volatility still relatively low (but rising) perhaps putting on a little bit of protection on one’s portfolio would be in order?
And on that note, have a great holiday weekend!