Surprises From Market Breadth with Record Margin Debt
As we discussed earlier, heading into the third quarter earnings season, we have above average level of positive guidance in terms of both top line sales and earnings as well as lower-than-average negative earnings guidance. We pointed out yesterday, however, that an uncomfortable portion of that guidance is driven by gains from a weak dollar and we are seeing signs that may be reversing course.
In the last quarter, companies that delivered on or beat expectations didn’t get much of a reward for their efforts. We looked at the current market conditions to get a feel for what the earnings reactions could be this reporting season.
Margin Debt
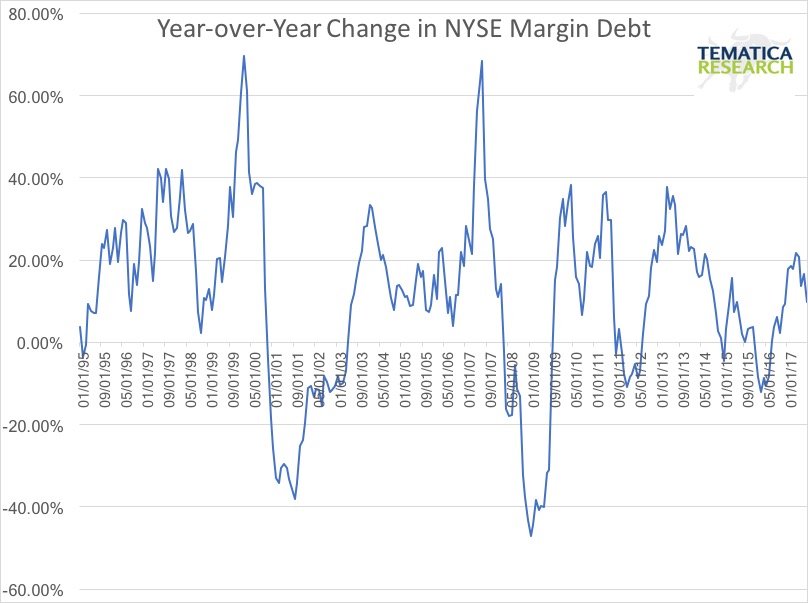
Margin debt has reached $550.9 billion, a record high for the second consecutive month and the sixth record high in the past eight months. Anyone who recalls just a tad bit of market history can see that rapidly rising margin debt has preceded the beginnings of both the March 2000 and July 2007 bear markets. However, nearly one in four monthly margin debt readings since 1959 have been record highs, so to assume that a pullback is imminent based on a record high is folly at best. Instead, we like to look at the rate of change over a 12-month period. Here we can see that the rate of change recently hasn’t been nearly as dramatic as the wild moves we saw around the 2000 and 2007 crashes. This metric does not indicate a market that has been wildly laying on the leverage, despite reaching yet another record high.
Market Breadth
Another measure of the health of the market is the Advance/Decline line which has been well above its 50-day and 200-day moving average. This indicator is showing a market that appears rather robust, but the value of this indicator may lessened by the rapidly rising use of ETFs. When an investor puts money into an ETF, those funds are used to buy all the companies in the ETF indiscriminately, which can give the appearance of greater robustness than would otherwise exist.
To further assess breadth, we look at the ratio of equal weight versus market cap weighted for the major market indices. What we found is the S&P 500 and the Russell 2000 equal weight indices underperformed their market cap weighted indices by a material amount year-to-date. This metric indicates that the indices upward moves have been driving by larger cap high-flyers, which indicates weaker breadth than we’d like to see.
High Fliers Losing Some Altitude
Amazon (AMZN) tried to carve out a head and shoulders pattern this week, down by over 2% during the week, but closed the week back in the black by Friday. If it moves below the neckline where it is currently perched rather precariously, the shorts will go for the jugular and this is one of those mega cap stock that has been helping to keep the indices up. Another high flier that has driven a good portion of the market’s gains, Apple (APPL), has dropped below both its 50-day and 100-day moving averages and is now down in 13 of the last 18 days as the new product line doesn’t exactly have consumers busting down the doors.
Facebook (FB) is also feeling the pain with all the bad press surrounding is ad platform that Ivan and his Russian buddies have been abusing to stir up domestic strife here in the U.S. Who knew Putin’s team may not play fair! The stock suffered its worst day this week since last November, falling over 5% at one point during the week and closing below its 50-day moving average for the first time since July 6th. By week’s end the shares had moved back to neutral territory in this Teflon market, but the warning flares have been fired. Netflix (NFLX) joined in falling as much as 5.5% this week to waver right arounds its 50-day moving average.
With the performance of the equal weight indices below that of the market cap weighted, weakness in the big guys are cause for concern. The end of the week saw a rebound in most, such as Alphabet (GOOGL) but we’ll be watching to see if the rebound holds.
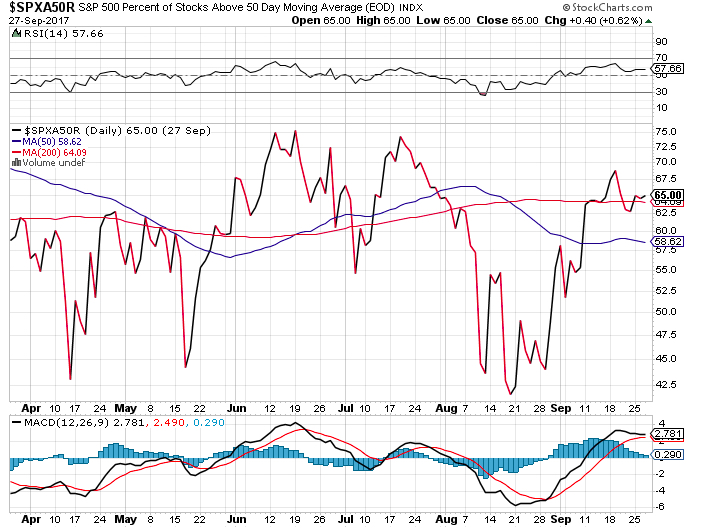
Another Breadth Indicator
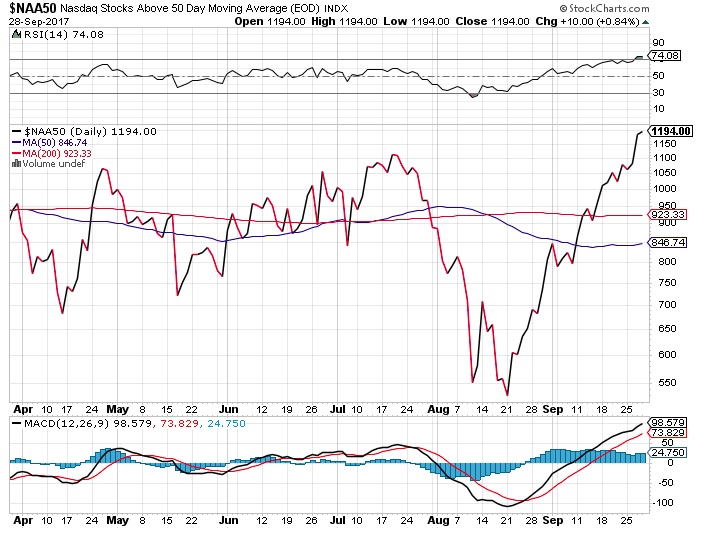
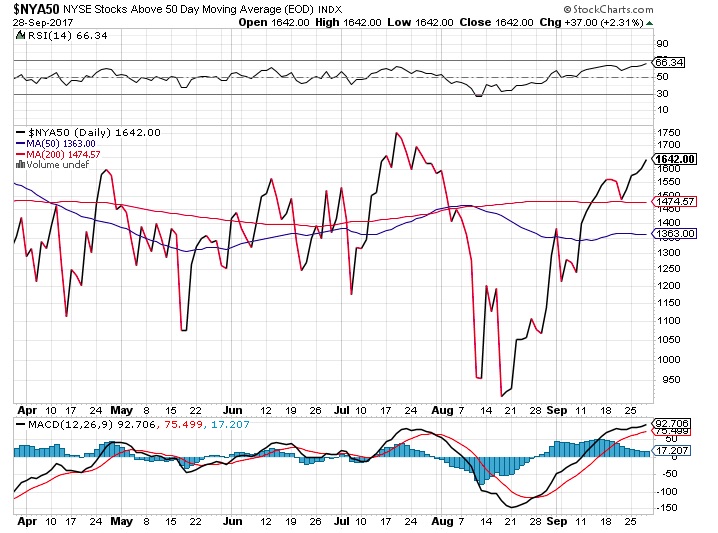
We then looked at the percent of companies above their 50-day moving average in the S&P 500, Nasdaq and the NYSE Composite. We found that the number of stocks trading above their 50-day moving averages has been rising, so from this metric, the markets are looking to have decent breadth, which limits the damage from those high fliers weakening.
When assessing either the markets or a stock we always want to find confirming or discordant data points to increase our confidence. While we have conflicting indicators here, our assessment leans more towards a bullish view based on this data for the near term.
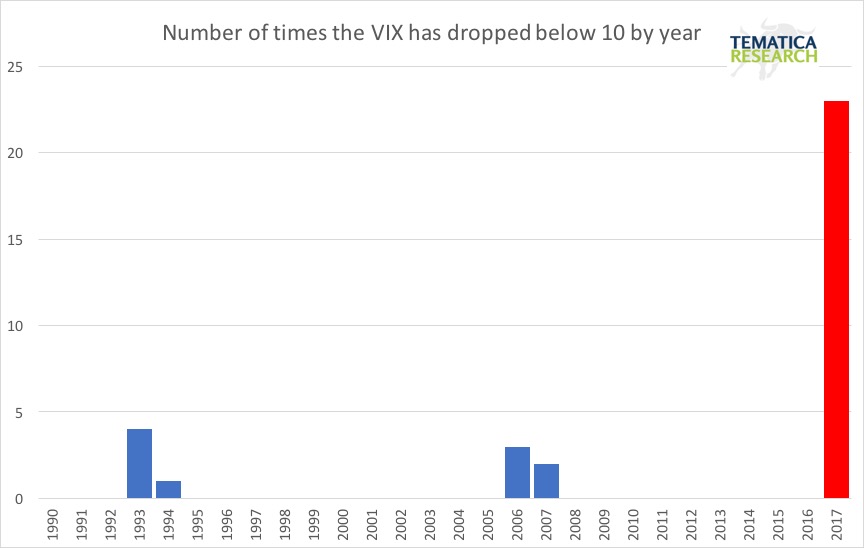
Volatility
What about that wacky VIX that appears to be on a IV drip of some sort of powerful sedative? No matter what gets thrown at it, the index continues to be like Fonzi. The recent Commitments of Traders report from the CFTC revealed that the net speculative short position on the VIX has once again reached a new record high at 171,187 futures and options contractions, taking out the prior 158,114 peak in early August. This is a 63% increase! Talk about the calm before the storm. Yeah, we know, been saying that for a while. This has been a seriously impressive run!
Of all the days the VIX has been below 10 since its inception, 70% those have been in 2017. We can’t help but shake our heads, (and remember to stock up on Alka Seltzer) when we consider the likely impact on the markets when the reversion to the mean rule kicks in.
Given the lack of volatility, investors seem to be going all in. The last week’s Market Vane report found that the bullish share has reached the highest level in the current bull market. The last time it was this high was in June 2007.
The bottom line is while equities are clearly expensive at these levels, the market breadth looks decent and volatility is still hitting the snooze button. The disconnect between fundamentals, historical norms and the current market is likely to at some point result in some seriously dramatic moves. However, we’ve all seen that expensive stocks can get even more expensive and for at least the near term, we are not seeing any clear catalyst for a pullback that would get the attention of this seemingly Teflon market.