
Central Bankers’ New Clothes
In this week’s musings:
- Earnings Season Kicks Off
- Central Bankers’ New Clothes
- Debt Ceiling – I’m Baaack
- Trade Wars – The Gift that Keeps on Giving
- Domestic Economy – More Signs of Sputtering
- Stocks – What Does It All Mean
It’s Earnings Season
Next week banks unofficially kick off the June quarter earnings season with expectations set for a -2.6% drop in S&P 500 earnings, (according to FactSet) after a decline of -0.4% in the first quarter of 2019. If the actual earnings for the June quarter end up being a decline, it will be the first time the S&P 500 has experienced two quarters of declines, (an earnings recession) since 2016. Recently the estimates for the third quarter have fallen from +0.2% to -0.3%. Heading into the second quarter, 113 S&P 500 companies have issued guidance. Of these, 87 have issued negative guidance, with just 26 issuing positive guidance. If the number issuing negative guidance does not increase, it will be the second highest number since FactSet began tracking this data in 2006. So not a rosy picture.
Naturally, in the post-financial crisis bad-is-good-and-good-is-bad-world, the S&P 500 is up nearly 20% in the face of contracting earnings — potentially three quarters worth — and experienced the best first half of the year since 1997. In the past week, both the S&P 500 and the Dow Jones Industrial Average have closed at record highs as Federal Reserve Chairman Powell’s testimony before Congress gave the market comfort that cuts are on the way. This week’s stronger than expected CPI and PPI numbers are unlikely to alter their intentions. Welcome to the world of the Central Bankers’ New Clothes.
Central Bankers’ New Clothes
Here are a few interesting side-effects of those lovely stimulus-oriented threads worn in the hallowed halls of the world’s major central banks.
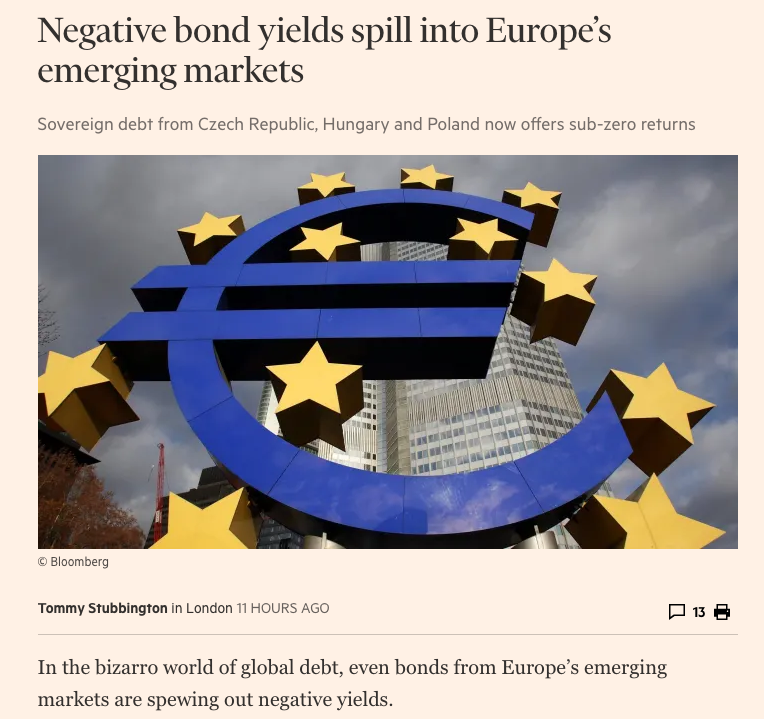
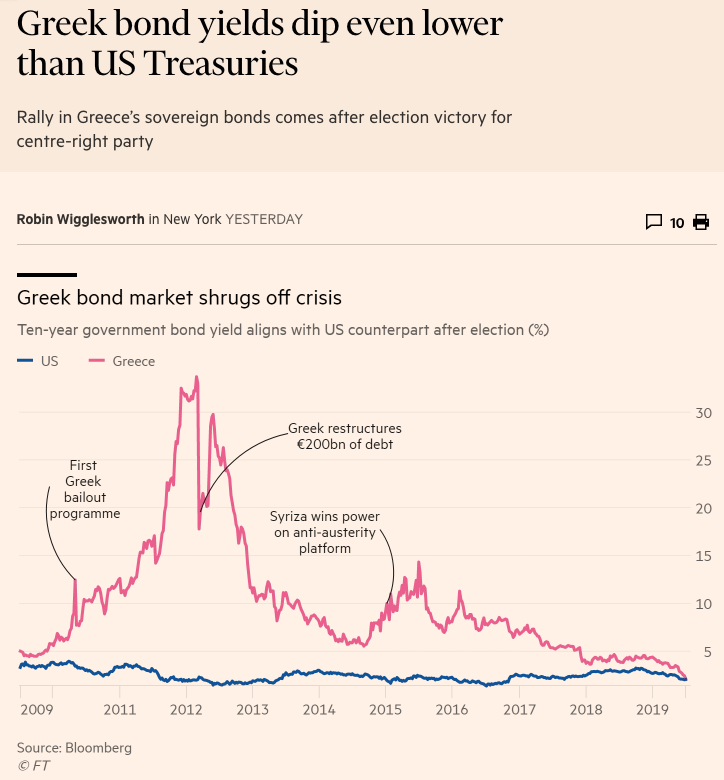
Yes, you read that right. Greece, the nation that was the very first to default on its debt back in 377BC and has been in default roughly 50% of the time since its independence in 1829, saw the yield on its 10-year drop below the yield on the 10-year US Treasury bond. But how can that be?
Back to those now rather stretchy stimulus suits worn by the world’s central bankers that allow for greater freedom of movement in all aspects of monetary policy. In recent weeks we’ve seen a waterfall of hints and downright promises to loosen up even more. The European Central Bank, the US Federal Reserve, the Bank of Canada have all gone seriously dovish. Over in Turkey, President Erdogan fired his central banker for not joining the party. Serbia, Australia, Dominican Republic, Iceland, Mozambique, Russia, Chile, Azerbaijan, India, Australia, Sri Lanka, Kyrgyzstan, Angola, Jamaica, Philippines, New Zealand, Malaysia, Rwanda, Malawi, Ukraine, Paraguay, Georgia, Egypt, Armenia, and Ghana have all cut rates so far this year, quite a few have done so multiple times. From September of 2018 through the end of 2018, there were 40 rate hikes by central banks around the world and just 3 cuts. Since the start of 2019, there have been 11 hikes and 38 cuts.
That’s a big shift, but why? Globally the economy is slowing and in the aftermath of the financial crisis, a slowing economy is far more dangerous than in years past. How’s that?
In the wake of the financial crisis, governments around the world set up barriers to protect large domestic companies. The central bankers aimed their bazookas at interest rates, which (mostly as an unintended consequence) ended up giving large but weak companies better access to cheap money than smaller but stronger companies. This resulted in increasing consolidation which in turn has been shrinking workers’ share of national income. For example, the US is currently shutting down established companies and generating new startups at the slowest rates in at least 50 years. Today much of the developed world faces highly consolidated industries with less competition and innovation (one of the reasons we believe our Disruptive Innovators investing theme is so powerful) and record levels of corporate debt. It took US corporations 50 years to accumulate $3 trillion in debt in the third quarter of 2003. In the first quarter of 2019, just over 15 years later, this figure had more than doubled to $6.4 trillion.
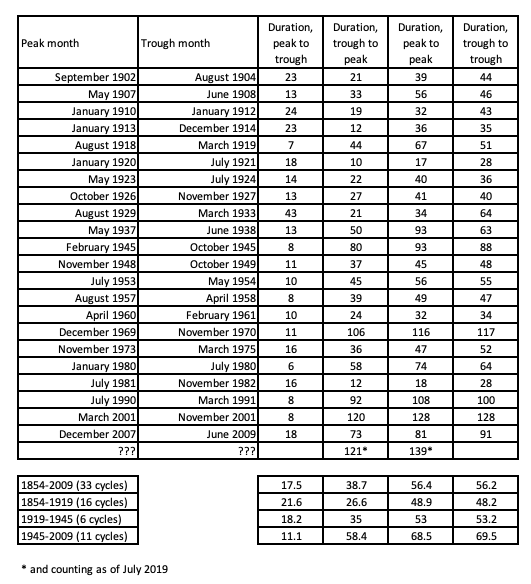
Along with the shrinking workers’ share of national income, we see a shrinking middle class in many of the developed nations – which we capitalize on in our Middle Class Squeeze investing theme. As one would expect, this results in the economy becoming more and more politicized – voters aren’t happy. Recessions, once considered a normal part of the economic cycle, have become something to be avoided at all costs. The following chart, (using data from the National Bureau of Economic Research) shows that since the mid-1850s, the average length of an economic cycle from trough to peak has been increasing from 26.6 months between 1854 and 1919 to 35 months between 1919 and 1945 to 58.4 months between 1945 and 2009. At the same time, the duration of the economic collapse from peak to trough has been shrinking. The current trough to (potential peak) is the longest on record at 121 months – great – but it is also the second weakest in terms of growth, beaten only by the 37-month expansion from October 1945 to November of 1948.
Why has it been so weak? One of the reasons has been the rise of the zombie corporation, those that don’t earn enough profit to cover their interest payments, surviving solely through refinancing – part of the reason we’ve seen ballooning corporate debt. The Bank for International Settlements estimates that zombie companies today account for 12% of all companies listed on stock exchanges around the world. In the United States zombies account for 16% of publicly listed companies, up from just 2% in the 1980s.
This is why central bankers around the world are so desperate for inflation and fear deflation. In a deflationary environment, the record level of debt would become more and more expensive, which would trigger delinquencies, defaults and downgrades, creating a deflationary cycle that feeds upon itself. Debtors love inflation, for as purchasing power falls, so does the current cost of that debt. But in a world of large zombie corporations, a slowing economy means the gap between profit and interest payments would continue to widen, making their survival ever more precarious. This economic reality is one of the reasons that nearly 20% of the global bond market has negative yield and 90% trade with a negative real yield (which takes inflation into account).
Debt Ceiling Debate – I’m baack!
While we are on the topic of bonds, the Bipartisan Policy Center recently reported that they believe there is a “significant risk” that the US will breach its debt limit in early September if Congress does not act quickly. Previously it was believed that the spending wall would not be hit until October or November. As the beltway gets more and more, shall we say raucous, this round could unnerve the markets.
Trade Wars – the gift that keeps on giving
Aside from the upcoming fun (sarcasm) of watching Congress and the President whack each other around over rising government debt, the trade war with China, which gave the equity markets a serious pop post G20 summit on the news that progress was being made, is once again looking less optimistic. China’s Commerce Minister Zhong Shan, who is considered a hardliner, has assumed new prominence in the talks, participating alongside Vice Premier Liu He (who has headed the Chinese team for over a year) in talks this week. The Chinese are obviously aware that with every passing month President Trump will feel more pressure to get something done before the 2020 elections and may be looking to see just how hard they can push.
Trade tensions between the US and Europe are back on the front page. This week, senators in France voted to pass a new tax that will impose a 3% charge on revenue for digital companies with revenues of more than €750m globally and €25m in France. This will hit roughly 30 companies, including Apple (AAPL), Facebook (FB), Amazon (AMZN) and Alphabet (GOOGL) as well as some companies from Germany, Spain, the UK and France. The Trump administration was not pleased and has launched a probe into the French tax to determine if it unfairly discriminates against US companies. This could lead to the US imposing punitive tariffs on French goods.
Not to be outdone, the UK is planning to pass a similar tax that would impose a 2% tax on revenues from search engine, social media and e-commerce platforms whose global revenues exceed £500m and whose UK revenue is over £25m. This tax, which so far appears to affect US companies disproportionately, is likely to raise additional ire at a time when the US-UK relationship is already on shaky ground over leaked cables from the UK’s ambassador that were less than complimentary about President Trump and his administration.
That’s just this week. Is it any wonder the DHL Global Trade Barometer is seeing a contraction in global trade? According to Morgan Stanley research, just under two thirds of countries have purchasing manager indices below 50, which is contraction territory and further warning signs of slowing global growth. This week also saw BASF SE (BASFY), the world’s largest chemical company, warn that the weakening global economy could cut its profits by 30% this year.
Domestic Economy – more signs of sputtering
The ISM Manufacturing index weakened again in June and has been declining now for 10 months. The New Orders component, which as its name would imply, is more forward-looking, is on the cusp of contracting. It has been declining since December 2017 and is at the lowest level since August 2016. Back in 2016 the US experienced a bit of an industrial sector mini-recession that was tempered in its severity by housing. Recall that back then we saw two consecutive quarters of decline in S&P 500 earnings. Today, overall Construction is in contraction with total construction spending down -2.3% year-over-year. Residential construction has been shrinking year-over-year for 8-months and in May was down -11.2% year-over-year. Commercial construction is even worse, down -13.7% year-over-year in May and has been steadily declining since December 2016. What helped back in 2016 is of no help today.
While the headlines over the employment data (excepting ADP’s report last week) have sounded rather solid, we have seen three consecutive downward revisions to employment figures in recent months. That’s the type of thing you see as the data is rolling over. The Challenger, Gray & Christmas job cuts report found that employer announced cuts YTD through May were 39% higher than the same period last year and we are heading into the 12thconsecutive month of year-over-year increases in job cuts – again that is indicative of a negative shift in employment.
Stocks – what does it all mean?
Currently, US stock prices, as measured by the price-to-sales ratio (because earnings are becoming less and less meaningful on a comparative basis thanks to all the share buybacks), exceed what we saw in the late 1999s and early 2000s. With all that central bank supplied liquidity, is it any wonder things are pricey?
On top of that, the S&P 500 share count has declined to a 20-year low as US companies spent over $800 million on buybacks in 2018 and are poised for a new record in 2019 based on Q1 activity. Overall the number of publicly-listed companies has fallen by 50% over the past 20 years and the accelerating pace of stock buybacks has made corporations the largest and only significant net buyer of stocks for the past 5 years! Central bank stimulus on top of fewer shares to purchase has overpowered fundamentals.
This week, some of the major indices once again reached record highs and given the accelerating trend in central bank easing, this is likely to continue for some time — but investors beware. Understand that these moves are not based on improving earnings, so it isn’t about the business fundamentals, (at least when we talk about equity markets in aggregate as there is always a growth story to be found somewhere regardless of the economy) but rather about the belief the central bank stimulus will continue to push share prices higher. Keep in mind that the typical Federal Reserve rate cut cycle amounts to cuts of on average 525 basis points. Today the Fed has only about half of that with which to work with before heading into negative rate territory.
The stimulus coming from most of the world’s major and many of the minor central banks likely will push the major averages higher until something shocks the market and it realizes, there really are no new clothes. What exactly that shock will be — possibly the upcoming debt ceiling debates, trade wars or intensifying geological tensions — is impossible to know with certainty today, but something that cannot go on forever, won’t.