Weekly Issue: While far from booming, U.S. economy not as bad as the headlines
Key points inside this issue
- Thematic confirmation in the July Retail Sales report
- Getting back to the global economy and that yield curve inversion
- The week ahead
- The Thematic Leaders and Select List
- A painful reminder about dividend cuts
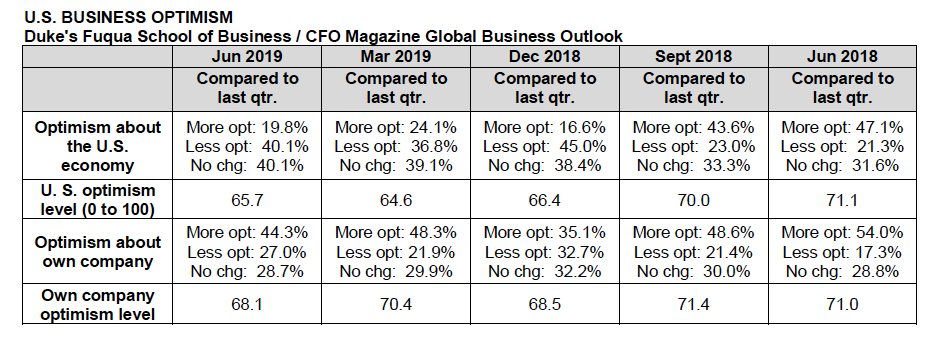
Despite Friday’s rebound, the stock market finished down week over week as it continued to grapple with the one-two punches of the slowing global economy and U.S.- China trade. There was much chatter on the recent yield-curve inversion, but as we look back at the economic data released last week, the U.S. economy continues to be on more solid footing than the Eurozone or China.
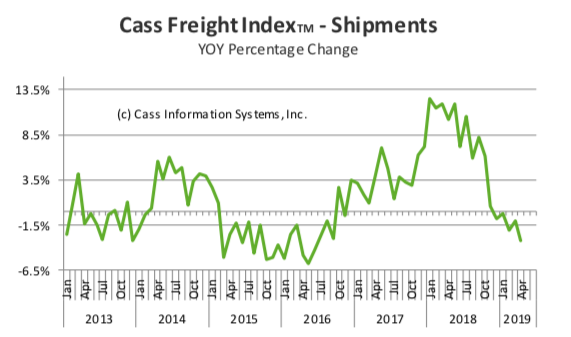
That’s not to say the domestic economy is booming. The Cass Freight Index, weekly railcar-traffic and truck-tonnage data and the July U.S. industrial-production report’s manufacturing component leave little question that America’s manufacturing economy is slowing. And as we saw last week, the U.S. consumer buoyed the economy in July with stronger-than-expected retail sales.
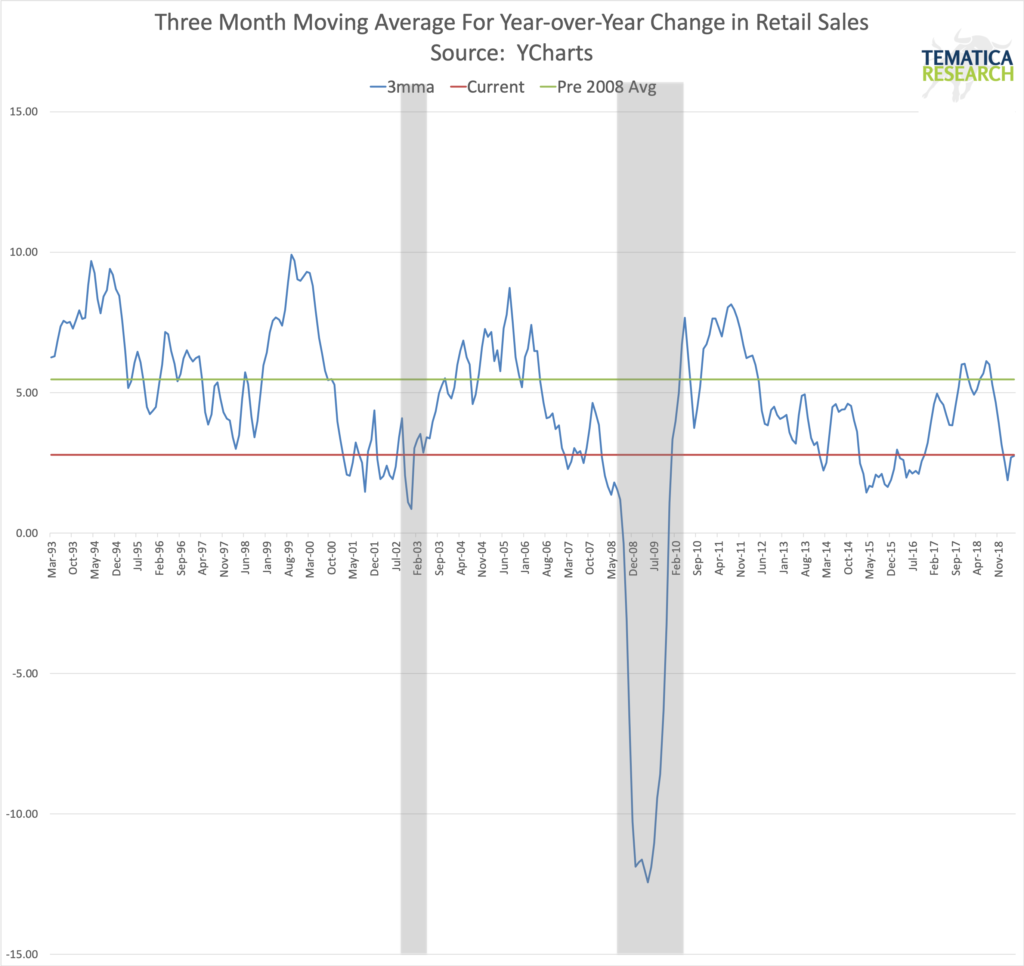
Thematic confirmation in the July Retail Sales report
Last week’s July Retail Sales Report confirmed one of the key aspects of our Digital Lifestyle investment theme – the accelerating shift toward digital shopping that continues to vex brick and mortar retailers, particularly department stores. Granted, the year over year increase in non- store retail sales of 16.0%, which was several magnitudes greater than overall July Retail Sales that rose 3.4% year over year and bested sequential expectations, was aided by Thematic King Amazon’s (AMZN) 2019 Prime Day event but one month does not make a quarter. For the three months ending July, non-store retail sales rose 14.2% year over year, easily outstripping the 3.2% year over year comparison for overall retail sales.
Clearly, the shift to digital shopping is not only
Each of those challenged categories I mentioned above are also areas that Amazon continues to target with offerings from both third-party sellers as well as its growing private label line of products. I’ve often said Amazon shares are ones to hold, not trade, and we continue to feel that way as we approach the seasonally strongest time of the year for its business.
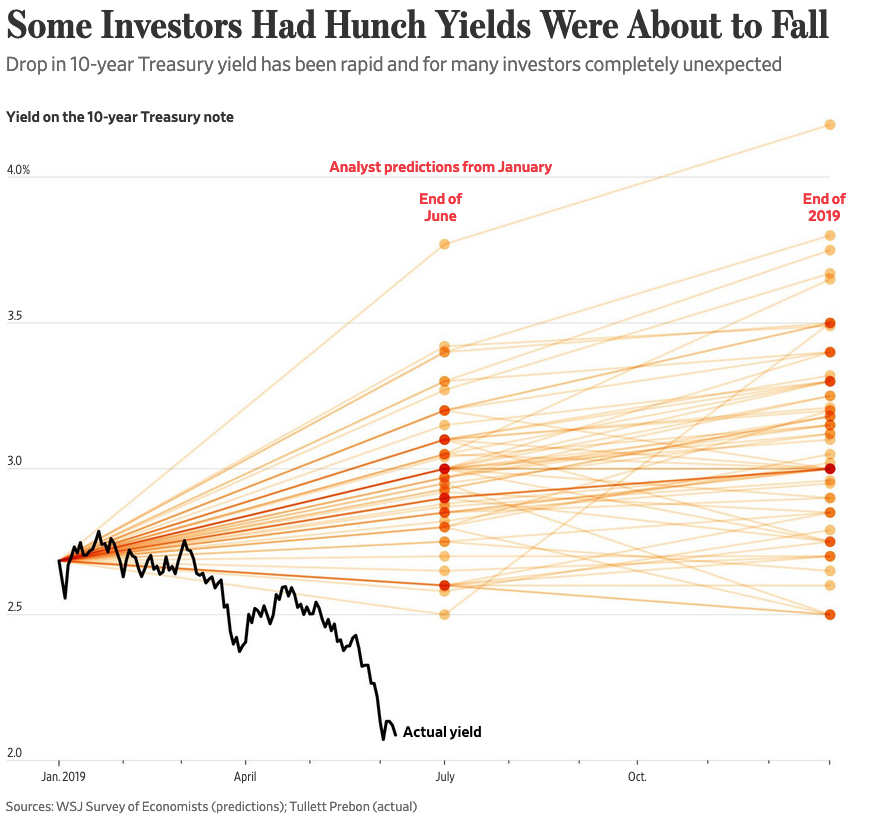
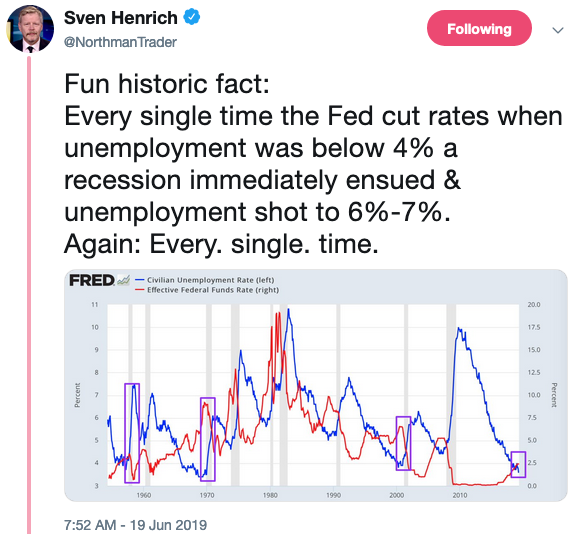
Getting back to the global economy and that yield curve inversion
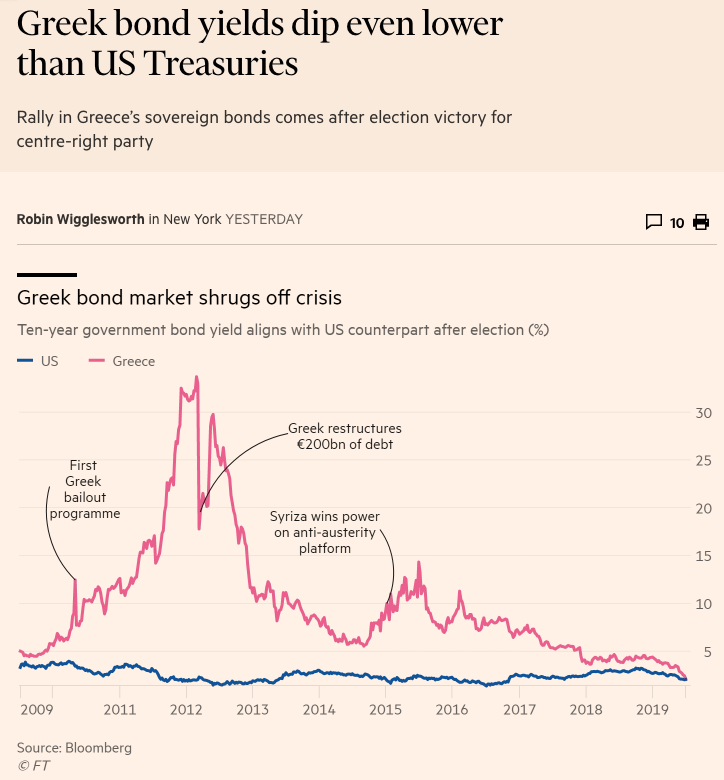
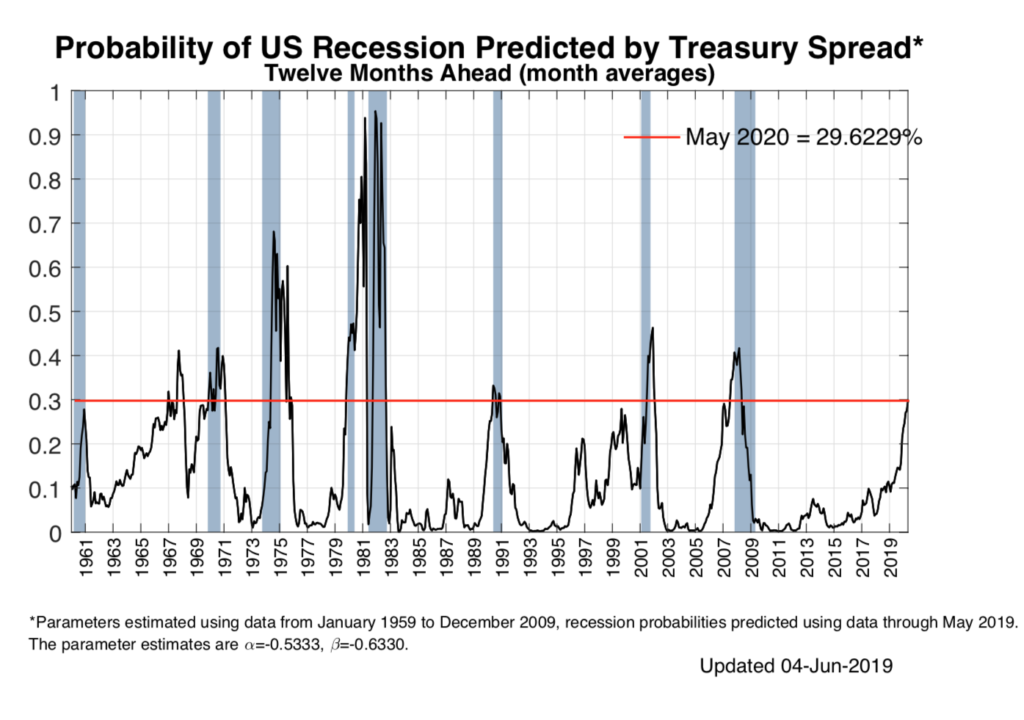
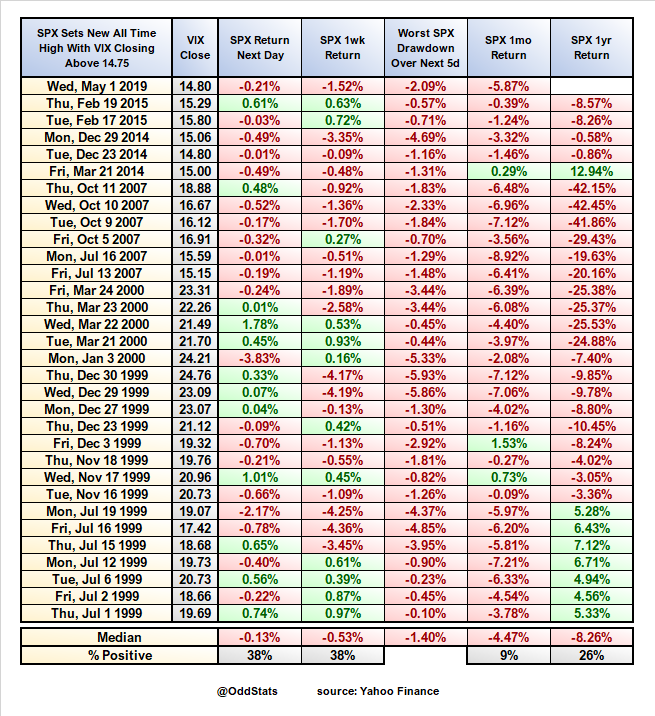
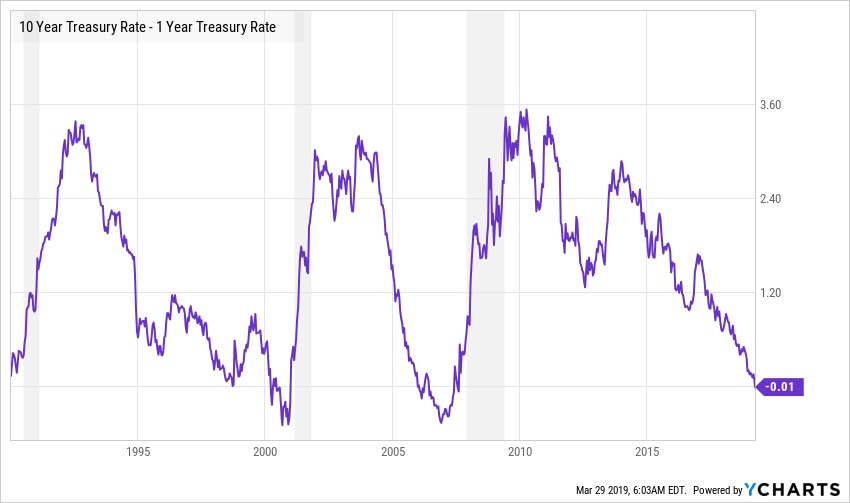
For now, the U.S. economy remains the best house on the economic block — but it’s showing signs of wear. Of course, the fact the yield curve inverted briefly last week rang the “Recession Warning Bell.” But let’s remember that there’s historically been a lag of up to almost two years following that warning. Moreover, the Federal Reserve has already adopted a more dovish tone and will likely stand ready to add more stimulus to the economy if need be. All eyes will now on the Fed’s mid-September monetary-policy meeting.
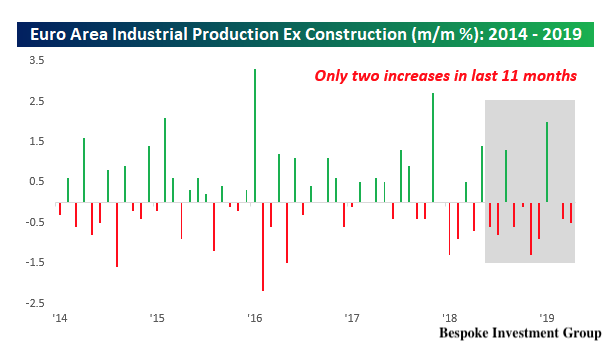
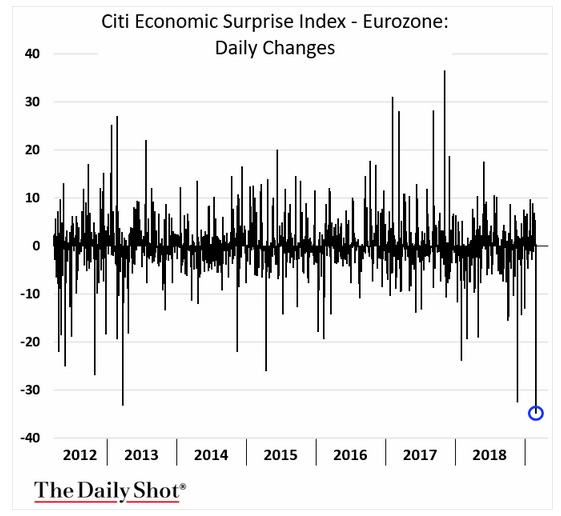
Meanwhile, as economic-growth worries increased in the Eurozone and China last week, we heard about a big bazooka of stimulative measures that the European Central Bank is considering for its Sept. 12 policy meeting. China will also reportedly soon roll out a plan to boost disposable income over the coming quarters to spur its domestic consumption.
I would suggest you tune in later this week for what Tematica’s Chief Macro Strategist Lenore Hawkins has to say on this.
We’ll continue to monitor how global central bankers try to steer their respective economies in the coming weeks. While we suspect that Wall Street will likely cheer any and all dovish moves, the question remains how stimulative those policies will really be if the U.S.-China trade war continues.
U.S.-Chinese trade talks are set to resume in September, which tells us that we might get a lull in Wall Street’s recent volatility. But we should by no means think that “Elvis has left the building,” and we could very well see another round of turbulence in the coming weeks.
The Week Ahead
With two weeks to go until the Labor Day holiday weekend, we’re officially in the dog days of summer. These weeks historically see lower-than-usual trading volume, as investors and traders look to squeeze in that last bit of fun in the sun. Following last week’s full plate of economic data, this week will have a far smaller helping coming at us. Upcoming reports include July new- and existing-home sales, as well as the Index of Leading Economic Indicators.
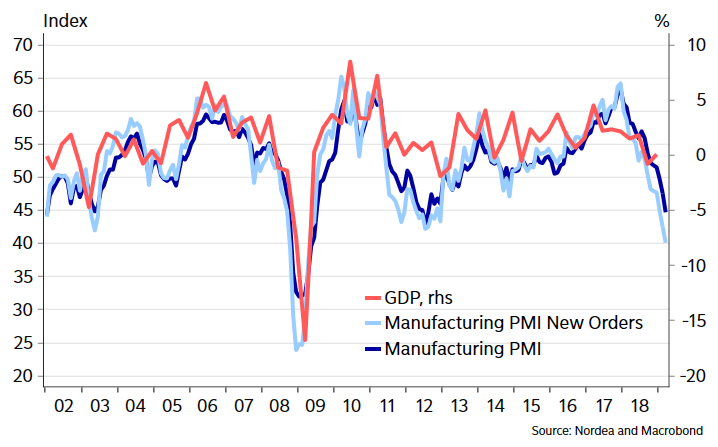
Investors will also focus on what the latest flash PMI data from IHS Markit has to say about the global economy when that report lands on Aug. 22. I’ll be looking to see whether the U.S. economy continues to outperform Japan, China and the Eurozone following data out last week that suggested the German and Chinese economies continue to slow.
Reading those reports and the upcoming Federal Open Market Committee meeting minutes should set the stage for what we’re likely to hear when the FOMC next meets on Sept. 18. We’ll also have more data coming our way over the weeks leading up to the FOMC session, and we’re apt to get a few surprises along the way. While there’s no Fed interest-rate meeting scheduled for August, the Kansas City Fed will hold its widely watched annual Jackson Hole symposium Aug. 22-24 in Wyoming. The central bank doesn’t usually discuss monetary-policy plans at this event, but we aren’t exactly in normal times these days.
On the earnings calendar this week, the focus will continue to be on retail. If we were reminded of one thing last week in retail land, it’s that not all companies are responding the same way to retailing’s changing landscape. Just look at what we heard last week from Walmart (WMT), Macy’s (M) and JCPenney (JCP). Other key retail reports to watch this week include Home Depot (HD), Kohl’s (KSS), Lowe’s (LOW), Target (TGT), Dick’s Sporting Goods (DKS), and Foot Locker (FL). I’ll be looking for the degree to which they’re embracing digital shopping, as well as what they have to say about tariff implications and their expectations for 2019’s remainder.
We’ll also hear from Salesforce (CRM) and Toll Brothers (TOL), which should shed some light on the housing market and IT spending associated with our Disruptive Innovators and Digital Infrastructure investing themes.
The Thematic Leaders and Select List
As I noted above, last week was another choppy one for the stock market and those swings stopped out of Thematic Digital Infrastructure Leader Dycom Industries (DY) as well as Cleaner Living company International Flavors & Fragrances (IFF) shares. Given that we were stopped out, it means we took some losses in those two positions, but as I look at the live ones across the Thematic Leaders and the Select List I see an impressive array of returns with our Amazon, Costco Wholesale (COST), Chipotle Mexican Grill (CMG), McCormick & Co. (MKC), Walt Disney (DIS), Universal Display (OLED) and USA Technologies (USAT) shares.
Wide swings in the market can present both challenging times as well as opportunities provided, we get some degree of clarity. As I touched on above, the first few weeks of September could be when we see that clarity emerge. Until then, we’ll continue to look for thematically well positioned companies at favorable risk to reward entry points.
A painful reminder about dividend cuts
Last week I mentioned that the following – I’m focusing more on domestic-focused, inelastic business models that tend to spit off cash and drive dividends. In particular, I’m looking at companies with a track record of increasing their dividends every year for at least 10 years. And of course, they have to have vibrant thematic tailwinds at their respective back.
While I was doing just that, shares of famous lawn-mower engine maker Briggs & Stratton Corp. (BGG) — whose shares tumbled 44.5% last Thursday — presented a sharp reminder as to what can happen when a company cuts its dividend. Yes, the shares rebounded late last week along with the market, but they’ve been generally falling for a long time as the company’s dividend looked shakier and shakier.
Investors tend to think of quarterly dividends as payments in perpetuity, but these payouts are actually only declared at a company board’s discretion. When dividends are disrupted, that can lead to significant share-price pain for a stock.
In this case, Briggs & Stratton not only cut its dividend and reported a far-greater-than-expected quarterly loss, but also slashed its outlook for the balance of the year. The company now expects to earn just $0.20-$0.40 per share for the full year, which down significantly from its prior forecast of $1.30.
When matched up against its revised revenue forecast of $1.91 billion to $1.97 billion vs. a prior $2.01 billion, it’s rather evident that BGG’s cost structure has become an issue. So, it’s no little surprise that Briggs & Stratton also announced plans to close a plant that manufactures engines for the walk-behind lawn mowers you commonly find at Home Depot (HD) or Lowe’s (LOW) .
The company called out that product category in particular for weakness, which management attributed to the U.S. housing market’s current tone. I’ve previously talked about how new- and existing-home sales have been rather sluggish despite the recent mortgage-rate drop, with low rates fueling a wave of home refinancings rather than purchases.
But the biggest factor behind Thursday’s steep BGG dive was the fact that management slashed the company’s quarterly dividend by 64% to $0.05 per share from the prior $0.14. That one-two-three punch combination — bad earnings, a bad forecast and a dividend cut — sent Briggs & Stratton’s share price tumbling.
Going into Thursday morning’s earnings report, BGG shares were sporting a 6.8% dividend yield, which is on the lofty side. Investors should have interpreted that as a warning and here’s why – even before Thursday’s selloff, BGG shares had been down some 70% since January 2018, partly because the company missed analysts’ earnings expectations for the prior three quarters. In hindsight, the misses were escalating in percentage terms — a trend that continued with Thursday’s earnings report.
Paired with the dividend cut, there’s little confidence any more in the current management team, which means BGG shares are likely to flounder further due to several unknowns. Some of those unknowns are company specific, like: “Will be the plant closure deliver sufficient savings?” But others are about the U.S. economy’s future vector and velocity, which Thursday’s July industrial-production report shows is continuing to cool.
And while the July U.S. retail-sales report came in better than expected, we already know that consumers aren’t buying lawnmowers. And unfortunately, that’s not likely to change any time soon as we put the summer behind us.
The bottom line — as I’ve discussed before, when a stock’s dividend yield looks too good to be true, odds are it is just that. BGG is just the latest stock to prove that. While its newly revised dividend yield (4.1%) might still look enticing, it’s not one that we should be clamoring for given the lack of thematic tailwinds for its lawnmowing business. But at a minimum, no investor should consider the shares until there is some proof that management’s turnaround plan is on the cusp of delivering.