
This Week’s Issue: Hear those engines? It’s earnings season!
Coming into this week 15% of the S&P 500 companies have reported and exiting it that percentage will jump to 45%. What the market and investors will be focusing on this week is what led to
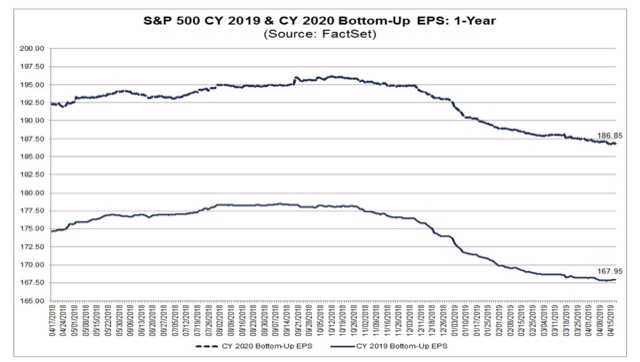
If we get the data to show these March reports and prospects for the current quarter are better than expected or feared, we could see the 2019 view for S&P 500 earnings move higher vs. the meager 3.7% growth forecast to $167.95. If that happens, it will mark a change in view for 2019 expectations, which have been eroding over the last several months, and could drive the market higher. However, if we see a pickup in downward EPS cuts, we could see those 2019 S&P 500 consensus expectations come under pressure, which would make the stock market even more expensive following its year to date run of 16%.
Now to sift through the onslaught of more than 680 companies reporting this week, which based on what we’re seeing this morning from Coca-Cola (KO), Lockheed Martin (LMT), Twitter (TWTR) and Pulte Group (PHM) suggest potential upside
Coca-Cola is feeling the tailwind of our Cleaner Living investing theme as sales of its flavored waters and sports drinks rose 6% year over year, significantly faster than the 1% growth posted by its carbonated drinks business. During the earnings conference call, CEO James Quincy shared that the management team is looking to make Coca-Cola a “total beverage company” by adding coffees, teas, smoothies and flavored waters to a portfolio that has traditionally offered aerated drinks.
Lockheed Martin Corp reported better-than-expected quarterly profit yesterday, benefitting from the Safety & Securitytailwind associated with President Donald Trump’s looser policies on foreign arms sales boosted demand for missiles and fighter jets.
Efforts to improve its advertising business model helped Twitter capture some of our Digital Lifestyletailwind as year over year monetizable daily user growth returned to double digits for the first time in several quarters.
Verizon (VZ) beat quarterly expectations and on its earnings conference call 5G and its deployment in the coming quarters was a key topic during the question and answer session. Verizon will continue to build out its network and bring more 5G capable smartphones to market, which in my view continues to bode well for our Digital
Splitting the Housing and Retail Sales hairs
Late last week we received some conflicting economic data in the form of the March Retail Sales report and the March Housing Starts data. While retail sales for the month came in stronger than expected — a welcome sign following the last few months in which that data disappointed relative to expectations — March housing starts fell to their weakest point since 2017 despite a tick down in mortgage rates. Now let’s take a deeper dive into those two reports:
In looking at the March Retail Sales report, total retail rose 1.7% month over month (3.5% year over year) with broad-based sales strength and nice gains seen across discretionary spending categories. While we are quite pleased with the month’s data, subscribers know we tend to favor a longer-term perspective when it comes to identifying data trends. Consequently, as we are bracing for the March quarter earnings onslaught it makes sense to examine how retail sales in this year’s March quarter compared to the year-ago quarter. Here we go:
Leaders for the March 2019 quarter vs. March 2018 quarter:
- Nonstore retailers up more than 11%, which bodes very well for Thematic King Amazon (AMZN) and to a lesser extent our Alphabet (GOOGL). Let’s remember that those packages need to get to their intended destinations, which likely means positive things for United Parcel Service (UPS), and I’ll be checking that report, which is out later this week.
- Food services & drinking places rose 4.4%, which points to favorable data for Guilty Pleasure Thematic Leader Del Frisco’s Restaurant Group (DFRG). And yes, I continue to wait on more about its strategic review process.
- Health & personal care stores were up 4.6%.
- Building material & garden suppliers and dealers
increased by 4.7%.
Laggards for the March 2019 quarter vs. March 2018 quarter:
- Sporting goods, hobby, musical instrument, & book stores were down 7.9
- Department Stores fell 3.8%, which comes as no surprise to me given the accelerating shift to digital shopping that is part of our Digital Lifestyle investing theme.
- Miscellaneous store retailers were down 3.8%
Turning to the March Housing Starts report, the aggregate starts data fell to the weakest level since 2017, but that decline includes both single-family and multifamily housing starts. Breaking down those two components, single-family starts were down 0.4% to 781,000, the slowest pace since September 2016, while permits decreased 1.1% to 808,000, the lowest since August 2017. Multifamily starts, which include apartments and condominiums, were unchanged month over month at 354,000, while those permits fell 2.7%.
The March results may have been influenced to some degree by harsh weather in the Northeast, which contended with heavy snowfalls, and in the South as it dealt with record flooding along the Mississippi and Missouri rivers. Even so, the housing data were off despite a decline in the 30-year mortgage rate to roughly 4.15% this month from 4.86% last October, according to data from Marcrotrends. This decline likely signals that consumers are being priced out of the market as developers and home builders continue to struggle with building affordable properties amid rising labor and materials costs. We also must consider the state of the consumer, who is dealing with the impact of higher debt levels across credit cards, auto loans and student loans — a combination that is sapping disposable income and the ability to service mortgages on homes they may not be able to afford.
Generally speaking, most existing homeowners in the U.S. use the capital from selling their current homes to help fund the purchase of their next dwellings. This means we as investors should watch Existing Home Sales data as a precursor to new home sales and housing starts. Despite February’s better-than-expected sequential print, Existing Home Sales have been falling on a year-over-year basis since February 2018.
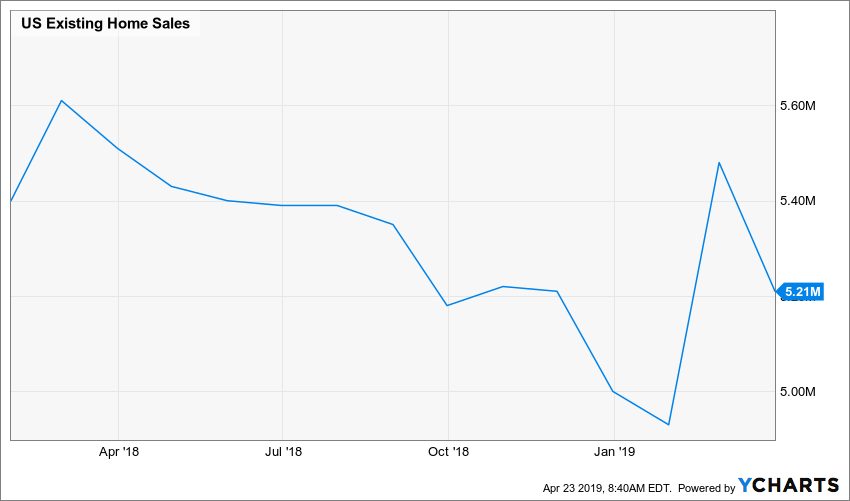
Per March Existing Home Sales report, which showed a 5.4% sequential drop vs. February and a similar decline vs. a year ago. For the March quarter, existing home sales fell 5.3%, which in our opinion does not augur well for a near-term pick up in the overall housing market, especially as the recent decline in mortgage rates has not jump started new mortgage applications.
Generally speaking, the housing market has two seasonally strong periods during the year, the spring and fall selling seasons, of which spring tends to be the stronger one. This year, it could be argued that harsh weather in various parts of the U.S. has resulted in the spring selling season getting off to a slow start. Leading up to it, we have seen a climb in the inventory of new homes listed for sale, according to Realtor.com. That’s the supply side of the equation, but the side we remain concerned about is demand.
As we get more data in the coming weeks, we’ll be better able to suss out if we are dealing with a weather related situation, a consumer affordability one or some combination of the two. If the data points to a consumer affordability one, we may consider Home Depot (HD), which is a company that cuts across our Middle Class Squeeze and Affordable Luxury investing themes. Through last night, however, HD shares are up some 28% year to date, and are sitting in over bought territory. Should we see a sizable pullback over the coming weeks as more earnings reports are had and digested, this could be one to revisit.