Weekly Issue: While Most Eyes Are on the Fed, We Look at a Farfetch(ed) Idea

Weekly Issue: While Most Eyes Are on the Fed, We Look at a Farfetch(ed) Idea

Key points inside this issue

  • The Fed Takes Center Stage Once Again
  • Farfetch Limited (FTCH) – A fashionable Living the Life Thematic Leader
  • Digital Lifestyle – The August Retail Sales confirms the adoption continues


Economics & Expectations

The Fed Takes Center Stage Once Again

As we saw last week, the primary drivers of the stock market continue to be developments on the U.S.-China trade front and the next steps in monetary policy. As the European Central Bank stepped up its monetary policy loosening, it left some to wonder how much dry powder it had remaining should the global economy slow further and tip into a recession. Amid those concerns, along with some discrepancy among reports that President Trump would acquiesce to a two-step trade deal with China, stocks finished last week with a whimper after rebounding Wednesday and Thursday.

We continue to see intellectual property and national security as key tenets in negotiating a trade deal with China. We will watch as the lead up to October’s next round of trade negotiations unfolds. Given the Fed’s next two-day monetary policy meeting that begins on Tuesday and culminates with the Fed’s announcement and subsequent press conference, barring any new U.S.-China trade developments before then, it’s safe to say what the Fed says will be a key driver of the stock market this week.

Leading up to that next Fed press conference, we will get the August data for Industrial Production and Housing Starts as well as the September Empire State Manufacturing Index. Paired with Friday’s August Retail Sales report and last Thursday’s August CPI report, that will be some of the last data the Fed factors into its policy decision.

Per the CME Group’s FedWatch tool, the market sees an 82% probability for the Fed to cut interest rates by 25 basis points this week with possibly one more rate cut to be had before we exit 2019. Normally speaking, parsing the Fed’s words and Fe Chair Powell’s presser commentary are key to getting inside the central bank’s “head,” and this will be especially important this time around. One of our concerns has been the difference between the economic data and the expectations it is yielding in the stock market. Should the Fed manage to catch the market off guard, odds are it will give the market a touch of agita.

On the earnings front

there are five reports that we’ll be paying close attention to this week. They are Adobe Systems (ADBE), Chewy (CHWY), FedEx (FDX), General Mills (GIS) and Darden Restaurants (DRI). With Adobe, we’ll be examining the rate of growth tied to cloud, an aspect of our Disruptive Innovators investing theme. With Darden we’ll look to see if the performance at its full-service restaurants matches up with the consumer trade-down data being reported by the National Restaurant Association. That data has powered shares of Cleaner Living Thematic Leader and Cleaner Living Index resident Chipotle Mexican Grill (CMG) higher of late, bringing the year to date return to 82% vs. 20% for the S&P 500. Chewy is a Digital Lifestyle company that is focused on the pet market serving up food, toys, medications and other pet products. Fedex will not only offer some confirmation on the digital shopping aspect of our Digital Lifestyle investing theme it will also shed some light on the global economy as well.


Farfetch Limited – A fashionable Living the Life Thematic Leader

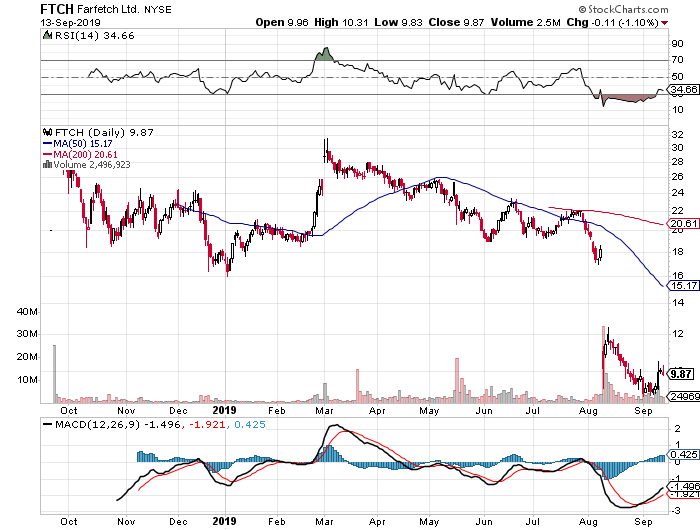
In last week’s issue, I mentioned that I was collecting my thoughts on Farfetch Limited (FTCH), a company that sits at the intersection of the luxury goods market and digital commerce. Said thematically, Farfetch is a company that reflects our Living the Life investment theme, while also benefitting from tailwinds of our Digital Lifestyle theme. Even though the company went public last year, it’s not a household name even though it operates a global luxury digital marketplace. As the shares have fallen over the last several weeks, I’ve had my eyes on them and now is the time to dip our toes in the water by adding FTCH as a Thematic Leader.


Farfetch Provides Digital Shopping to the Exploding Global Luxury Market

Farfetch is a play on the global $100 billion online luxury market with access to over 3,200 different brands across more than 1,100 brand boutique partners across its platform. With both high-end and every-day consumers continuing to shift their shopping to online and mobile platforms, we see Farfetch attacking a growing market that also has the combined benefit of appealing to the aspirational shopper and being relatively inelastic compared to mainstream apparel.

Part of what is fueling the global demand for luxury and aspirational goods is the rising disposable income of consumers in Asia, particularly China. According to Hurun’s report, The Chinese Luxury Traveler, enthusiasm for overseas travel shows no signs of abating, with the proportion of time spent on overseas tourism among luxury travelers increasing 5% to become 70% of the total. Cosmetics, (45%), local specialties (43%), luggage (39%), clothing and accessories (37%) and jewelry (34%) remain the most sought — after items among luxury travelers. High domestic import duties and concerns about fake products contribute to the popularity of shopping abroad.

It should come as little surprise then that roughly 31% of FarFetch’s 2018 revenue was derived from Asia-Pacific with the balance split between Europe, Middle East & Africa (40%) and the Americas (29%). At the end of the June 2019 quarter, the company had 1.77 million active customers, up from 1.35 million exiting 2018 and 0.9 million in 2017. As the number of active users has grown so too has Farfetch’s revenue, which hit $718 million over the 12 months ending June 2019 compared to $602 million in all of 2018 and $386 million in 2017.

Farfetch primarily monetizes its platform by serving as a commercial intermediary between sellers and end consumers and earns a commission for this service. That revenue stream also includes fees charged to sellers for other activities, such as packaging, credit-card processing, and other transaction processing activities. That business accounts for 80%-85% of Farfetch’s overall revenue with the balance derived from Platform Fulfillment Revenue and to a small extent In-Store Revenue.

New Acquisition Transformed Farfetch’s Revenue Mix 

In August, Farfetch announced the acquisition of New Guards Group, the Milan-based parent company of Off-White, Heron Preston and Palm Angels, in a deal valued at $675 million. New Guards will serve as the basis for a new business segment at Farfetch, one that it has named Brand Platform. Brand Platform will allow Farfetch to leverage New Guards’ design and product capabilities to expand the reach of its brands as well as develop new brands that span the Farfetch platform. For the 12-month period ending April 2019, the New Guards portfolio delivered revenue of $345 million, with profits before tax of $95 million. By comparison, Farfetch posted $654 million in revenue and an operating loss of $183 million over that time frame.

Clearly, another part of the thought behind acquiring New Guards and building the Brand Platform business is to improve the company’s margin and profit profile. And on the housekeeping front, the $675 million paid for New Guards will be equally split between cash and stock. Following its IPO last year, Farfetch ended the June quarter with roughly $1 billion in cash and equivalents on its balance sheet.

In many ways what we have here is a baby Amazon (AMZN) that is focused on luxury goods. Ah, the evolution of digital shopping! And while there are a number of publicly traded companies tied to digital shopping, there are few that focus solely on luxury goods.

Why Now is the Time to Add FTCH Shares

We are heading into the company’s seasonally strongest time of year, the holiday shopping season, and over the last few years, the December quarter has accounted for almost 35% of Farfetch’s annual sales. With the company’s active user base continuing to grow by leaps and bounds, that historical pattern is likely to repeat itself. Current consensus expectations have Farfetch hitting $964 million in revenue for all of 2019 and then $1.4 billion in 2020.

At the current share price, FTCH shares are trading at 1.6x expected 2020 sales on an enterprise value-to-sales basis. The consensus price target among the 10 Wall Street analysts that cover the stock is $22, which equates to an EV/2020 sales multiple of near 3.5x when adjusting for the pending New Guards acquisition. As we move through this valuation exercise, we have to factor into our thinking that Farfetch is not expected to become EBITDA positive until 2021. In our view, that warrants a bit of haircut on the multiple side and utilizing an EV/2020 sale multiple of 2.5x derives our $16 price target.

  • Despite that multiple, there is roughly 60% potential upside to that target vs. downside to the 52-week low of $8.82.
  • We are adding FTCH shares to the Thematic Leaders for our Living the Life investing theme.
  • A $16 price target is being set and we will wait to put any sort of stop-loss floor in place.


Digital Lifestyle – The August Retail Sales confirms the adoption continues

One of last week’s key economic reports was the August Retail Sales report due in part to the simple fact the consumer directly or indirectly accounts for two-thirds of the domestic economy. Moreover, with the manufacturing and industrial facing data – both economic and other third-party kinds, such as truck tonnage, railcar loadings and the like – softening in the June quarter, that quarter’s positive GDP print hinged entirely on the consumer. With domestic manufacturing and industrial data weakening further in July and August, the looming question being asked by many an investor is whether the consumer can keep the economy chugging along?

In recent months, I’ve voiced growing concerns over the spending health of the consumer as more data suggests a strengthening tailwind for our Middle-Class Squeeze investing theme. Some of that includes the Federal Reserve Bank of New York’s latest Household Debt and Credit Report, consumer household debt balances have been on the rise for five years and quarterly increases continue on a consecutive basis, bringing the second quarter 2019 total to $192 billion. Also a growing number of banks are warning over rising credit card delinquencies even as the Federal Reserve’s July Consumer Credit data showed revolving credit expanded at its fastest pace since November 2017.

Getting back to the August Retail Sale report, the headline print was a tad better than expected, however once we removed auto sales, retail sales for the month were flat. That’s on a sequential basis, but when viewed on a year over year one, retail sales excluding autos rose 3.5% year over year. That brought the year over year comparison for the three-months ending with August to up 3.4% and 1.5% stronger than the three months ending in May on the same basis.

Again, perspective can be illuminating when looking at the data, but what really shined during the month of August was digital shopping, which rose 16.0% year over year. That continued strength following the expected July surge in digital shopping due to Amazon Prime Day and all the others that looked to cash in on it led year over year digital shopping sales to rise 15.0% for the three months ending in August.

Without question, this aspect of our Digital Lifestyle investing theme continues to take consumer wallet share, primarily at the expense of brick & mortar retailers, especially department stores, which saw their August retail sales fall 5.4%. That continues the pain felt by department stores and helps explain why more than 7,000 brick & mortar locations have shuttered their doors thus far in 2019. Odds are there is more of that to come as consumers continue to shift their dollar purchase volume to online and mobile shopping as Walmart (WMT), Target (TGT) and others look to compete with Amazon Prime’s one day delivery.

  • For all the reasons discussed above, Amazon remains our Thematic King as we head into the seasonally strong holiday shopping season. 


Apple’s negative pre-announcement serves as a reminder to the number of risks that have accumulated

Apple’s negative pre-announcement serves as a reminder to the number of risks that have accumulated


We are “breaking in” to share my thoughts with you on the implications of Apple’s (AAPL) downside December quarter earnings news last night. Quickly this is exactly of what I was concerned about in early December, but rather than take a victory lap, let’s discuss what it means and what we’re going to do. 

Last night we received a negative December quarter earnings preannouncement from Apple (AAPL), which is weighing on both AAPL shares as well as the overall market. It serves as a reminder to the number of risks that have accumulated during the December quarter – the slowing global economy, including here at home; the US-China trade war; Brexit and other geopolitical uncertainty in the eurozone; the strong dollar; shrinking liquidity and a Fed that looks to remain on its rate hike path while also unwinding its balance sheet. Lenore Hawkins and I talked about these at length on the Dec. 21 podcast, which you can listen to here.

In short, a growing list of worries that are fueling uncertainty in the market and in corporate boardrooms. When the outlook is less than clear, companies tend to issue conservative guidance which may conflict with Wall Street consensus expectations. In the past when that has happened, it’s led to a re-think in growth prospects for both the economy, corporate profits and earnings, the mother’s milk for stock prices.

These factors and what they are likely to mean when companies begin issuing their December quarter results and 2019 outlooks in the coming weeks, were one of the primary reasons we added the ProShares Short S&P 500 (SH) shares to our holdings in just under a month ago. While the market fell considerably during December, our SH shares rose 5% offering some respite from the market pain. As expectations get reset, and odds are they will, we will continue to focus on the thematic tailwinds and thematic signals that have been and will remain our North Star for the Thematic Leaders and the larger Select List.


What did Apple have to say?

In a letter to shareholders last night, Apple CEO Tim Cook shared that revenue for the quarter would come in near $84 billion for the quarter vs. the consensus estimate of $91.5 billion and $88.3 billion, primarily due to weaker than expected iPhone sales. In the letter, which can be read here, while Apple cited several known headwinds for the quarter that it baked into its forecast such as iPhone launch timing, the dollar, supply constraints, and growing global economic weakness, it fingered stronger than expected declines in the emerging markets and China in particular.

Per the letter, most of the “revenue shortfall to our guidance, and over 100 percent of our year-over-year worldwide revenue decline occurred in Greater China across iPhone, Mac, and iPad.”

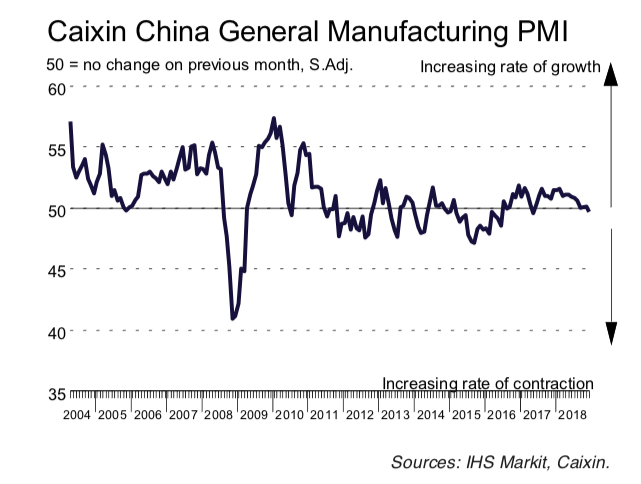
Cook went on to acknowledge the slowing China economy, which we saw evidence of in yesterday’s December Markit data for China. Per that report,

“The Caixin China General Manufacturing PMI dipped to 49.7 in December, the first time since May 2017 that the reading has been below 50, the mark that separates expansion from contraction. The sub-index for new orders slid below the breakeven point of 50 for the first time since June 2016, reflecting decreasing demand in the manufacturing sector.”

In our view here at Tematica, that fall in orders likely means China’s economy will be starting off 2019 in contraction mode. This will weigh on corporate management teams as they formulate their formal guidance to be issued during the soon to be upon us December quarter earnings season.

Also, in his letter, Cook called out the “rising trade tensions with the United States”  and the impact on iPhone demand in particular.

In typical Apple fashion, it discussed the long-term opportunities, including those in China, and other positives, citing that Services, Mac, iPad, Wearables/Home/Accessories) combined to grow almost 19% year-over-year during the quarter with records being set in a number of other countries. While this along with the $130 billion in cash that Apple has on its balance sheet exiting the December quarter, bode well for the long-term as well as its burgeoning efforts in healthcare and streaming entertainment, Apple shares came under pressure last night and today.


Odds are there will more negative earnings report to come

In light of the widespread holding of Apple shares across investor portfolios, both institutional and individual, as well as its percentage in the major market indices, we’re in for some renewed market pressure. There is also the reality that Apple’s decision to call out the impact of U.S.-China trade will create a major ripple effect that will lead to investors’ renewed focus on the potential trade-related downside to many companies and on the negative effect of China’s slowing economy.

In recent months we’ve heard other companies ranging from General Motors (GM) to FedEx (FDX) express concerns over the trade impact, but Apple’s clearly calling out its impact will have reverberations on companies that serve markets tied to both the smartphone and China-related demand. Overnight we saw key smartphone suppliers ranging from Skyworks Solutions (SWKS) and Qorvo (QRVO) come under pressure, and the same can be said for luxury goods companies as well. We’d note that Skyworks and Qorvo are key customers for Select List resident AXT Inc (AXTI, which means if we follow the Apple revenue cut through the supply chain, it will land on AXT and its substrate business.

All of the issues discussed above more than likely mean Apple will not be the only company to issues conservative guidance. Buckle up, it’s going to be a volatile few weeks ahead.


Positives to watch for in the coming weeks and months

While the near-term earnings season will likely mean additional pain, there are drivers that could lift shares higher from current levels in the coming months. These include a trade deal with China that has boasts a headline win for the US, but more importantly contains positive progress on key issues such as R&D technology theft, cybercrimes and the like – in other words, some of the meaty issues. There is also the Federal Reserve and expected monetary policy path that currently calls for two rate hikes this year. If the Fed is data dependent, then it likely knows of the negative wealth effect to be had following the drop in the stock market over the last few months.

Per Moody’s economist Mark Zandi, if stocks remained where there were as of last night’s close, it would equate to a $6 trillion drop in household wealth over the last 12-15 months. Per Zani, that would trim roughly 0.5% to 2019 GDP – again if the stock market stayed at last night’s close for the coming weeks and months. As we’re seeing today, and given my comments about the upcoming earnings season, odds are that 2019 GDP cut will be somewhat larger. That would likely be an impetus for the Fed to “slow its roll” on interest rates or at least offer dovish comments when discussing the economy.

Complicating matters is the current government shutdown, which has both the Census Bureau and Bureau of Economic Analysis closed. Even though there will be some data to be had, such as tomorrow’s December 2018 Employment Report from the Labor Department, it means the usual steady flow of economic data will not be had until the government re-opens. No data makes it rather difficult to judge the speed of the economy from all of us, including the Fed.

Given all of the above, we’ll continue to keep our more defensive positions companies like McCormick & Co. (MKC), Costco Wholesale (COST), and the ProShares Short S&P 500 shares intact. We’ll continue to watch input costs and what they mean for corporate profits at the margin – case in point is Del Frisco’s (DFRG), which is benefitting from not only falling protein costs but has been approached by an activist investor that could put the company in play. With Apple, Dycom Industries (DY), and AXT, we will see 5G networks lit this year here in the US, which will soon be followed by other such networks across the globe in the coming years. Samsung, Lenovo/Motorola and others have announced 5G smartphones will be shipping by mid-2019, and we expect Apple to once again ride that tipping point in 2020. That along with its growing Services business and other efforts to increase the stickiness of iPhone (medical, health, streaming, payments services), keeps us long-term bulls on AAPL shares.

When not if but when, the stock market finds its footing, which likely won’t be until after the December quarter earnings season at the soonest, we will look to strategically scale into a number of positions for the Thematic Leaders and the Select List.


TRADE ALERT: Freight pain leads to this Economic Acceleration/Deceleration addition

TRADE ALERT: Freight pain leads to this Economic Acceleration/Deceleration addition


KEY POINTS FROM THIS ALERT:

  • We are issuing a Buy on truck company Paccar (PCAR) with an $85 price target as part of our Economic Acceleration/Deceleration investment theme.

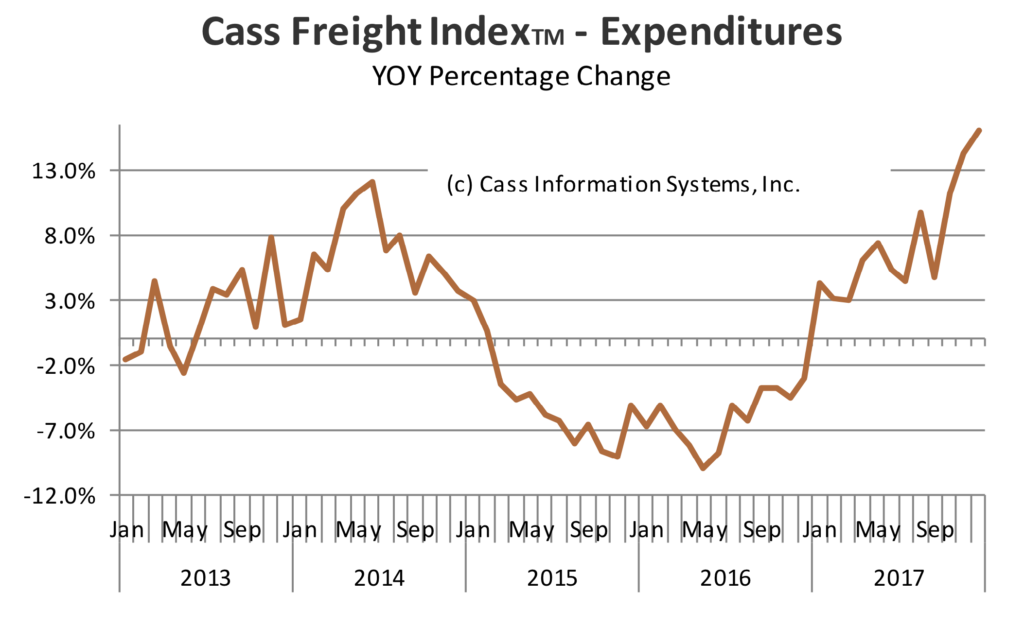
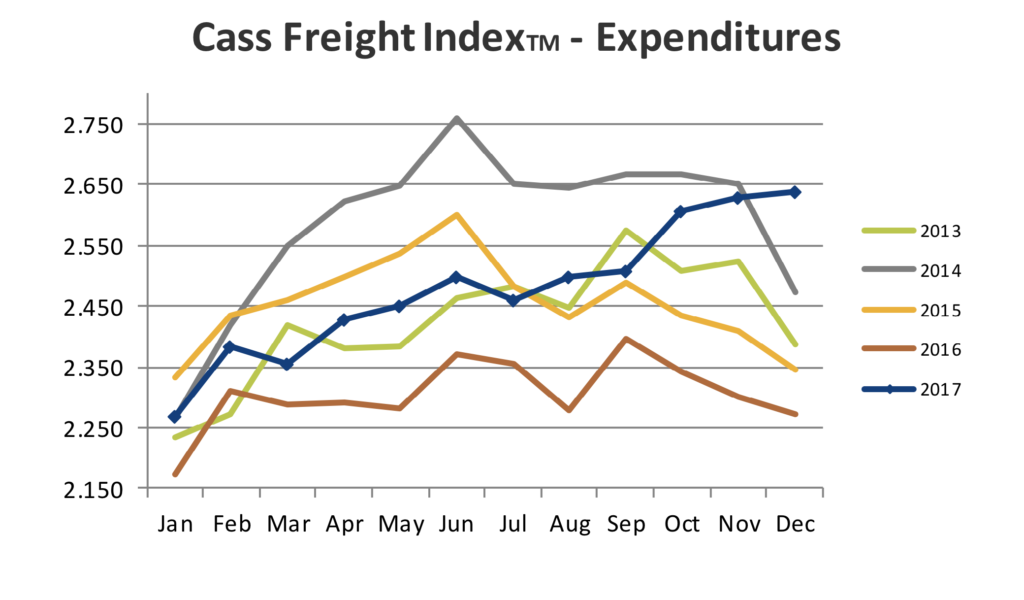
With the market’s volatility over the last several days, a number of stocks are revisiting levels that are 5%, 10%, 15% lower than they stood at end of January. And while investors have been thunderstruck by the market gyrations, the day to day data from the December quarter earnings season as well as recent economic data, has continued to confirm certain opportunities. One of the recurring drum beats this earnings season has been companies ranging from Tyson Foods (TSN, Hershey (HSY), Packaging Corp. of America (PKG), Sysco (SYY) and J.M. Smucker (SJM) to Tractor Supply (TSCO) and Prestige Brands (PBH) talking about rising freight costs and the impact on earnings.

One of the culprits is the national shortage in available trucks, which has sent shipping costs soaring, with retailers and manufacturers in some cases paying over 30% above typical rates to book last-minute transportation for cargo. This, of course, goes hand in hand with the accelerating shift toward digital commerce that we talk about, a shift that led Amazon to correctly assess back in 2013 that as more shoppers bought products online, “parcel volume was growing too rapidly for existing carriers to handle.” As that shift to digital commerce has happened, we’ve seen that forward-looking view come to play out, and odds are it’s only going to get worse. According to Statista, e-commerce sales accounted for 9.1% of total U.S. retail sales in 3Q 2017, but we see that only growing further. In South Korea, e-commerce represented 18% of all retail sales in 2016 with forecasts calling for that percentage to reach 31% by 2021. We may not reach such a level for years to come, but each percentage point that e-commerce gains, means more product that needs to be shipped from a warehouse to the buyer.

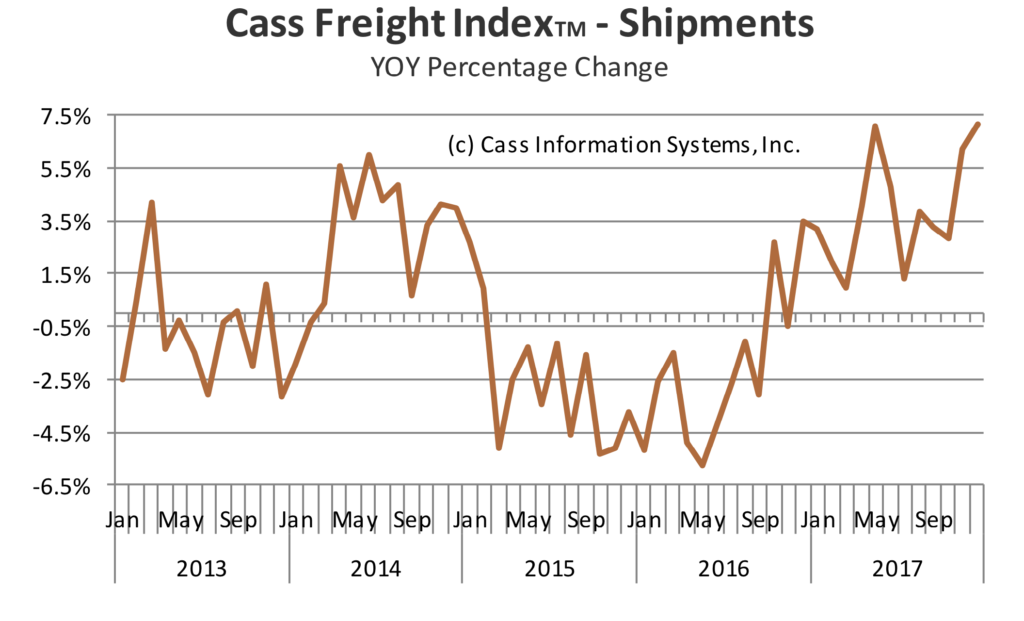
Historically, the trucking industry has been associated with the economic cycle. When the economy is growing, more goods (parts, subassemblies, products) need to be shipped to customers at factories, distribution sites, warehouses and so on. According to the American Trucking Association, the trucking industry accounts for 70.6% of tonnage carried by all modes of domestic freight transportation, including manufactured and retail goods. This has made freight traffic a good barometer of the economy, and the December year over year increase of 7.2% in the Cass Shipments Index capped off a year in which the ATA’s truck tonnage index rose 3.7%, the strongest annual gain since 2013.


As truck tonnage climbed in late 2016 and 2017, industry capacity has been tightening after tepid tonnage in most of 2015 and the first half of 2016 leading to the robust jump in freight costs we described above. This data point from DAT Solutions puts in all into perspective – “there were about 10 loads waiting to be moved for every available truck in the week ending Jan. 20, compared with three in the same week last year…”


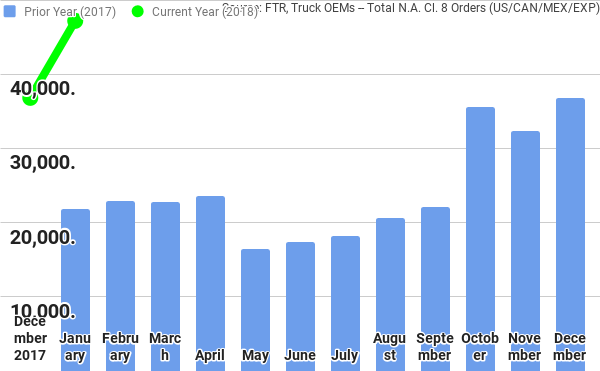
As freight costs climbed in the back half of 2017, so too did heavy truck orders, which have continued to climb into 2018. According to ACT Research, December 2017, which saw a 76% increase in truck order volume was the best month for orders since December 2014. In full, due to the year-end surge, 2017 saw truck orders hit 290,000 units, up 60% year over year. That strength continued into January with monthly truck orders hitting some 47,000 units, the highest level since 2006.


This data is not surprising, given that for the first three weeks of January, national average spot truckload rates were higher than during the peak season in 2017, according to DAT. January was also the fourth consecutive month in which truck orders were above the 30,000 mark. Initial heavy truck forecasts put orders near 300,000 for 2018, however tight industry capacity combined with companies that are benefitting from tax reform and looking to replace older, less fuel-efficient trucks, we could see that some lift to that forecast in the coming months.

But that’s heavy truck orders, and while four months above 30,000 paves the way for a pick-up in business, the real question to focus on is heavy truck retail sales. Heavy truck, otherwise known in the industry as class 8 trucks, industry retail sales were 218,000 units in 2017, compared to 216,000 vehicles sold in 2016, with forecasts calling for 235,000-265,000 trucks to be sold in the U.S. and Canada during 2018.

Looking outside the U.S. and Canada, the data shows an improving European economy and that should give way to a favorable truck market there as well. European truck industry sales above 16-tonnes were a robust 306,000 trucks in 2017, and It is estimated that European truck industry sales in that category will be in the range of 290,000 to 320,000 trucks in 2018.


Paccar – more than a leading heavy truck company

And that brings us to Paccar (PCAR), whose shares have fallen some 15% as the domestic stock market moved sharply lower over the last two weeks. The company is an assembler of heavy-duty trucks, with an estimated market share near 31% in the U.S. and Canada, as well as medium duty trucks (think the kind you see being driven locally by United Parcel Services (UPS) and FedEx (FDX)). That business drove 53% of its truck deliveries in 2017, with the balance coming from Europe (36%) and other markets (11%). As truck retail sales improve in the U.S., Canada and Europe, even absent additional share gains, Paccar’s truck business in terms of revenues and profits should see a nice lift.

The improving truck market also bodes well for Paccar’s high margin truck financing business – while it generated just 6.5% of total revenue in 2017 with operating margins that are more than double the truck business, it accounted for 12% of overall operating profits.

The third leg to the Paccar stool is its Parts business (20% of 2017 revenue, 28% of 2017 operating profit), which stands to benefit from the time lag between truck orders and sales in a capacity constrained industry, where up-time for existing equipment will be crucial.

Given the industry dynamics and Paccar’s position, we are seeing revenue and earnings expectations move higher in recent weeks, with the current consensus calling for EPS of $5.34 this year up from $4.26 in 2017 on a 13% revenue increase to $20.6 billion. With the company only recently sharing its 2018 tax rate will be 23%-25% vs. 31% in 2017, we could see the 2018 consensus move higher in the coming weeks.

As mentioned above, Paccar’s share price has fallen some 15% in the last two weeks, which in our view makes the shares rather compelling given our $85 price target. That target equates to just under 16x 2018 EPS. Over the prior seven years, PCAR shares have bottomed at an average P/E of 12.2x, which derives a downside target of $67.65 based on current 2018 EPS expectations. On the upside, the average peak multiple over those same years of just over 17x hints at a potential price target near $95. Looking at a dividend yield valuation, we see upside vs. downside of $82 vs. $60.

As we add the shares, we’ll split the difference with an $85 price target, and we’ll look to aggressively scale into the shares should the market come under further pressure and drag PCAR shares closer to $60. In terms of sign posts to watch for the shares in the coming days and weeks, monthly heavy truck data as well as tonnage stats and manufacturing industrial production data is what we’ll be watching. As the current earnings season winds on, we’ll be focusing on the results and outlook from Rush Enterprises (RUSHA), which owns the largest network of commercial dealerships in the U.S., with more than 100 dealerships in 21 states.


The bottom line for this alert today:

  • On Monday morning we are adding Paccar (PCAR) shares to the Tematica Investing Select List.
  • Our price target for PCAR shares is $85, nearly 26% above where the shares closed on Friday February 9.
  • At this time we are not setting a protective stop loss, but instead will look to scale further into the shares should further pressure drag them closer to $60 per share. 


The Expanding Pain Point Fueling Safety and Security Investment Theme

The Expanding Pain Point Fueling Safety and Security Investment Theme

Over the last few weeks, we’ve been reminded of the dark side of our increasingly Connected Society, given cyber attacks and hacks at Equifax (EFX) and more recently Amazon’s (AMZN) Whole Foods and Sonic Corp. (SONC). Those are but a handful of examples in what is an expanding pain point that is fueling our Safety & Security investing theme and the ETFMG Prime Cyber Security ETF (HACK)* shares on the Tematica Investing Select List.

Unsurprisingly to us, there is yet another new report that not only paints a gloomier picture but also forecasts a continued ramp in cyber attacks. We see this as confirming our $35 price target on HACK shares over the coming quarters. New research by Gemalto showed that almost 2 billion data records around the world were lost or stolen by cyber attacks in the first half of 2017. Worse yet, the number of breaches is slated to rise further. Per the latest Gemalto breach level index report, there were 918 breaches during the first six months of 2017, and of those breaches, 500 had an unknown number of compromised records. Meanwhile, the top 22 breaches involved more than one million compromised records.

With new regulations such as the U.K. data protection bill, the European Union’s General Data Protection Regulation and Australia’s Privacy Amendment (Notifiable Data Breaches) Act set to come into force in the coming months and quarters, odds are we will see another step up in the number of reported security breaches. No wonder in its latest annual results, consulting firm Deloitte described cybersecurity as a “high growth area” for the firm.

A somewhat different view on this was had with FedEx’s (FDX) recent earnings report, in which it copped to the fact that cyberattack Petya cost the company around $300 million dollars. This should serve as a reminder the impact of a cyber attack can cost a company day to day, but it also has implications for its stock price when it misses earnings expectations.

We see all of the above as a reminder of the incremental spending to be had to fend and secure companies from prospective cyberattacks, a good thing for the companies contained inside the HACK ETF.

  • Our price target on Safety & Security investing position in the ETFMG Prime Cyber Security ETF (HACK) remains $35.


* One quick housekeeping item, there was a recent name change for HACK shares to ETFMG Prime Cyber Security ETF from PureFunds. The underlying strategy of the ETF and its focus on cybersecurity stocks remains intact.