WEEKLY ISSUE: Confirming Data Points for Apple and Universal Display

WEEKLY ISSUE: Confirming Data Points for Apple and Universal Display

Key points inside this issue:

  • The Business Roundtable and recent data suggest trade worries are growing.
  • Our price target on Costco Wholesale (COST) shares remains $250.
  • Our price target on Apple (AAPL) and Universal Display (OLED) shares remain $225 and $150, respectively.
  • Changes afoot at S&P, but they still lag our thematic investing approach


While investors and the stock market have largely shaken off concerns of a trade war thus far, this week the stakes moved higher. The U.S. initiated the second leg of its tariffs on China, slapping on $200 billion of tariffs on Chinese imports of food ingredients, auto parts, art, chemicals, paper products, apparel, refrigerators, air conditioners, toys, furniture, handbags, and electronics.

China responded, not only by canceling expected trade talks, but by also implementing tariffs of its own to the tune of $60 billion on U.S. exports to China. Those tariffs include medium-sized aircraft, metals, tires, golf clubs, crude oil and liquified natural gas (LNG). Factoring in those latest steps, there are tariffs on nearly half of all U.S. imports from China and over 50% of U.S. export to China.

Should President Trump take the next stated step and put tariffs on an additional $267 billion of products, it would basically cover all U.S. imports from China. In terms of timing, let’s remember that we have the U.S. mid-term elections coming up before too long — and one risk we see here at Tematica is China holding off trade talks until after those elections.

On Monday, the latest Business Roundtable survey found that two-thirds of chief executives believed recent tariffs and future trade tension would have a negative impact on their capital investment decisions over the next six months. Roughly one-third expected no impact on their business, while only 2% forecast a positive effect.

That news echoed the recent September Flash U.S. PMI reading from IHS Markit, which included the following commentary:

“The escalation of trade wars, and the accompanying rise in prices, contributed to a darkening of the outlook, with business expectations for the year ahead dropping sharply during the month. While business activity may rebound after the storms, the drop in optimism suggests the longer term outlook has deteriorated, at least in the sense that growth may have peaked.”

Also found in the IHS Markit report:

“Manufacturers widely noted that trade tariffs had led to higher prices for metals and encouraged the forward purchasing of materials… Future expectations meanwhile fell to the lowest so far in 2018, and the second-lowest in over two years, as optimism deteriorated in both the manufacturing and service sectors.”

As if those growing worries weren’t enough, there has been a continued rise in oil prices as OPEC ruled out any immediate increase in production, the latest round of political intrigue inside the Washington Beltway, the growing spending struggle for the coming Italian government budget and Brexit.

Any of these on their own could lead to a reversal in the CNN Money Fear & Greed Index, which has been hanging out in “Greed” territory for the better part of the last month. Taken together, though, it could lead companies to be conservative in terms of guidance in the soon-to-arrive September quarter earnings season, despite the benefits of tax reform on their businesses and on consumer wallets. In other words, these mounting headwinds could weigh on stocks and lead investors to question growth expectations for the fourth quarter.

What’s more, even though S&P 500 EPS expectations still call for 22% EPS growth in 2018 vs. 2017, we’ve started to see some downward revisions in projections for the September and December quarters, which have softened 2018 EPS estimates to $162.01, down from $162.60 several weeks ago. Not a huge drop, but when looking at the current stock market valuation of 18x expected 2018 EPS, remember those expectations hinge on the S&P 500 group of companies growing their EPS more than 21% year over year in the second half of 2018.


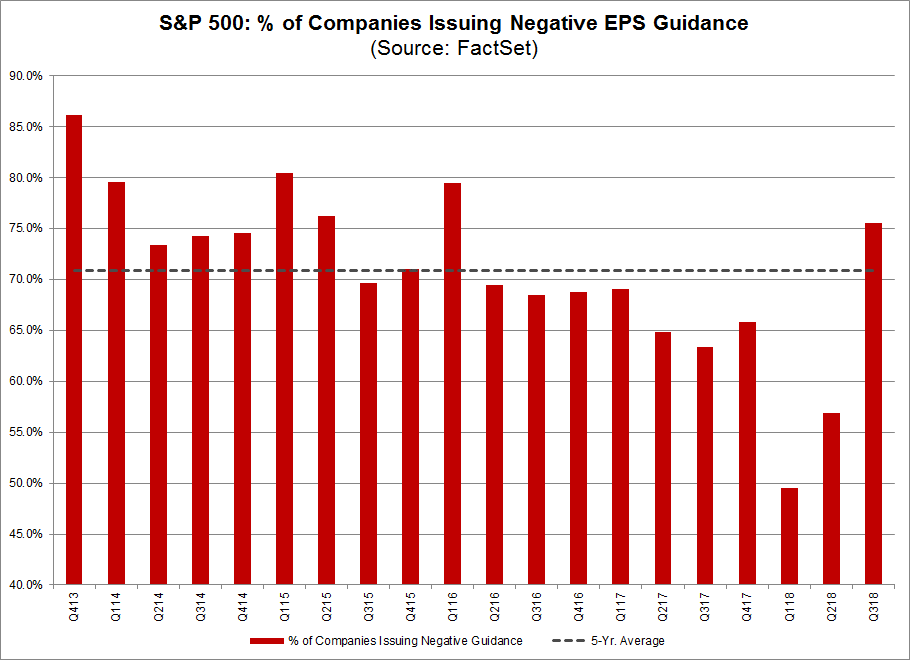
Any and all of the above factors could weigh on corporate guidance or just rattle investor’s nerves and likely means a bumpy ride over the ensuing weeks as trade and political headlines heat up. As it stands right now, according to data tabulated from FactSet, heading into September quarter earnings, 74 of 98 companies in the S&P 500 that issued guidance, issued negative guidance marking the highest percentage (76%) since 1Q 2016 and compares to the five year average of 71%.

Not alarmingly high, but still higher than the norm, which means I’ll be paying even closer than usual attention to what is said over the coming weeks ahead of the “official” start to September quarter earnings that is Alcoa’s (AA) results on Oct. 17 and what it means for both the Thematic Leaders and the other positions on the Select List.


Today is Fed Day

This afternoon the Fed’s FOMC will break from its September meeting, and it is widely expected to boost interest rates. No surprise there, but given what we’ve seen on the trade front and in hard economic data of late, my attention will be on what is said during the post-meeting press conference and what’s contained in the Fed’s updated economic forecast. The big risk I see in the coming months on the Fed front is should the escalating tariff situation lead to a pick-up in inflation, the Fed could feel it is behind the interest rate hike curve leading to not only a more hawkish tone but a quicker pace of rate hikes than is currently expected.

We here at Tematica have talked quite a bit over consumer debt levels and the recent climb in both oil and gas prices is likely putting some extra squeeze on consumers, especially those that fall into our Middle-Class Squeeze investing theme. Any pick up in Fed rate hikes means higher interest costs for consumers, taking a bigger bite out of disposable income, which means a step up in their effort to stretch spending dollars. Despite its recent sell-off, I continue to see Costco Wholesale (COST) as extremely well positioned to grab more share of those cash-strapped wallets, particularly as it continues to open new warehouse locations.

  • Our price target on Costco Wholesale (COST) shares remains $250.


Favorable Apple and Universal Display News

Outside of those positions, we’d note some favorable news for our Apple (AAPL) shares in the last 24 hours. First, the iPhone XS Max OLED display has reclaimed the “Best Smartphone Display” crown for Apple, which in our view augurs well for other smartphone vendors adopting the technology. This is also a good thing for our Universal Display (OLED) shares as organic light emitting diode displays are present in two-thirds of the new iPhone offerings. In addition to Apple and other smartphone vendors adopting the technology, we are also seeing more TV models adoption it as well. We are also starting to see ultra high-end cars include the technology, which means we are at the beginning of a long adoption road into the automotive lighting market. We see this confirming Universal’s view that demand for the technology and its chemicals bottomed during the June quarter. As a reminder, that view includes 2018 revenue guidance of $280 million-$310 million vs. the $99.7 million recorded in the first half of the year.

Second, Apple has partnered with Salesforce (CRM) as part of the latest step in Apple’s move to leverage the iPhone and iPad in the enterprise market. Other partners for this strategy include IBM (IBM), Cisco Systems (CSCO), Accenture (ACN) CDW Corp. (CDW) and Deloitte. I see this as Apple continuing to chip away at the enterprise market, one that it historically has had limited exposure.

  • Our price target on Apple (AAPL) and Universal Display (OLED) shares remain $225 and $150, respectively.


Changes afoot at S&P, but they still lag our thematic investing approach

Before we close out this week’s issue, I wanted to address something big that is happening in markets that I suspect most individuals have not focused on. This week, S&P will roll out the largest revision to its Global Industry Classification Standard (GICS) since 1999. Before we dismiss it as yet another piece of Wall Street lingo, it’s important to know that GICS is widely used by portfolio managers and investors to classify companies across 11 sectors. With the inclusion of a new category – Communication Services – it means big changes that can alter an investor’s holdings in a mutual fund or ETF that tracks one of several indices. That shifting of trillions of dollars makes it a pretty big deal on a number of fronts, but it also confirms the shortcomings associated with sector-based investing that we here at Tematica have been calling out for quite some time.

The new GICS category, Communications Services, will replace the Telecom Sector category and include companies that are seen as providing platforms for communication. It will also include companies in the Consumer Discretionary Sector that have been classified in the Media and Internet & Direct Marketing Retail subindustries and some companies from the Information Technology sector. According to S&P, 16 Consumer Discretionary stocks (22% of the sector) will be reclassified as Communications Services as will 7 Information Technology stocks (20% of that sector) as will AT&T (T), Verizon (VZ) and CenturyLink (CTL). Other companies that are folded in include Apple (AAPL), Google (GOOGL), Disney (DIS), Twitter (TWTR), Snap (SNAP), Netflix (NFLX), Comcast (CMCSA), and DISH Network (DISH) among others.

After these maneuverings are complete, it’s estimated Communication services will be the largest category in the S&P 500 at around 10% of the index leaving weightings for the other 11 sectors in a very different place compared to their history. In other words, some 50 companies are moving into this category and out of others. That will have meaningful implications for mutual funds and ETFs that track these various index components and could lead to some extra volatility as investors and management companies make their adjustments. For example, the Technology Select Sector SPDR ETF (XLK), which tracks the S&P Technology Select Sector Index, contained 10 companies among its 74 holdings that are being rechristened as part of Communications Services. It so happens that XLK is one of the two largest sector funds by assets under management – the other one is the Consumer Discretionary Select Sector SPDR Fund (XLY), which had exposure to 16 companies that are moving into Communications Services.

So what are these moves really trying to accomplish?

The simple answer is they taking an out-of-date classification system of 11 sectors – and are attempting to make them more relevant to changes and developments that have occurred over the last 20 years. For example:

  • Was Apple a smartphone company 20 years ago? No.
  • Did Netflix exist 20 years ago? No.
  • Did Amazon have Amazon Prime Video let alone Amazon Prime 20 year ago? No.
  • Was Facebook around back then? Nope. Should it have been in Consumer Discretionary, to begin with alongside McDonald’s (MCD) and Ralph Lauren (RL)? Certainly not.
  • Did Verizon even consider owning Yahoo or AOL in 1999? Probably not.


What we’ve seen with these companies and others has been a morphing of their business models as the various economic, technological, psychographic, demographic and other landscapes around them have changed. It’s what they should be doing, and is the basis for our thematic investment approach — the strong companies will adapt to these evolving tailwinds, while others will sadly fall by the wayside.

These changes, however, expose the shortcomings of sector-based investing. Simply viewing the market through a sector lens fails to capture the real world tailwinds and catalysts that are driving structural changes inside industries, forcing companies to adapt. That’s far better captured in thematic investing, which focuses on those changing landscapes and the tailwinds as well as headwinds that arise and are driving not just sales but operating profit inside of companies.

For example, under the new schema, Microsoft (MSFT) will be in the Communications Services category, but the vast majority of its sales and profits are derived from Office. While Disney owns ESPN and is embarking on its own streaming services, both are far from generating the lion’s share of sales and profits. This likely means their movement into Communications Services is cosmetic in nature and could be premature. This echoes recent concern over the recent changes in the S&P 500 and S&P 100 indices, which have been criticized as S&P trying to make them more relevant than actually reflecting their stated investment strategy. For the S&P 500 that is being a market-capitalization-weighted index of the 500 largest U.S. publicly traded companies by market value.

As much as we could find fault with the changes, we can’t help it if those institutions, at their core, stick to their outdated thinking. As I have said before about other companies, change is difficult and takes time. And to be fair, for what they do, S&P is good at it, which is why we use them to calculate the NJCU New Jersey 50 Index as part of my work New Jersey City University.

Is this reclassification to update GICS and corresponding indices a step in the right direction?

It is, but it is more like a half step or even a quarter step. There is far more work to be done to make GICS as relevant as it needs to be, not just in today’s world, but the one we are moving into. For that, I’ll continue to stick with our thematic lens-based approach.


Forget ADAU with Facebook, it’s all about ARPU

Forget ADAU with Facebook, it’s all about ARPU


Last night Connected Society investment theme and social media platform company Facebook (FB) reported December quarter results that simply smashed expectations on a number of fronts. Of course, the market responded by trading the shares down roughly 5% in the aftermarket. Why? Well on the earnings call the management team talked changes that would impact time spent on Facebook — at least in the near term — as they focus more on “connecting people” and “healthy interaction” than the amount of time people spend on Facebook.

I see this announced strategy as part of the company’s response to criticism in the second half of 2017 over “fake news” and populist backlash, as well as part of its strategy to lure back users, particularly in the US and Canada where it reported a drop in daily active users for the first time. These changes led to a 5% reduction in average user time spent on Facebook in the December quarter and that revelation in the earnings press release sent FB shares lower in aftermarket trading last night.

Then came the earnings conference call, where the above pivot in strategy was reiterated, but Zuckerberg and crew also shared that ad impressions continue to grow and more importantly advertising pricing on the company’s platforms continues to climb. Also, on the call Facebook once again guided for a large uptick in spending, something we’ve heard several times before and yet it never seems to get in the way of Facebook meeting or beating bottom-line expectations.

As a reminder, the company is more than just the Facebook app and website and looking at the metrics across the company’s various social media platforms we are reminded of its growing presence in the advertising market. At Facebook proper, even though average daily active users (ADAU) dipping sequentially by 1 million to 184 million in the US and Canada in the December quarter, solid growth for that metric was had in Asia-Pacific and Rest of the World. Baked into the geographic figures are the 300 million daily average users at Facebook-owned Instagram vs. 178 million at Snap (SNAP) and 1.5 billion monthly active users at WhatsApp. As I look at those growth figures, I am rather nonplussed about the modest dip in Facebook average daily users.

Despite the dip in the US and Canada, revenue for the geography rose 27% quarter over quarter, which in our view solidifies the argument that growing advertising volume and pricing will more than offset short-term disruptions in average daily active users and usage. Outside of the US and Canada, Facebook continues to make solid progress in monetizing other geographies, with solid gains in Europe (31% quarter over quarter) as well as Asia-Pacific and Rest of World.

I see all of this reflected in Facebook’s overall average revenue per user (ARPU) that rose 22% sequentially (28% year over year) to $6.18. As Facebook looks to further monetize its various platforms, we continue to see further revenue and earnings growth ahead as advertisers look to be seen by buyers. As these platforms embrace video as part of our Content is King investing theme, we suspect Facebook will be a key beneficiary from the shift away from TV advertising and we are only in the early innings of that. In other words, the company remains well positioned as a Connected Society company.

  • Our price target on Facebook (FB) shares remains $225.

Businesses flock to Instagram

The adoption of social media by companies to reach customers, share its wares, drive revenues and build its brands continues. Amid the battle between Facebook and LinkedIn, we are seeing businesses embrace Instagram, in some cases as its only web presence, to reach customers. Even as we peruse Instagram, we are seeing more companies have profiles as well as advertise. The visual nature of the platform, in our view, gives it a hefty leg up over Twitter and because the images “last” we say the same holds compared to Snap. Instagram is also a mobile-first platform, which means its appealing to smartphone users, the fastest growing category for digital commerce so far this holiday season. How long until the Facebook bears begin to wonder if Instagram’s success will eat into demand for Facebook?

Instagram announced this morning that it now has 25 million active business profiles, up from 15 million in July.

Instagram also says that more than 80 percent of Instagram accounts follow a business, with 200 million users visiting a business profile every day.

The growth is impressive since Instagram only launched these business profiles — which allow for more functionality in the profile itself, as well as access to additional analytics — about a year and a half ago.

Vishal Shah, director of product for Instagram Business, said that nearly 50 percent of business profiles don’t link to an outside website, suggesting that they see Instagram as their primary or sole online presence.

Businesses need to be smart about what they post to the feed and in their Instagram Stories, but the distribution strategy goes beyond that, to things like search and hashtags.

In fact, Instagram says that two-thirds of visits to business profiles come from users who don’t follow that profile. And one of the ways that Shah wants to grow the business product is by providing more detail about where visitors come from and what they do “downstream,” during or after that visit.

Source: There are now 25M active business profiles on Instagram | TechCrunch

Post IPO Thoughts on Snap Shares and the $34.7 Billion Market Cap Question

Post IPO Thoughts on Snap Shares and the $34.7 Billion Market Cap Question

Last Thursday, March 2, shares of Snapchat parent Snap Inc. (SNAP) went public at $17, well above the $14-$16 initial public offering range. The shares hit a high of $29.44 on Friday morning before closing the week out at $27.09. That quick gain of just under 60 percent was great for investors that were involved with the IPO, but it wasn’t quite the same for investors that entered into SNAP shares after the shares started trading on Thursday morning.

With SNAP shares now trading in the secondary market and the buildup of the IPO now behind us, the question to us is are SNAP shares really worth the current $34.7 billion in market capitalization? At that market valuation, the shares are trading at about 37 times EMarketer’s estimate for Snap’s 2017 advertising sales. As spelled to out in the S-1 filing, Snap’s Snapchat is free and the company generates revenue “primarily through advertising,” the same was true of Facebook (FB) and Twitter (TWTR).

Actually, that’s not THE question, but rather one of the key questions as we contemplate if there is enough upside to be had in SNAP shares from current levels to warrant a Buy rating? Odds are the IPO underwriters, which include Morgan Stanley (MS), Goldman Sachs (GS), JPMorgan Chase (JPM), and Deutsche Bank (DB), that made a reported $85 million in fees from the transaction, will have some favorable research comments on SNAP shares in the coming weeks.

While SNAP shares fit within the confines of our Connected Society investing theme and are likely to benefit from the shift in advertising dollars to digital and social media platforms like Facebook and Alphabet’s (GOOGL) Google and YouTube, our charge is to question using our thematic 20/20 foresight to see if enough upside in the shares exists to warrant placing them on the Tematica Select List?

Boiling this down, it all comes down to growth

The question when looking at Snap is, “Can it grow its revenue fast enough and deliver positive earnings per share so we can see at least 20 percent upside in the shares?”

Well, right off the bat the company’s user base of 158 million active daily users was relatively flat in the December quarter and grew just 7 percent between 2Q 2016 and 3Q 2016.  Assuming the company is able to continue to grow its user base, something that has eluded Twitter for the most part, it will still need to capture a disproportionate amount of the mobile advertising market to hit Goldman Sach’s forest that calls for Snap to increase its revenue fivefold by 2018.

Snap recorded $404.5 million in revenue last year, up from $58.7 million in 2015, so a fivefold increase would put 2018 revenue at more than $2 billion. IDC projects that mobile advertising spend will grow nearly 3x from $66 billion in 2016 to $196 billion in 2020, while non-mobile advertising spend will decrease by approximately $15 billion during the same time period.

While a fivefold increase in revenue catches our investing ears, we have to question Snap’s ability to garner such an outsized piece of the mobile advertising market when going head to head with Facebook and its several platforms, Google, Twitter and others. The argument that a rising tide will lift all boats will only go so far when all of those boats are vying for the same position in the monetization river.

There are other reasons to be skeptical, including users migrating to newer social media platforms or ones that have been updated like Facebook’s Instagram that launched Stories to better compete with Snapchat. Snap called this out as a competitive concern in its S-1 filing — “For example, Instagram, a subsidiary of Facebook, recently introduced a “stories” feature that largely mimics our Stories feature and may be directly competitive.” With good reason, because as Instagram Stories reached 150 million daily users in the back half of 2016, Snapchat’s growth in average daily user count slowed substantially. Part of that could be due to Snap’s reliance on the teen demographic, which even the company has noted is not “brand loyal.” We’re not sure anyone has figured out how to model teen fickleness in multi-year revenue forecasts.


Making things a tad more complicated is the recent push back on digital advertising by Proctor & Gamble’s (PG) Chief Marketer Marc Pritchard, who publicly expressed his misgivings with today’s digital media practices and, “called on the media buying and selling industry to become transparent in the face of ‘crappy advertising accompanied by even crappier viewing experiences.'” As Pritchard made those and other comments, a survey from the World Federation of Advertisers showed that large brands are reviewing contracts related to almost $3 billion of advertising spend on programmatic advertising, which automates digital ad placement. The question to be answered is whether ads are actually seen and this has led to a call for companies like Snap to follow Facebook, YouTube and have Snapchat’s ad metrics audited by the Media Rating Council.


One other wrinkle in the Snap investing story is the company has yet to turn a profit.

In 2016, while Snap’s revenue was just over $400 million, it managed to generate a loss off $514.6 million and per the S-1 it will need to spend a significant amount to attract new users and fend off competition. In reading that, the concern is user growth could be far slower — and expensive — than analysts are forecasting, which would impact advertising revenue growth like we’ve seen at Twitter. The thing is, new user growth for Snapchat already slowed in the back half of 2016 as newer messaging apps like Charge, Confide and Whisper have come to market.

When Snap finally does turn a profit, we could see the outsized P/E ratio lead value and growth at a reasonable price (GARP) investors to balk at buying the shares, which means Snap will be relying on growth investors. It amazes us how some investors love companies even though they are not generating positive net income, but balk at P/E ratio that is too high the minute they start to generate positive albeit rather small earnings per share. We get around that problem by using a multi-pronged valuation approach to determine upside and downside price targets.


Is Snap the Next GoPro?

While all those numbers and forecasts are important to one’s investment decision making process (we make that point clear in Cocktail Investing: Distilling Everyday Noise into Clear Investment Signals for Better Returns), we have a more primal issue with Snap. Back in late 2015, we shared our view that GoPro (GPRO) was really a feature, not a product. As we said at the time, we saw Yelp (YELP), Angie’s List (ANGI), Groupon (GRPN) and others as features that over time will be incorporated into other products — like Facebook’s Professional Services, those at Amazon (AMZN) or others from Alphabet’s Google, much the way point-and-shoot cameras were overtaken by camera-enabled smartphones and personal information management functions were first incorporated into mobile phones and later smartphones, obviating the need for the original Palm Pilot and other pocket organizers.

When GoPro shares debuted in June 2014, they were a strong performer over the following months until they peaked near $87, but 15 months after going public GPRO shares fell through the IPO price and have remained underwater ever since.

What happened?

We recall hearing plans for a video network of user channels at GoPro as well as the management team touting the company as an “end to end storytelling solution,” but over the last few quarters, we’ve heard far more about new product issues, layoffs, facility closures and falling unit sales.  In 2016, GoPro saw camera unit sell-through fall 12 percent year-over-year to 5.3 million units from approximately 6 million units in 2015.

In our view, what happened can be summed up rather easily — GoPro was and is a feature, not a standalone product. It just took the stock market some time to figure it out once the IPO blitz and glory subsided. While we could be wrong, we have a strong suspicion that Snap is more likely to resemble GoPro than Facebook, which is monetizing multiple platforms as it extends its presence with new solutions deeper into the lives of its users and has changed the way people communicate.

As investors, we at Tematica would much rather own innovators of new products and solutions that are addressing pain points or benefitting from disruptive forces and changing economics, demographics, and psychographics in the marketplace than companies that offer features that will soon be co-opted by other companies and their products. Following that focus on 20/20 foresight, we avoided GoPro shares that fell from $19.50 in December 2015 to the recent share price of $8.84.

GoPro 2-year Share Price Performance


And then there’s this . . . 

There is another consideration which is not specific to Snap, but is rather an issue that all newly public companies must contend with — the lock-up expiration. For those unfamiliar with it, the lock-up period is a contractual restriction that prevents insiders who are holding a company’s stock, before it goes public, from selling the stock for a period usually between 90 to 180 days after the company goes public. Per Snap’s S-1, its lock-up expiration is 150 days, which puts it in 3Q 2017. Given the potential that insider selling could hit the shares, and be potentially disruptive to the share price, we tend to wait until the lock-up expiration comes and goes before putting the shares under the full Tematica telescope. This isn’t specific to Snap shares, but rather it’s one of our rules of thumb.

We have a strong suspicion that Snap is more likely to resemble GoPro than Facebook, but we’ll keep an open mind during the SNAP shares lock-up period, after all, companies are living entities that can move forward and backward depending on the market environment and leadership team. Let’s remember too that it took Facebook some time to figure out mobile.

Finally, we aren’t so thrilled that none of the 200 million shares floated came with voting rights, leaving the two founders Evan Spiegel and Robert Murphy with total control of the company. We prefer seeing more direct shareholder accountability… but hey, that’s us.