Weekly issue: Downside Protection Critical Amid These Uncertain Conditions

Weekly issue: Downside Protection Critical Amid These Uncertain Conditions

Key points inside this issue

  • Ahead of the Fed’s latest dot blot, 2019 GDP expectations move lower.
  • With uncertainties again on the rise, we reiterate our Buy rating on the ProShares Short S&P 500 ETF (SH) ahead of the upcoming March quarter earnings season.


Weakening GDP Expectations for the Remainder of 2019

Looking back over the last few weekly issues, it would be fair to say they were a little wordy. What can I say, between the economic data and earnings season, plus thematic data points, there was a lot to share over the last few weeks. Today, however, I’m going to cut to the point with my comments, largely because all investor eyes and ears are waiting to see and hear what Fed Chair Jerome Powell has to say about the speed of the US economy as they look for signs over what is coming next out of the Fed.

We’ve talked quite a bit about the slowing speed of the global economy, and even though there have been some individual bright spots across the aggregated hard and soft economic data from both government and third-party sources, the slowing speed is hard to ignore. Based on the published data, domestic GDP hit 3.1% last year, and as we’ve shared recently we’ve started to see the expectations for 2019 move lower in recent weeks. Per the March CNBC Fed Survey of 43 economists and Fed watcher findings, GDP for 2019 is now expected to clock in around 2.3% — not quite cut in half compared to 2018, but dramatically lower and significantly lower than folks were looking for in the back half of 2018.

When the Fed issues its post FOMC meeting statement today, the focus will more than likely not be on the interest rate decision – almost no one expects a hike. Instead, rapt attention will be paid to the Fed’s updated economic dot plot, which will reveal how it sees the US economy shaping up. Let’s remember that one unofficial aspect of the Fed’s job is to be a cheerleader for the economy, so it becomes a question of “if they are cutting their GDP forecast” how deep of a cut could we really see?

Culprits of the slowing economy and these cuts include aspects of our Middle-Class Squeeze investing theme as consumers in the US grapple with debt levels that have risen precipitously over the last several years. The consumer spending tailwind associated with our Living the Life investing theme appears to be slowing some given the rising debt levels of Chinese consumers. Governments have also run up debt in recent years as the current business cycle has grown longer in the tooth. And of course, there is the impact of currency as well as political and trade uncertainties, including the pushout of US-China trade talks to June.


Downside Protection is Key Under These Circumstances

In a little over 10 days, we will be exiting March, entering the second quarter and beginning the earnings season dance all over again. My concern is that given the above and the several unknowns therein, we are poised to see another earnings season during which aggregate expectations will be adjusted lower. Case in point, with the  US-China trade agreement timetable slipping and slipping, it becomes rather difficult for a company to factor any resolution into its guidance, especially when the terms of the agreement are unknown.

Despite all of the above, the domestic stock market has continued to chug higher, once again approaching overbought levels, even though 2019 EPS cuts for the S&P 500 have made the market even more expensive than it was as we exited 2018.

The potential poster child for this is FedEx (FDX), which saw its shares take a fall last night after the company cut its annual profit forecast for the second time in three months due to slowing global growth, rising costs from a 2016 acquisition in Europe and questions over its ability to withstand U.S.-China trade tensions and uncertainty over the U.K.’s exit from the European Union.

Not to go all Groundhog Day on you, but this looks increasingly like the situation we saw in December when I added the ProShares Short S&P 500 ETF (SH) to the Select List. If we didn’t have those shares to offer some downside protection for what lies ahead, I would be adding them today. If you don’t have any of those shares in your holdings, my advice would be to add some. Much like insurance, you may not know exactly when you’ll need it, but you’ll be happy to have it when something goes bad.

  • With uncertainties again on the rise, we reiterate our Buy rating on the ProShares Short S&P 500 ETF (SH) ahead of the upcoming March quarter earnings season.


Tematica’s take on the Fed’s monetary policy statement today

Tematica’s take on the Fed’s monetary policy statement today

As expected the Federal Reserve boosted interest rates by one-quarter point putting the target range for the Fed Funds rate to 1-1/2 to 1-3/4 percent. As expected the focus was the Fed’s updated economic projections, and what we saw was a step up in growth expectations this year and in 2019, a step down in the Unemployment Rate this year and next, and no major changes in the Fed’s inflation expectations. Alongside those changes, the Fed also boosted its interest rate hike expectations in 2019 and 2020, by a

Putting all of this into the Fed decoder ring, this suggests the Fed sees the economy on stronger footing than it did in December, which is interesting given the recent rollover in the Citibank Economic Surprise Index (CESI) that is offset by initial March economic data. Even the Fed noted, “Recent data suggest that growth rates of household spending and business fixed investment have moderated from their strong fourth-quarter readings.”

Stepping back and look at the changes in the Fed’s economic forecast – better growth, employment and no prick up in inflation – it seems pretty Goldilocks on its face if you ask me, but the prize goes to Lenore, who called for the Fed to be more hawkish than dovish exiting today’s FOMC meeting. We’ll see in the coming months if forecast becomes fact. As we get more economic data in the coming months, we can expect hawkish viewers to bang the 4thrate hike drum and that means we’ll be back in Fed watching Groundhog Day mode before too long.

While the Fed and the OECD are predicting a synchronized global economic acceleration in 2018, the ECRI, (which accurately forecast the 2017 acceleration) is calling for a synchronized deceleration. We suspect that too much is expected of the impact of the tax cuts and too little is being accounted for from potential trade wars and the shifts in monetary policy.

The Fed has at least 2 more rate hikes planned, which will give us a 200 bps increase in total, the consequence of which will only be felt with a significant lag. We are also getting a roughly 100 basis point equivalent tightening from the Fed’s tapering program, which brings us to 300 basis points of tightening. That is twice the magnitude of tightening pre-1987 market collapse, equivalent to the 1994 tightening that broke Orange County and Mexico and more than what preceded the 1998 Asian crisis and the 2001 dot-com bust.

Now for Fed Chairman Powell’s first Fed news conference…


Post IPO Thoughts on Snap Shares and the $34.7 Billion Market Cap Question

Post IPO Thoughts on Snap Shares and the $34.7 Billion Market Cap Question

Last Thursday, March 2, shares of Snapchat parent Snap Inc. (SNAP) went public at $17, well above the $14-$16 initial public offering range. The shares hit a high of $29.44 on Friday morning before closing the week out at $27.09. That quick gain of just under 60 percent was great for investors that were involved with the IPO, but it wasn’t quite the same for investors that entered into SNAP shares after the shares started trading on Thursday morning.

With SNAP shares now trading in the secondary market and the buildup of the IPO now behind us, the question to us is are SNAP shares really worth the current $34.7 billion in market capitalization? At that market valuation, the shares are trading at about 37 times EMarketer’s estimate for Snap’s 2017 advertising sales. As spelled to out in the S-1 filing, Snap’s Snapchat is free and the company generates revenue “primarily through advertising,” the same was true of Facebook (FB) and Twitter (TWTR).

Actually, that’s not THE question, but rather one of the key questions as we contemplate if there is enough upside to be had in SNAP shares from current levels to warrant a Buy rating? Odds are the IPO underwriters, which include Morgan Stanley (MS), Goldman Sachs (GS), JPMorgan Chase (JPM), and Deutsche Bank (DB), that made a reported $85 million in fees from the transaction, will have some favorable research comments on SNAP shares in the coming weeks.

While SNAP shares fit within the confines of our Connected Society investing theme and are likely to benefit from the shift in advertising dollars to digital and social media platforms like Facebook and Alphabet’s (GOOGL) Google and YouTube, our charge is to question using our thematic 20/20 foresight to see if enough upside in the shares exists to warrant placing them on the Tematica Select List?

Boiling this down, it all comes down to growth

The question when looking at Snap is, “Can it grow its revenue fast enough and deliver positive earnings per share so we can see at least 20 percent upside in the shares?”

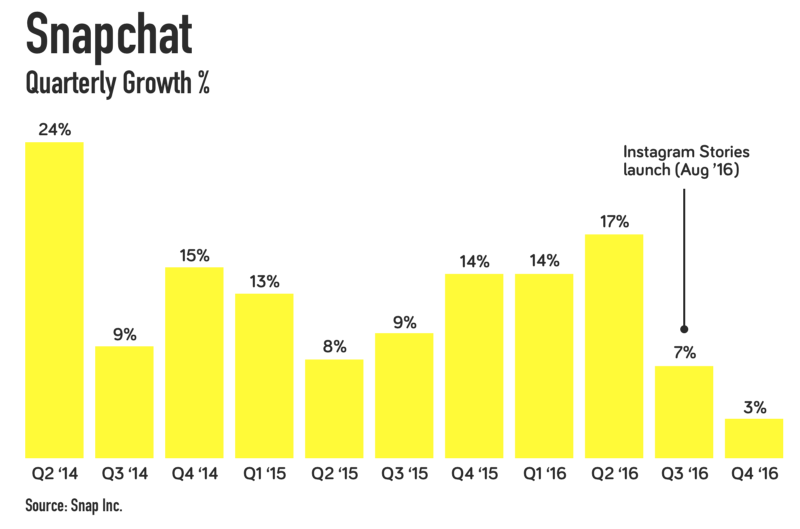
Well, right off the bat the company’s user base of 158 million active daily users was relatively flat in the December quarter and grew just 7 percent between 2Q 2016 and 3Q 2016.  Assuming the company is able to continue to grow its user base, something that has eluded Twitter for the most part, it will still need to capture a disproportionate amount of the mobile advertising market to hit Goldman Sach’s forest that calls for Snap to increase its revenue fivefold by 2018.

Snap recorded $404.5 million in revenue last year, up from $58.7 million in 2015, so a fivefold increase would put 2018 revenue at more than $2 billion. IDC projects that mobile advertising spend will grow nearly 3x from $66 billion in 2016 to $196 billion in 2020, while non-mobile advertising spend will decrease by approximately $15 billion during the same time period.

While a fivefold increase in revenue catches our investing ears, we have to question Snap’s ability to garner such an outsized piece of the mobile advertising market when going head to head with Facebook and its several platforms, Google, Twitter and others. The argument that a rising tide will lift all boats will only go so far when all of those boats are vying for the same position in the monetization river.

There are other reasons to be skeptical, including users migrating to newer social media platforms or ones that have been updated like Facebook’s Instagram that launched Stories to better compete with Snapchat. Snap called this out as a competitive concern in its S-1 filing — “For example, Instagram, a subsidiary of Facebook, recently introduced a “stories” feature that largely mimics our Stories feature and may be directly competitive.” With good reason, because as Instagram Stories reached 150 million daily users in the back half of 2016, Snapchat’s growth in average daily user count slowed substantially. Part of that could be due to Snap’s reliance on the teen demographic, which even the company has noted is not “brand loyal.” We’re not sure anyone has figured out how to model teen fickleness in multi-year revenue forecasts.
 

Making things a tad more complicated is the recent push back on digital advertising by Proctor & Gamble’s (PG) Chief Marketer Marc Pritchard, who publicly expressed his misgivings with today’s digital media practices and, “called on the media buying and selling industry to become transparent in the face of ‘crappy advertising accompanied by even crappier viewing experiences.'” As Pritchard made those and other comments, a survey from the World Federation of Advertisers showed that large brands are reviewing contracts related to almost $3 billion of advertising spend on programmatic advertising, which automates digital ad placement. The question to be answered is whether ads are actually seen and this has led to a call for companies like Snap to follow Facebook, YouTube and have Snapchat’s ad metrics audited by the Media Rating Council.


One other wrinkle in the Snap investing story is the company has yet to turn a profit.

In 2016, while Snap’s revenue was just over $400 million, it managed to generate a loss off $514.6 million and per the S-1 it will need to spend a significant amount to attract new users and fend off competition. In reading that, the concern is user growth could be far slower — and expensive — than analysts are forecasting, which would impact advertising revenue growth like we’ve seen at Twitter. The thing is, new user growth for Snapchat already slowed in the back half of 2016 as newer messaging apps like Charge, Confide and Whisper have come to market.

When Snap finally does turn a profit, we could see the outsized P/E ratio lead value and growth at a reasonable price (GARP) investors to balk at buying the shares, which means Snap will be relying on growth investors. It amazes us how some investors love companies even though they are not generating positive net income, but balk at P/E ratio that is too high the minute they start to generate positive albeit rather small earnings per share. We get around that problem by using a multi-pronged valuation approach to determine upside and downside price targets.


Is Snap the Next GoPro?

While all those numbers and forecasts are important to one’s investment decision making process (we make that point clear in Cocktail Investing: Distilling Everyday Noise into Clear Investment Signals for Better Returns), we have a more primal issue with Snap. Back in late 2015, we shared our view that GoPro (GPRO) was really a feature, not a product. As we said at the time, we saw Yelp (YELP), Angie’s List (ANGI), Groupon (GRPN) and others as features that over time will be incorporated into other products — like Facebook’s Professional Services, those at Amazon (AMZN) or others from Alphabet’s Google, much the way point-and-shoot cameras were overtaken by camera-enabled smartphones and personal information management functions were first incorporated into mobile phones and later smartphones, obviating the need for the original Palm Pilot and other pocket organizers.

When GoPro shares debuted in June 2014, they were a strong performer over the following months until they peaked near $87, but 15 months after going public GPRO shares fell through the IPO price and have remained underwater ever since.

What happened?

We recall hearing plans for a video network of user channels at GoPro as well as the management team touting the company as an “end to end storytelling solution,” but over the last few quarters, we’ve heard far more about new product issues, layoffs, facility closures and falling unit sales.  In 2016, GoPro saw camera unit sell-through fall 12 percent year-over-year to 5.3 million units from approximately 6 million units in 2015.

In our view, what happened can be summed up rather easily — GoPro was and is a feature, not a standalone product. It just took the stock market some time to figure it out once the IPO blitz and glory subsided. While we could be wrong, we have a strong suspicion that Snap is more likely to resemble GoPro than Facebook, which is monetizing multiple platforms as it extends its presence with new solutions deeper into the lives of its users and has changed the way people communicate.

As investors, we at Tematica would much rather own innovators of new products and solutions that are addressing pain points or benefitting from disruptive forces and changing economics, demographics, and psychographics in the marketplace than companies that offer features that will soon be co-opted by other companies and their products. Following that focus on 20/20 foresight, we avoided GoPro shares that fell from $19.50 in December 2015 to the recent share price of $8.84.
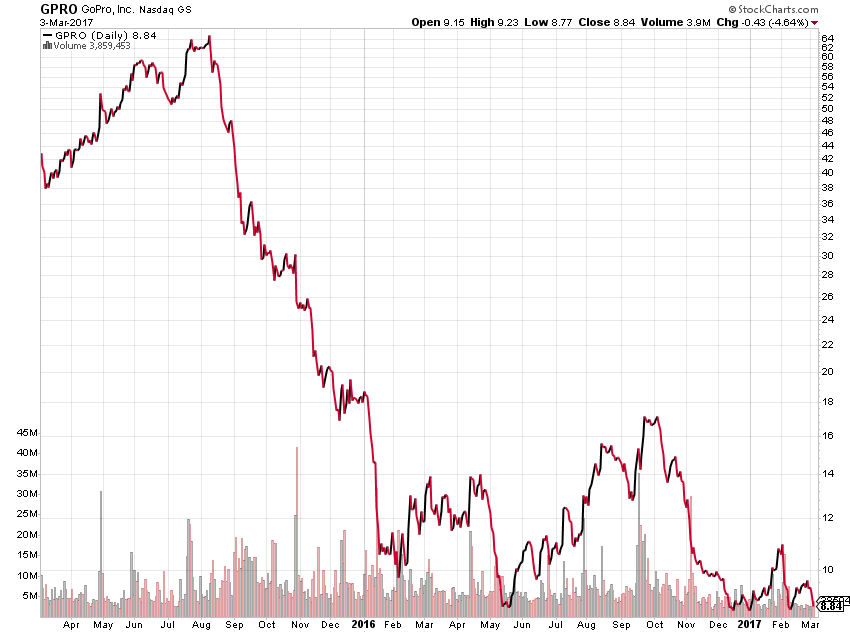
GoPro 2-year Share Price Performance


And then there’s this . . . 

There is another consideration which is not specific to Snap, but is rather an issue that all newly public companies must contend with — the lock-up expiration. For those unfamiliar with it, the lock-up period is a contractual restriction that prevents insiders who are holding a company’s stock, before it goes public, from selling the stock for a period usually between 90 to 180 days after the company goes public. Per Snap’s S-1, its lock-up expiration is 150 days, which puts it in 3Q 2017. Given the potential that insider selling could hit the shares, and be potentially disruptive to the share price, we tend to wait until the lock-up expiration comes and goes before putting the shares under the full Tematica telescope. This isn’t specific to Snap shares, but rather it’s one of our rules of thumb.

We have a strong suspicion that Snap is more likely to resemble GoPro than Facebook, but we’ll keep an open mind during the SNAP shares lock-up period, after all, companies are living entities that can move forward and backward depending on the market environment and leadership team. Let’s remember too that it took Facebook some time to figure out mobile.

Finally, we aren’t so thrilled that none of the 200 million shares floated came with voting rights, leaving the two founders Evan Spiegel and Robert Murphy with total control of the company. We prefer seeing more direct shareholder accountability… but hey, that’s us.


 

American Income Levels Stagnant for over 20 years!

American Income Levels Stagnant for over 20 years!

On February 13th, at I must add the ungodly hour of 6:30am PST, I spoke with Stuart Varney on Fox Business concerning the dismal state of income levels in the United States. According to the US Census bureau, median household income is just over $51k, which is about where it was 20 years ago! We also just learned that real disposable personal income has fallen by 2.7% from a year ago, the biggest collapse since the semi-depression in 1974!  American income levels have been stagnant for over 20 years.

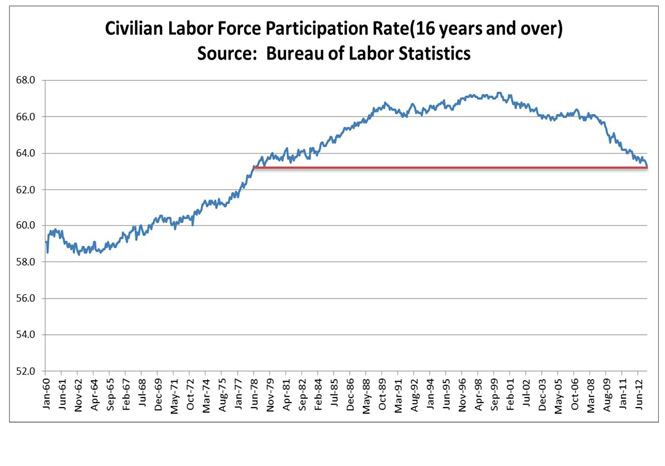
On top of weak income levels, the employment situation continues to be of great concern. US unemployment rate is now at 6.6%, but this measure has become relatively meaningless as it no longer accurately describes what is happening in the work force. A more descriptive measure is the labor force participation rate, meaning the proportion of the population either employed or looking for employment as a percent of the population. That number is down at 63%, a level we have not seen since 1978! If the labor force participation rate were still at pre-crisis levels, the unemployment rate would be closer to 13%. Some argue that the decline in the labor force participation rate is primarily driven by the inevitable retirement waves of the baby boomers. However, the chart below illustrates that baby boomers are in fact participating in the work force at a higher rate than in decades, for women we are at all-time highs.


With income struggling, it should come as no surprise that savings levels are well below what they ought to be for a financially healthy country. The IRS’s most recent Quarterly Statistics of Income Bulletin is for the 2010 and 2011 tax filings, so it is a bit dated, but nonetheless, very insightful as to trends. According to the release 145.6 million taxpayers were eligible to contribute to an individual retirement account (IRA) in 2010, but only 3.5 million actually did so and of those that did, 62% were over 49 years old. Uh oh! Only 2.4% of those eligible to contribute to their IRAs did so. The average account value is only $92,000 and only 27.6% of all tax filers even have an IRA. Lastly, that wee bit of spending spree we experienced in December? With income struggling, that was funded by consumers dipping into their piggy banks to the tune of $46 billion causing the personal savings rate to fall from 4.3% to 3.9%, the lowest since January 2013.

Changes in Unemployment

Changes in Unemployment

Unemployment continues to be a drain on the economy and the ranks of those even searching for a job declines.

Employment Chart

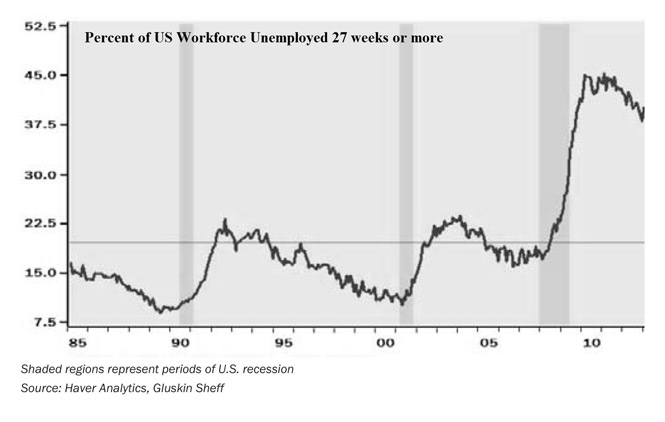
With such slow economic growth, it isn’t possible to get the unemployment situation to improve significantly, despite the attempts at upbeat headlines.  On April 5th we learned that March experienced the biggest monthly increase in people dropping out of the labor force since January 2012, with 663,000 no longer looking for work. This means that we now have 90 million working age Americans who are not in the labor force. Of those, 6.5 million want a job and want to be in the labor force, (Bureau of Labor Statistics). The labor force participation rate has now dropped to 63.3% of the population, a level not seen since October 1978. The number of Americans officially unemployed has almost doubled since the market hit these levels in 2007 while the number of Americans on food stamps has risen to levels never before seen, with an almost an 80% increase since 2007. It is no wonder that consumer confidence continues to sit in recessionary territory. What is most troubling is that a full 40% of those unemployed have been long-term, (see chart below). Remember that the growth of our economy is dependent on the quality and quantity of labor and capital in the economy. With so many leaving the workforce and so many others out of work for an extended period, both quality and quantity are being materially reduced, which is a detriment to future growth prospects.

Employment 02

GDP and Corporate Growth

GDP and Corporate Growth

GDP and Corporate Growth

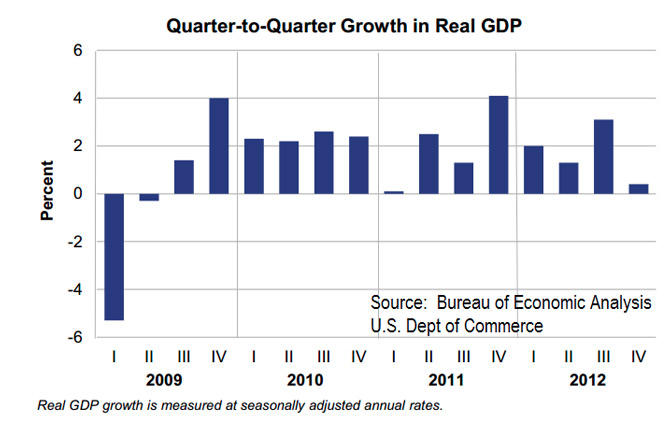
None of the four major components of the business cycle, (real income, sales, production and employment) have managed to get back to their 2007 highs, even now as we enter the fifth year of the recovery. This is truly a record, if an unfortunate one.

The chart above shows the continual stop and go pattern that has been GDP growth since the financial crisis. Never before in modern history has the U.S. experienced this many post-recession quarters without having at least one back-to-back 3% plus growth in GDP.  The first quarter of 2013 was reported on Friday April 26th to have grown by 2.5%, while the second quarter of 2013 is currently forecasted to be below 2%.

Corporate Earnings

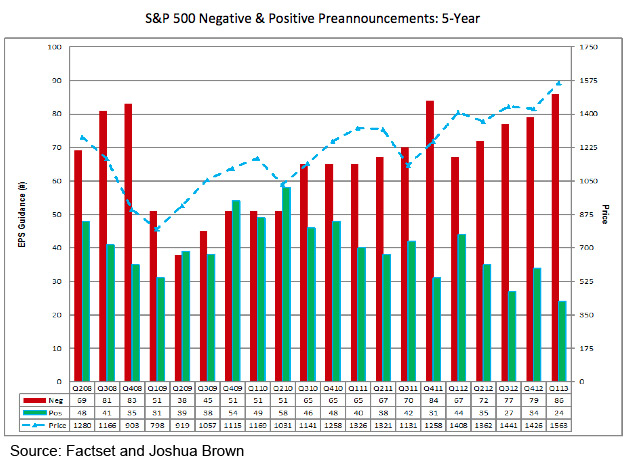
As we head into the first quarter’s earnings season, 78% of companies have issued negative earnings preannouncements, the highest percentage of companies issuing negative earnings guidance since FactSet began tracking the data in Q1 2006.

The chart above shows in red, the percent of negative preannouncements by quarter and in green the percent of positive preannouncements with the S&P in blue. This is a troublesome trend to say the least and has us watching the market movement carefully. Eventually, stock market growth must be supported by corporate earnings growth and the trend for the past 11 quarters has been fewer and fewer positive corporate earnings surprises, as this chart clearly illustrates. The quantitative easing objective of driving up stock prices in order to create a wealth effect that leads to consumers and businesses spending more is not translating into better than expected corporate earnings.