

January Retail Sales – Department Store Pain vs. E-tailing Gains
Earlier today the Census Bureau published its report on January Retail Sales, which topped expectations with a print of +0.4 percent vs. the expected 0.1 percent. Stripping out January Auto sales and food services, Retail sales +0.2 percent month over month. To us, the more telling figure was the 5.1 percent year over year increase in Retail only sales that was fueled by the 14.5 percent increase in Nonstore retailers, the +13.9 percent increase in gasoline station sales as well as strong showings from the Health & Personal Care stores categories and Building Material & Garden stores. Lackluster categories remained General Merchandise and Department Stores as well as Furniture and Electronics & Appliance stores.
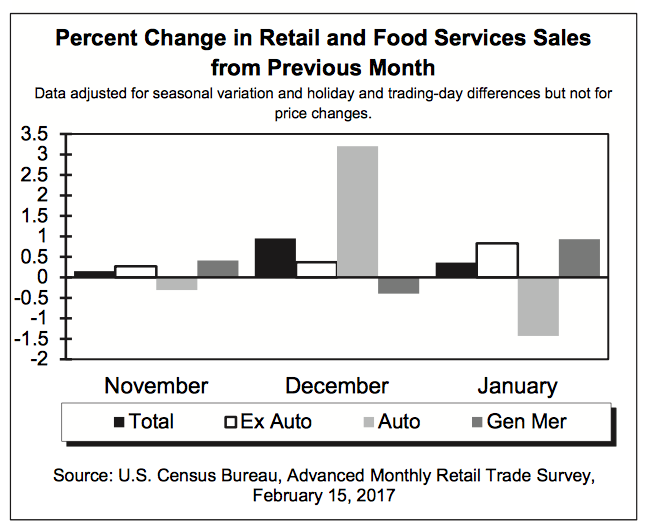
Donning our thematic hats and looking at the January report, we find continued support for the accelerating shift toward digital commerce that sits at the core of our Connected Society investing theme and benefits companies like Amazon (AMZN) and Alphabet (GOOGL), both of which are on the Tematica Select List, and eBay as well as delivery companies such as United Parcel Service (UPS). To us there is no more telling statistic for that than the year over year comparison between Nov. 2015 – Jan. 2016 and Nov. 2016 – Jan. 2017. when Nonstore retail sales rose 12.7 percent vs. 4.6 percent for overall retail sales. Talk about a share gain!
We see the strong showing by Health & Personal Care stores as rather confirming for our Aging of the Population investment theme, while the continued pain felt at department stores comes as little surprise given the post-holiday shopping comments we’ve heard from Macy’s (M), Kohl’s (KSS), JC Penney (JCP) and others, which includes a number of location closures. That loss of anchor tenants alongside announced store closings ranging from The Limited to Wet Seal and others only supports our Death of the Mall view that poses a significant headwind to mall real-estate investor trust companies like Simon Property Group (SPG), Westfield Corp. (WFGPY) and Taubman Centers (TCO).
- We continue to rate AMZN shares a Buy with a price target of $975
- We continue to rate GOOGL shares a Buy with a $900 price target
