Category Archives: Aging of the Population

Keys to July Retail Sales and Walmart Earnings Results

Keys to July Retail Sales and Walmart Earnings Results


Plus the Biggest Threat to the German Auto Industry

On this episode of the Thematic Signals podcast, we’re digging into the July Retail Sales and quarterly earnings results from Walmart as both confirm the hard-blowing tailwinds associated with our Digital Lifestyle, Middle-Class Squeeze, Aging of the Population and Cleaner Living Investing themes.


We also breakdown a recent article in The Wall Street Journalthat discusses how one aspect of our Cleaner Living investing theme — electric vehicles — could threaten the German economy. It’s the same structural shift that should have folks more than a little concerned about Tesla, both its business as well as its shares. All that and much more on this episode of the podcast. 

Have a topic or a conversation you think we should tackle on the podcast, email me at cversace@tematicaresearch.com

And don’t forget to subscribe to the Thematic Signals Podcast on iTunes!

Resources for this podcast:

Weekly Issue: The Data Continues to Weaken

Weekly Issue: The Data Continues to Weaken


Key points inside this issue


  •  June quarter earnings season could reset second half expectations
  •  Introducing the Tematica Research Cleaner Living Index
  • Setting protective stop loss levels for the Select List 
  • We are issuing a Sell rating and removing both AXT Inc. (AXTI) and Energous Corp. (WATT) shares from the Select List 

And the data continues to weaken


If you’ve been paying attention to the financial media — be it on CNBC or Twitter — you’ve probably seen the news that the latest rash of economic data has come in weaker than expected. This includes a growing number of June data issued by the regional Federal Reserve banks as well as a drop in both June Consumer Confidence and May New Home Sales. We’ve also seen a sharp drop in the May Cass Freight Index and other similar indicators. 

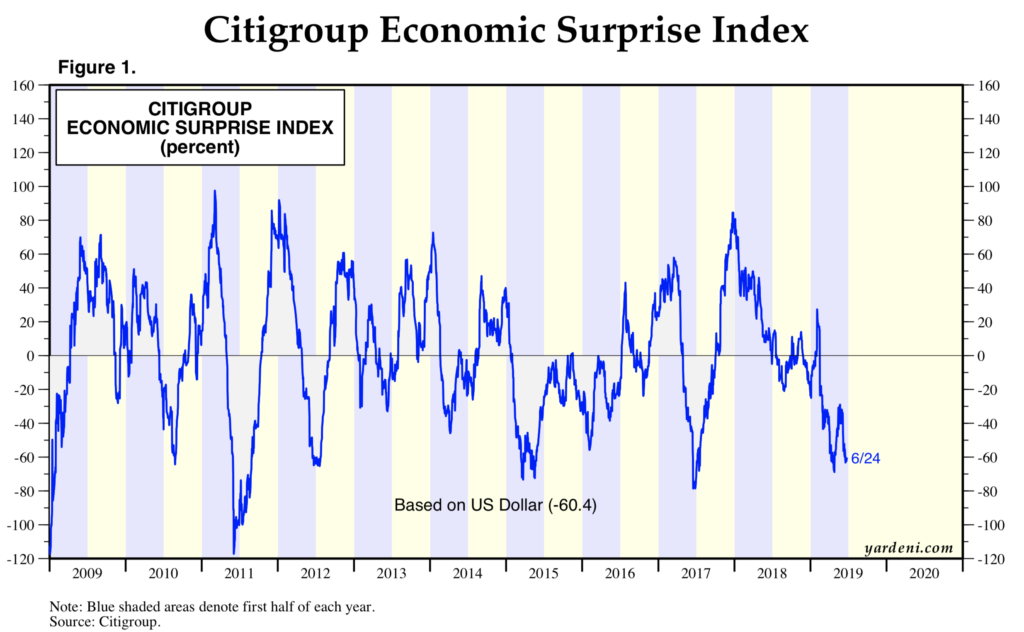
Over the past several weeks, we’ve continued to see a growing amount of data come in below expectations, and arguably the best representation for this is found in the Citibank Economic Surprise Index, better known as CESI. As we can see in the below chart, that index shows the sorry state of economic data relative to expectations, which also explains the downward slope and slowing velocity depicted in GDP forecasts for the current quarter.


As I type this, the Atlanta Fed GDP Now reading for the June quarter sits at 2.0%, but I would be quick to call out it was last updated on June 18. This means several of this weeks’ weak data points have yet to be factored into that GDP forecast. By comparison, the New York Fed’s Nowcast reading for the June quarter is 1.39% as of June 21 – better in the sense that it is more up to date, but it’s still missing some of the most recent data. Both of those GDP forecasts will more than likely be revised lower, exacerbating the sharp slowdown relative to the March quarter’s GDP print of 3.1%.

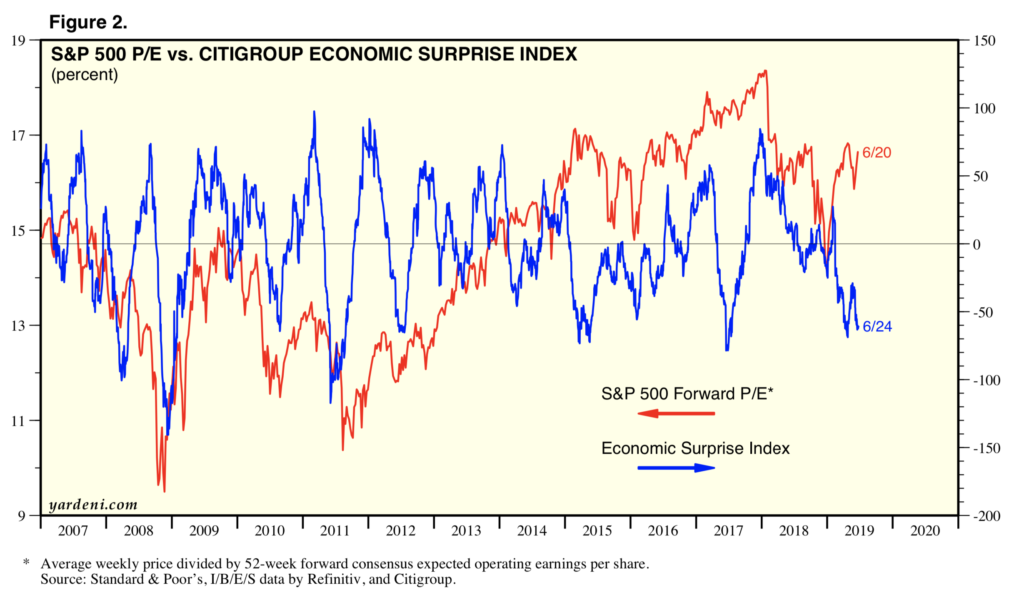
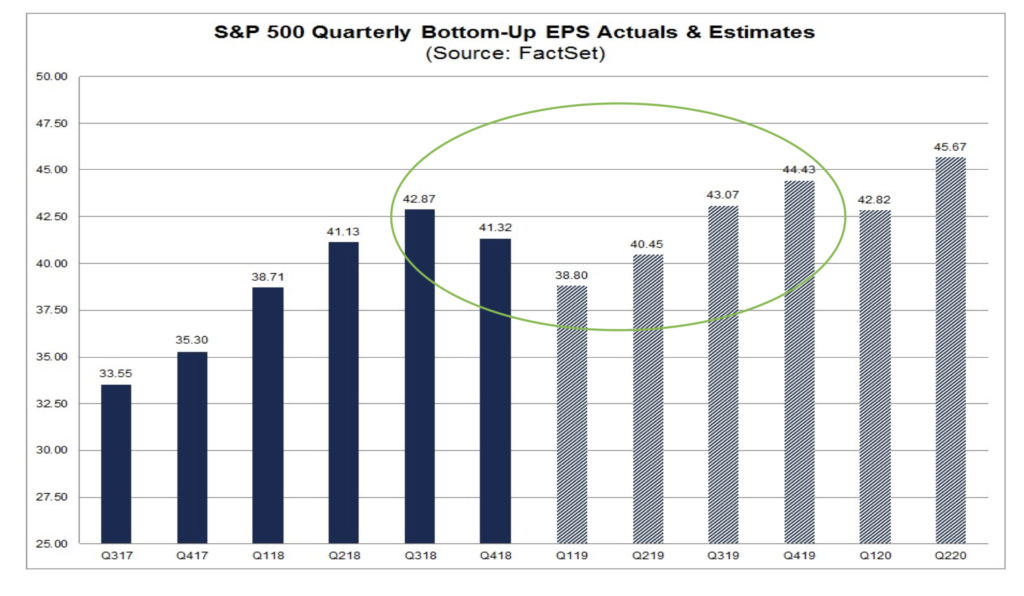
When we look at the stock market, however, one might think things were going gangbusters given what is poised to be the best June in sometime. But it’s the next two charts that have me concerned for the upcoming June quarter earnings season. The first one shows how the market has performed despite the data showcasing a weakening economy. The second one shows second half EPS expectations for the S&P 500 group of companies remain above 10% compared to the first half. Take a look at the charts and let that last comment sink in. 


June quarter earnings season could reset second half expectations

Simply stated, the odds of the S&P 500 group of companies delivering that level of EPS growth in the back half of 2019 given the vector and velocity of both the domestic as well as global economy, with the impact of tariffs that are in place, and the lack of anything like the 2018 bottom line benefit that was tax reform are rather low in my opinion. Before the usual July deluge, this week we’ll get earnings from the likes of FedEx (FDX), Nike (NKE) and Select List resident McCormick & Co. Inside those reports, I’ll be listening for comments not only on their respective businesses, but also international demand, currency and tariffs. In my view, what we hear from these three companies and others will set the stage for what is to come in the following weeks. 

One recommendation I would make to subscribers is to hang onto the ProShares Short S&P 500 ETF (SH) shares that were added to the Select List back in December. While SH shares have moved against us as the market has moved higher in 2019, much like insurance when we’ll want to own them, it will be too late to buy them. 

With the Fed out of the way for now following last week’s meeting that signaled its more dovish bent, ahead of us we have the G20 summit and all eyes are now bracing for its outcome. Will Presidents Trump and Xi get US-China trade talks back on track? Will there be any new development to be had between the US-Iran? 

The answers to these questions and others will shape the start of the stock market in the second half of 2019. While I remain hopeful, the chatter we are hearing that includes White House officials now saying US-China trade talks could “go on for months or years.” The optimist in me hopes this is pre-game $#!+ talking, but better to hope for the best and prepare for the worst.

We did that last week with the Thematic Leaders and shortly we’ll do that for the Select List as well. First, however, I have something exciting to share with you… the unveiling of the Tematica Research Cleaner Living Index.

Introducing the Tematica Research Cleaner Living Index

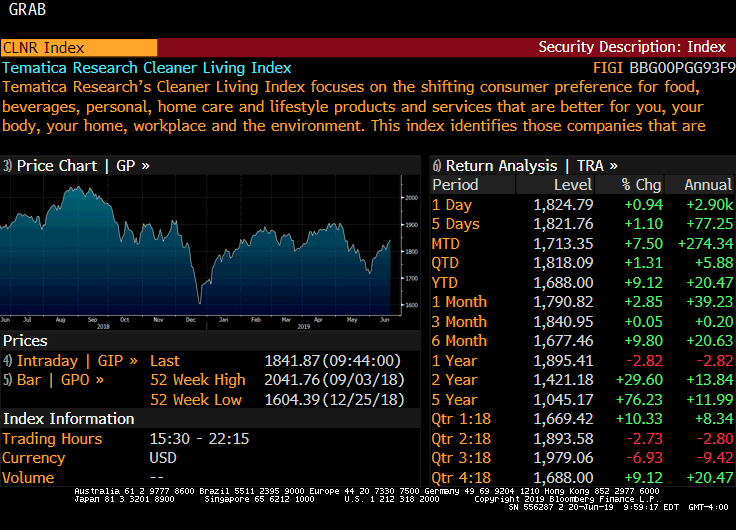
Yesterday we debuted the Tematica Research Cleaner Living Index (CLNR), which as you probably guessed, is an index of publicly traded companies that reflects our Clean Living investing theme. There are more than 50 constituents in the index, including Clean Living Thematic Leader Chipotle Mexican Grill (CMG), that reflect the accelerating shift by consumers and businesses toward products and services that are better for you, your home, and the environment. We’ve culled the index’s constituents from our thematic database that spans more than 2,400 companies scored across our 10 investing themes. And because we wanted to isolate the companies with the greatest exposure to this theme, the index’s constituents are those companies that derive more than half of their sales or profits from Clean Living tailwinds. 

The formal press release announcing the index can be read here. Subscribers should expect to hear much more about the index in the coming weeks in a number of updates that include price action, Thematic Signals, and other articles. Like other indices, we view Cleaner Living as a living, breathing thing that will change over time as new companies debut and companies pivot their business into the Clean Living theme tailwind with new products or M&A activity. That M&A activity could also lead to companies being removed from the index. As we’ve seen in recent quarters with the takeout of SodaStream by PepsiCo (PEP) or Cava Grill acquiring Zoe’s Kitchen, companies are indeed using that strategy to accelerate their make over. There should be no shortage of Cleaner Living index related items to share and discuss.

With that in mind, as I write this, I am winging my way toward Manhattan where over the next two days I’ll be appearing on a number of programs from The First Trade on Yahoo Finance! to Making Money with Charles Payne on Fox Business and others across Cheddar, the TD Ameritrade Network and other outlets. As we get the clips, I’ll be sure to share them via Twitter (@Chrisjversace). 

Get ready, because when it comes to the Cleaner Living index, we are just getting started.


Tematica Investing

Setting protective stop loss levels for the Select List

Last week we set or reset stop loss levels for the Thematic Leaders, and with the preponderance of data coming in weaker than expected this week, I’m going to do the same for positions on the Select List as follows:

  • Apple Inc. (AAPL) – $160                            
  • Applied Materials, Inc. (AMAT) – $34                                           
  • The Walt Disney Co.  (DIS) – $111              
  • Alphabet (GOOGL)- $900                         
  • ETFMG Prime Cyber Security ETF Safety & Security (HACK) – $31     
  • International Flavors and Fragrances (IFF) – $117
  • McCormick & Co. (MKC) – $123
  • Universal Display (OLED) – $150   
  • AT&T  (T) – $26
  • United Parcel Service (UPS) – $85
  • USA Technologies (USAT) – $6 


Removing AXTI and WATT shares from the Select List

As we make these moves, we’ll also cut bait on shares of AXT Inc. (AXTI) as well as Energous Corp. (WATT). Both positions have been hard hit, despite the thematic potential associated with 5G and wireless charging. With key AXT customers, such as Skyworks (SWKS) and Qorvo (QRVO) slashing their outlooks given the ban on Huawei, odds are rather high AXT’s business will be impacted. Similarly, with Energous, with Apple opting to not enter the wireless charging market, and a longer design to product conversion cycle unfolding we’ll look to preserve existing capital by those shares as well. 

  • We are issuing a Sell rating and removing both AXT Inc. (AXTI) and Energous Corp. (WATT) shares from the Select List 


Welcome to the New Thematic Signals Podcast

Welcome to the New Thematic Signals Podcast


Welcome to the Thematic Signals podcast, where we look to distill everyday noise into clear investing signals using our thematic lens and our 10 investing themes. Every week we not only discuss key events that are shaping the stock market, but we also look at key sign posts for the changing economic, demographic, psychographic, and technological landscapes that are driving the structural changes occurring around us. 

On this episode, with retailer earnings in the spotlight, we dig into which ones are winning the fight for consumer wallet share and those that are losing. The implications are huge given that retail accounts for nearly 20% of the S&P 500 and roughly 16% of US GDP.  Those that are winning the wallet share fight, such as Target, Hibbett Sports, Walmart, TJX Companies. Best Buy and others are leveraging our Middle-Class Squeeze, Digital Society and to a lesser extent our Aging of the Population investing theme. We also talk about what investors should be looking for next as earnings season winds down and share some of the latest signals for our 10 investing themes.

Have a topic or a conversation you think we should tackle on the podcast, email me at cversace@tematicaresearch.com

And don’t forget to subscribe to the Thematic Signals Podcast on iTunes!

Resources for this podcast:

Doubling Down on Digital Infrastructure Thematic Leader

Doubling Down on Digital Infrastructure Thematic Leader

Key point inside this issue

  • We are doubling down on Dycom (DY) shares on the Thematic Leader board and adjusting our price target to $80 from $100, which still offers significant upside from our new cost basis as the 5G and gigabit fiber buildout continues over the coming quarters.

We are coming at you earlier than usual this week in part to share my thoughts on all of the economic data we received late last week.


Last week’s data confirms the US economy is slowing

With two-thirds of the current quarter behind now in the books, the continued move higher in the markets has all the major indices up double-digits year to date, ranging from around 11.5-12.0%% for the Dow Jones Industrial Average and the S&P 500 to nearly 18% for the small-cap heavy Russell 2000. In recent weeks we have discussed my growing concerns that the market’s melt-up hinges primarily on U.S.-China trade deal prospects as earnings expectations for this year have been moving lower, dividend cuts have been growing and the global economy continues to slow. The U.S. continues to look like the best economic house on the block even though it, too, is slowing.

On Friday, a round of IHS Markit February PMI reports showed that three of the four global economic horsemen — Japan, China, and the eurozone — were in contraction territory for the month. New orders in Japan and China improved but fell in the eurozone, which likely means those economies will continue to slug it out in the near-term especially since export orders across all three regions fell month over month. December-quarter GDP was revealed to be 2.6% sequentially, which equates to a 3.1% improvement year over year but is down compared to the 3.5% GDP reading of the September quarter and 4.2% in the June one.  Slower growth to be sure, but still growing in the December quarter.

Before we break out the bubbly, though, the IHS Markit February U.S. Manufacturing PMI fell to its lowest reading in 18 months as rates of output and new order growth softened as did inflationary pressures. This data suggest the U.S. manufacturing sector is growing at its slowest rate in several quarters, as did the February ISM Manufacturing Index reading, which slipped month over month and missed expectations. Declines were seen almost across the board for that ISM index save for new export orders, which grew modestly month over month. The new order component of the February ISM Manufacturing Index dropped to 55.5 from 58.2 in January, but candidly this line item has been all over the place the last few months. The January figure rebounded nicely from 51.3 in December, which was down sharply from 61.8 in November. This zig-zag pattern likely reflects growing uncertainty in the manufacturing economy given the pace of the global economy and uncertainty on the trade front. Generally speaking though, falling orders translate into a slower production and this means carefully watching both the ISM and IHS Markit data over the coming months.

In sum, the manufacturing economy across the four key economies continued to slow in February. On a wider, more global scale, J.P. Morgan’s Global Manufacturing PMI fell to 50.6 in February, its lowest level since June 2016. Per J.P. Morgan’s findings, “the rate of expansion in new orders stayed close to the stagnation mark,” which suggests we are not likely to see a pronounced rebound in the near-term. We see this as allowing the Fed to keep its dovish view, and as we discuss below odds are it will be joined by the European Central Bank this week.

Other data out Friday included the December readings for Personal Income & Spending and the January take on Personal Income. The key takeaway was personal income fell for the first time in more than three years during January, easily coming in below the gains expected by economists. Those pieces of data not only help explain the recent December Retail Sales miss but alongside reports of consumer credit card debt topping $1 trillion and record delinquencies for auto and student loans, point to more tepid consumer spending ahead. As I’ve shared before, that is a headwind for the overall US economy but also a tailwind for those companies, like Middle-class Squeeze Thematic Leader Costco Wholesale (COST), that help consumers stretch the disposable income they do have.

We have talked quite a bit in recent Tematica Investing issues about revisions to S&P 500 2019 EPS estimates, which at last count stood at +4.7% year over year, down significantly from over +11% at the start of the December quarter. Given the rash of reports last week – more than 750 in total –  we will likely see that expected rate of growth tweaked a bit lower.

Putting it all together, we have a slowing U.S. and global economy, EPS cuts that are making the stock market incrementally more expensive as it has moved higher in recent weeks, and a growing number of dividend cuts. Clearly, the stock market has been melting up over the last several weeks on increasing hopes over a favorable trade deal with China, but last week we saw President Trump abruptly end the summit with North Korea’s Kim Jong Un with no joint agreement after Kim insisted all U.S. sanctions be lifted on his country. This action spooked the market, leading some to revisit the potential for a favorable trade deal between the U.S. and China.

Measuring the success of any trade agreement will hinge on the details. Should it fail to live up to expectations, which is a distinct possibility, we could very well see a “buy the rumor, sell the news” situation arise in the stock market. As I watch for these developments to unfold, given the mismatch in the stock market between earnings and dividends vs. the market’s move thus far in 2019 I will also be watching insider selling in general but also for those companies on the Thematic Leader Board as well as the Tematica Select List. While insiders can be sellers for a variety of reasons, should we see a pronounced and somewhat across the board pick up in such activity, it could be another warning sign.


What to Watch This Week

This week we will see a noticeable drop in the velocity of earnings reports, but we will still get a number of data points that investors and economists will use to triangulate the speed of the current quarter’s GDP relative to the 2.6% print for the December quarter. The consensus GDP forecast for the current quarter is for a slower economy at +2.0%, but we have started to see some economists trim their forecasts as more economic data rolls in. Because that data has fallen shy of expectations, it has led the Citibank Economic Surprise Index (CESI) to once again move into negative territory and the Atlanta Fed’s GDPNow current quarter forecast now sat at 0.3% as of Friday.

On the economic docket this week, we have December Construction Spending, ISM’s February Non-Manufacturing Index reading, the latest consumer credit figures and the February reports on job creation and unemployment from ADP (ADP) and the Bureau of Labor Statistics. With Home Depot (HD) reporting relatively mild December weather, any pronounced shortfall in December Construction Spending will likely serve to confirm the economy is on a slowing vector. Much like we did above with ISM’s February Manufacturing Index we’ll be looking into the Non-Manufacturing data to determine demand and inflation dynamics as well as the tone of the services economy.

On the jobs front, while we will be watching the numbers created, including any aberration owing to the recent federal government shutdown, it will be the wage and hours worked data that we’ll be focusing on. Wage data will show signs of any inflationary pressures, while hours worked will indicate how much labor slack there is in the economy. The consumer is in a tighter spot financially speaking, which was reflected in recent retail sales and personal spending data. Recognizing the role consumer spending plays in the overall speed of the U.S. economy, we will be scrutinizing the upcoming consumer credit data rather closely.

In addition to the hard data, we’ll also get the Fed’s latest Beige Book, which should provide a feel for how the regional economies are faring thus far in 2019. Speaking of central bankers, next Wednesday will bring the results of the next European Central Bank meeting. Given the data depicted in the February IHS Markit reports we discussed above, the probability is high the ECB will join the Fed in a more dovish tone.

While the velocity of earnings reports does indeed drop dramatically next week, there will still be several reports worth digging into, including Ross Stores (ROST), Kohl’s (KSS), Target (TGT), BJ’s Wholesale (BJ), and Middle-class Squeeze Thematic Leader Costco Wholesale (COST) will also issue their latest quarterly results. Those reports combined with the ones this week, including solid results from TJX Companies (TJX) last week should offer a more complete look at consumer spending, and where that spending is occurring. Given the discussion several paragraphs above, TJX’s results last week, and the monthly sales reports from Costco, odds are quite good that Costco should serve up yet another report showcasing consumer wallet share gains.

Outside of apparel and home, reports from United Natural Foods (UNFI) and National Beverage (FIZZ) should corroborate the accelerating shift toward food and beverages that are part of our Cleaner Living investing theme. In that vein, I’ll be intrigued to see what Tematica Select List resident International Flavors & Fragrances (IFF) has to say about the demand for its line of organic and natural solutions.

The same can be said with Kroger (KR) as well as its efforts to fend off Thematic King Amazon (AMZN) and Walmart (WMT). Tucked inside of Kroger’s comments, we will be curious to see what the company says about digital grocery shopping and delivery. On Kroger’s last earnings conference call, Chairman and CEO Rodney McMullen shared the following, “We are aggressively investing to build digital platforms because they give our customers the ability to have anything, anytime, anywhere from Kroger, and because they’re a catalyst to grow our business and improve margins in the future.” Now to see what progress has been achieved over the last 90 or so days and what Kroger has to say about the late-Friday report that Amazon will launch its own chain of supermarkets.


Tematica Investing
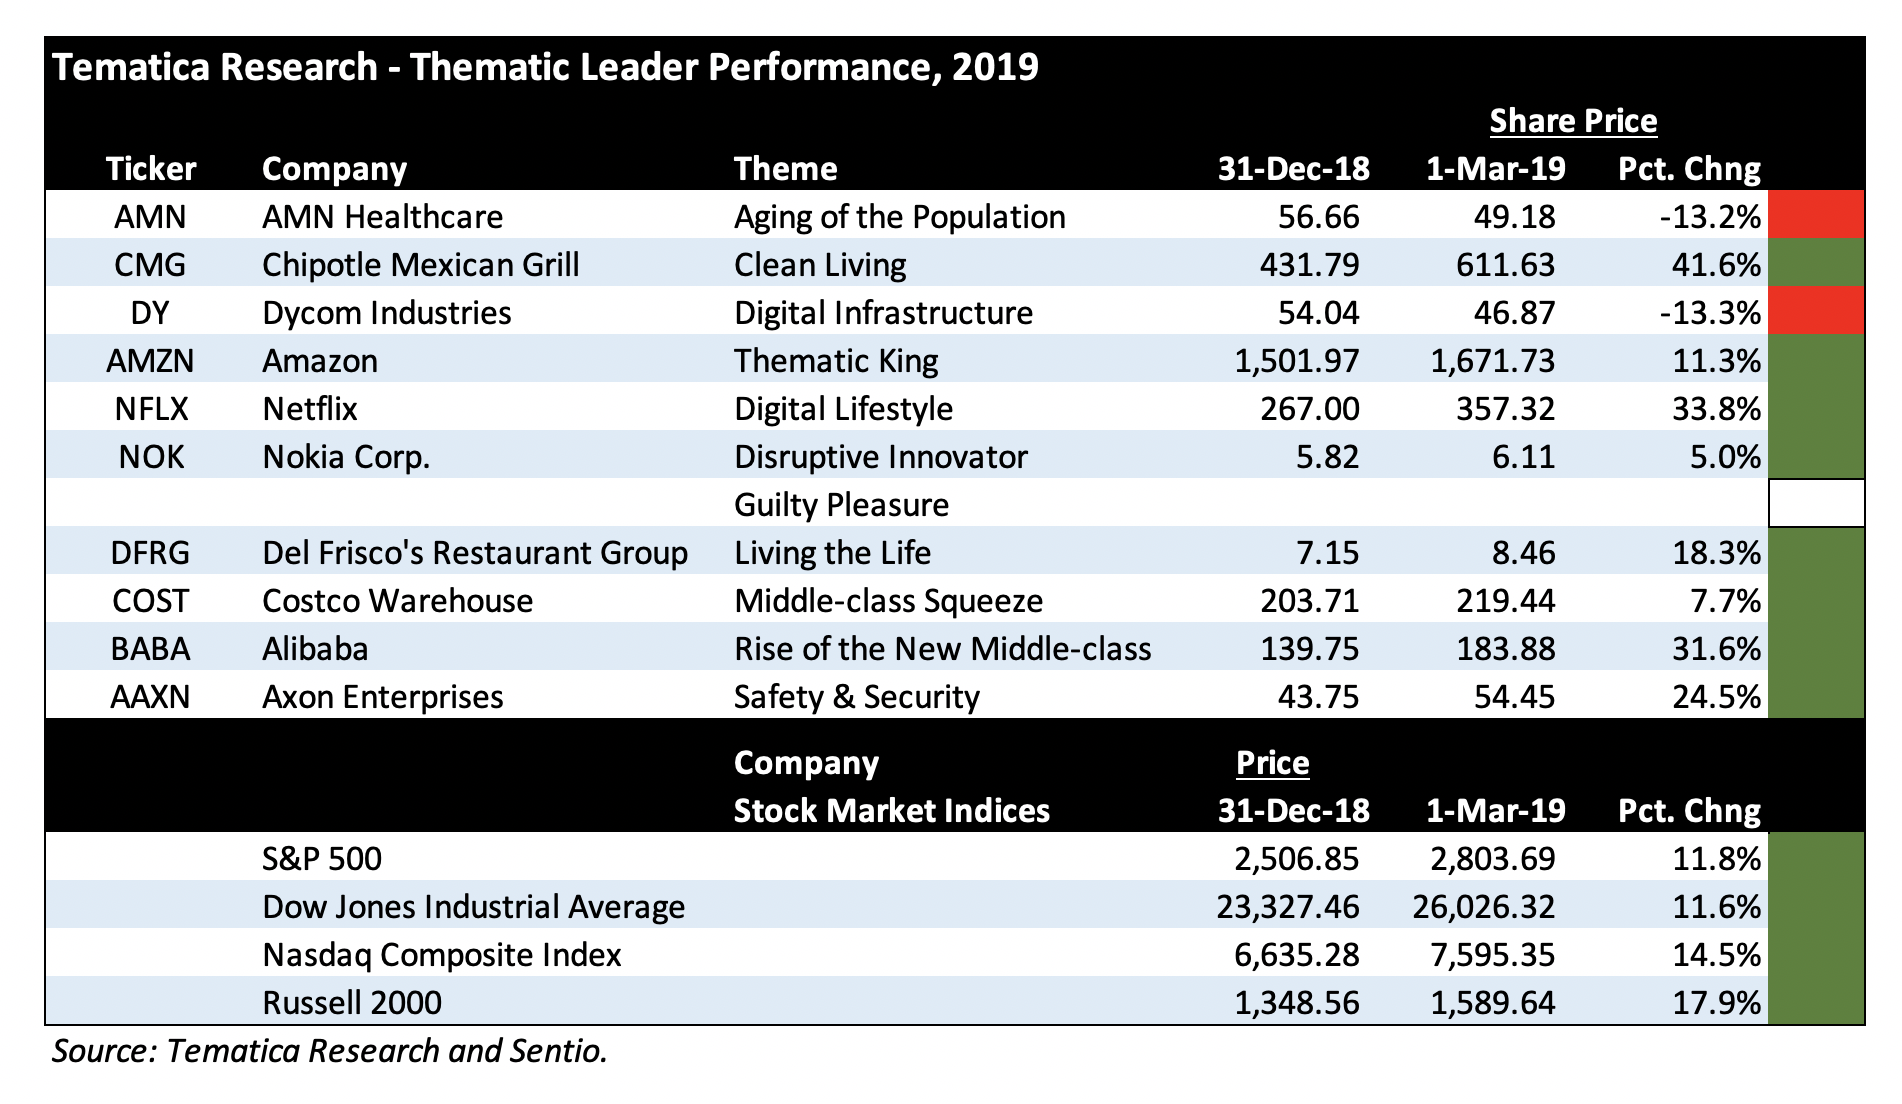
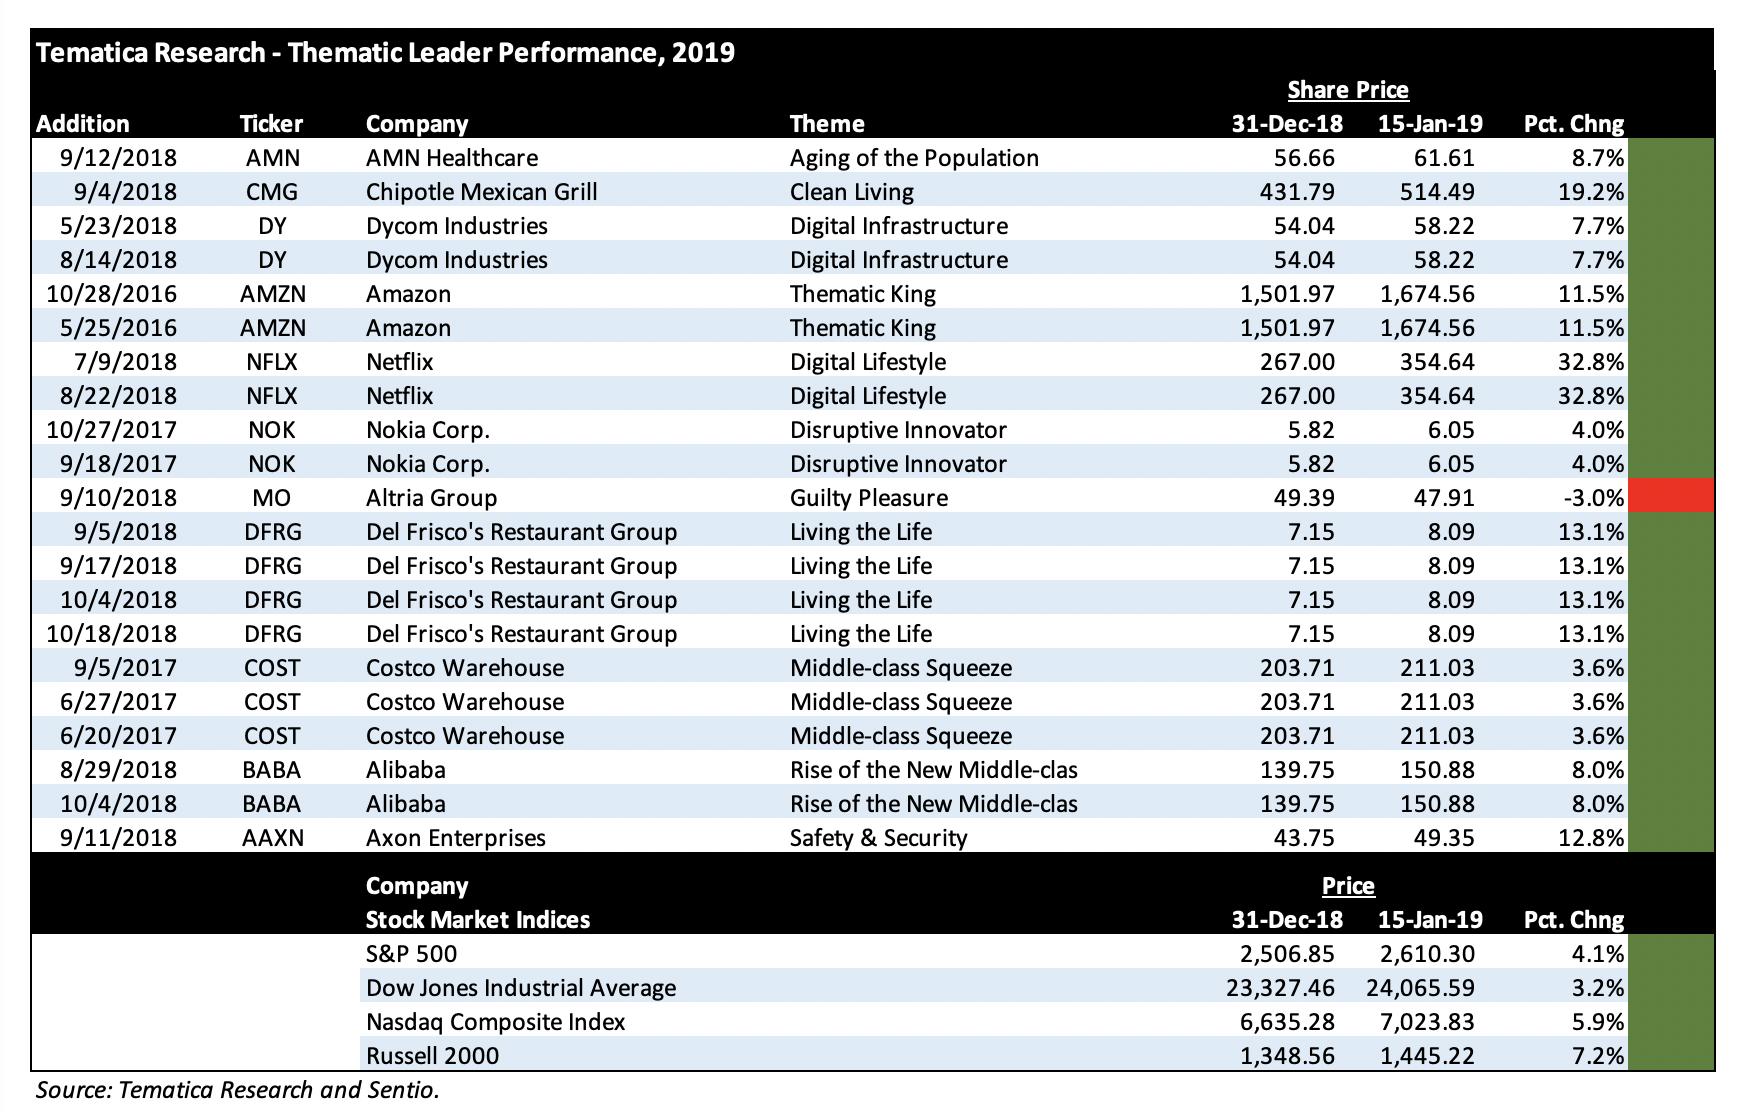
As you can see in the chart above, for the most part, our Thematic Leaders have been delivering solid performance. Shares of Costco Wholesale (COST) and Nokia (NOK) are notable laggards, but with Costco’s earnings report later this week which will also include its February same-store sales, I see the company’s business and the shares once again coming back into investor favor as it continues to win consumer wallet share. That was clearly evident in its December and January same-store sales reports. With Nokia, coming out of Mobile World Congress 2019 last week, we have confirmation that 5G is progressing, with more network launches coming and more devices coming as well in the coming quarters. We’ll continue to be patient with NOK shares.


Adding significantly to our position in Thematic Leader Dycom Industries

There are two positions on the leader board – Aging of the Population AMN Healthcare (AMN) and Digital Infrastructure Dycom Industries (DY) – that are in the red. The recent and sharp drop in Dycom shares follows the company’s disappointing quarterly report in which costs grew faster than 14.3% year over year increase in revenue, pressuring margins and the company’s bottom line. As we’ve come to expect this alongside the near-term continuation of those margin pressures, as you can see below, simply whacked DY shares last week, dropping them into oversold territory.
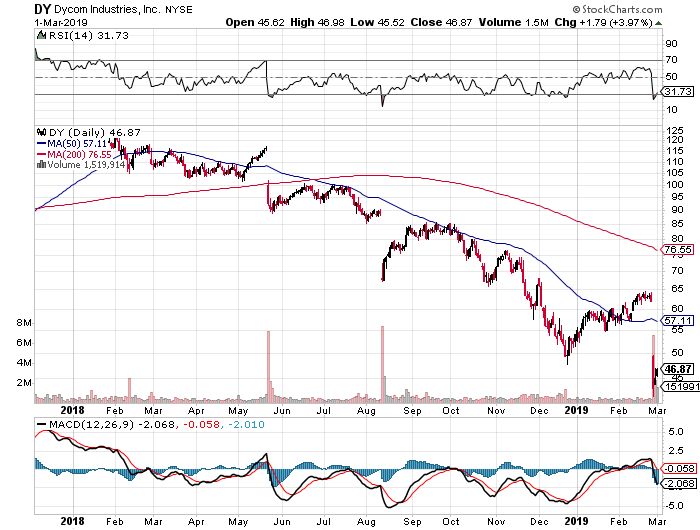
 

When we first discussed Dycom’s business, I pointed out the seasonal tendencies of its business, and that likely means some of the February winter weather brought some added disruptions as will the winter weather that is hitting parts of the country as you read this. Yet, we know that Dycom’s top customers – AT&T (T), Verizon (VZ), Comcast (CMCSA) and CenturyLink (CTL) are busy expanding the footprint of their connective networks. That’s especially true with the 5G buildout efforts at AT&T and Verizon, which on a combined basis accounted for 42% of Dycom’s January quarter revenue.

Above I shared that coming out of Mobile World Congress 2019, commercial 5G deployments are likely to be a 2020 event but as we know the networks, base stations, and backhaul capabilities will need to be installed ahead of those launches. To me, this strongly suggests that Dycom’s business will improve in the coming quarters, and as that happens, it’s bound to move down the cost curve as efficiencies and other aspects of higher utilization are had. For that reason, we are using last week’s 26% drop in DY shares to double our position size in DY shares on the Thematic Leader board. This will reduce our blended cost basis to roughly $64 from the prior $82. As we buy up the shares, I’m also resetting our price target on DY shares to $80, down from the prior $100, which offers significant upside from the current share price and our blended cost basis.

If you’re having second thoughts on this decision, think of it this way – doesn’t it seem rather strange that DY shares would fall by such a degree given the coming buildout that we know is going to occur over the coming quarters? If Dycom’s customers were some small, regional operators I would have some concerns, but that isn’t the case. These customers will build out those networks, and it means Dycom will be put to work in the coming quarters, generating revenue, profits, and cash flow along the way.

In last week’s Tematica Investing I dished on Warren Buffett’s latest letter to Berkshire Hathaway (BRK.A) shareholders. In thinking about Dycom, another Buffett-ism comes to mind – “Opportunities come infrequently. When it rains gold, put out the bucket, not the thimble.” Since this is a multi-quarter buildout for Dycom, we will need to be patient, but as we know for the famous encounter between the tortoise and the hare, slow and steady wins the race.

  • We are doubling down on Dycom (DY) shares on the Thematic Leader board and adjusting our price target to $80 from $100, which still offers significant upside from our new cost basis as the 5G and gigabit fiber buildout continues over the coming quarters.


As the pace of earnings slows, over the next few weeks I’ll not only be revisiting the recent 25% drop in Aging of the Population Thematic Leader AMN Healthcare to determine if we should make a similar move like the one we are doing with Dycom, but I’ll also be taking closer looks at wireless charging company Energous Corp. (WATT) and The Alkaline Water Company (WTER). Those two respectively fall under our Disruptive Innovators and Cleaner Living investing themes. Are they worthy of making it onto the Select List or bumping one of our Thematic Leaders? We’ll see…. And as I examine these two, I’m also pouring over some candidates to fill the Guilty Pleasure vacancy on the leader board.


As the Market Bounces Off Oversold Conditions, is this the Start of Another Bull Run?

As the Market Bounces Off Oversold Conditions, is this the Start of Another Bull Run?

Market Reversal

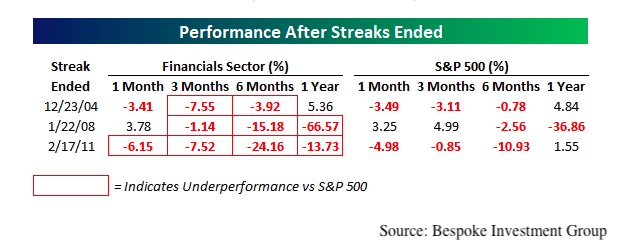
So far in 2019, we are seeing a reversal of the heavily oversold conditions from the end of 2018. Those stocks that were hit the hardest in 2018 are materially outperforming the broader market in 2019. For example, through the close on January 16, 62% of stocks in the Financial sector were above their 50-day moving average, the highest of any sector, versus 44% for the S&P 500 overall. To put that into perspective, Financials have not been the top performer for this metric in 273 trading days, the second-longest such streak since 2001 and only the fourth streak ever of more than 200 trading days. It isn’t just financials as the Energy sector, which was the worst performing sector in 2018, has the third highest percent of stocks above their 50-day in 2019.

While impressive looking, this shift doesn’t necessarily bode well for the Financial sector, nor for the broader market according to data compiled by Bespoke Investment Group.


Stock Performance After Streaks Ended


This recent outperformance by Financials in 2019 is particularly fascinating when I talk to my colleagues at various major financial institutions. Here are a few of the comments I’ve been hearing, paraphrased and without attribution for obvious reasons:

“This deal is way too small for you guys, but I wanted to let you know that our team is working on it.” –  (M&A consultant)

Send it over.We are so late in the cycle that we are looking at damn near anything.” –  (Partner at one of the largest global private equity firms)

“What can we do to better serve your company? We are making a major push this year into better serving companies of this size.” –  (Partner at one of biggest investment banks to a very surprised member of the Board of Directors of a recently IPO’d company whose market cap would have normally left it well below the bank’s radar. After some investigation, many other board members for companies of a similar size in the sector have been getting the same phone calls from this bank.)

The big financial institutions are having to work their way downstream to find things to work on – that’s a major peak cycle indicator and does not bode well for margins. It also doesn’t bode well for the small and medium-sized institutions that will likely need to become more price competitive to win deals in this new more competitive playing field.

We have also seen some wild moves in a few of our favorites such as Thematic Leader Netflix (NFLX), which reported its earnings after the close on January 17th. Netflix sits at the intersection of our Digital Lifestyle and Disruptive Innovators investing themes and has seen its share price fall over 40% from the July 2018 all-time highs to bottom out on December 24th. Since then, as of market’s close on January 17, shares gained nearly 50% – in around all of 100 trading hours! While about 10% of that can be attributed to the recent price increase that will amount to about $2 or so per month for subscribers, there are greater forces at work for a move of such magnitude. No one can argue that either direction was based on fundamentals, but rather a market that is experiencing major changes.

One of the most important leading indicators as we start the Q4 earnings seasons was the miss by FedEx (FDX) and the negative guidance the company provided for the upcoming quarters. FedEx’s competitor United Parcel Service (UPS) is part of our Digital Lifestyle investing theme – how are all those online and mobile purchases going to get to you? Both FedEx and UPS are critical leading indicator because they touch all aspects of the economy and transportation services, in general, have been posting some weak numbers lately in terms of both jobs and latest price data.

In what could be reflective of both our Middle Class Squeeze investing theme, Vail Resorts (MTN) also gave a negative pre-announcement, stating that its pre-holiday period saw much lower volumes than anticipated despite good weather conditions and more open trains. The sour end of the year in the investment markets and the weakness we’ve seen in markets around the world may have led many decided to forgo some fun in the snow. We’ll be keeping a close eye on consumer spending patterns, particularly by income level in the months to come.

Investor Sentiment Slips

According to the American Association of Individual Investors, bearish investor sentiment peaked at 50.3% on December 26, right after the market bottomed. Bullish sentiment over the past month rose from 20.9% to 38.5% but then stalled this week, falling back to 33.5% as the markets reached resistance levels. Bullish sentiment is now back below the historic average but still well above the December lows. Bearish sentiment, on the other hand, is on the rise, up to 36.3% from last week’s 29.4%. This is just further indication that much of what we’ve seen so far in 2019 is a recovery from the earlier oversold conditions.

As we look at the unusual pace at which the major indices lost ground in the latter part of 2018 and the sharp reversal in recent weeks, I can’t help but think of one of the many aspects of our Aging of the Population investment theme. A large portion of the most powerful demographic of asset owners is either in or shortly moving into retirement. Many already had their retirement materially postponed by the losses incurred during the financial crisis. They are now 10+ years older, which means they have less time to recover from any losses and have not forgotten the damage done in the last market correction. I suspect that we are likely to see more unusual market movements in the years to come than we have since the Boomer generation entered into the asset gathering phase of life back in the 60s and 70s. Today this group has a shorter investment horizon and cannot afford the kinds of losses they could 20+ years ago.

The Shutdown and the Fed

Aside from a rebound against the oversold conditions, another dynamic that has the market in a more optimistic mood, at least for the near term, is the narrative that the government shutdown is good news for interest rates as it will likely keep the Federal Reserve on hold. Given that estimates are this shutdown will cost the economy roughly 0.5% of GDP per month, it would be reasonable for the Fed to stay its hand.

Inflation certainly isn’t putting pressure on the Fed. US Producer Prices fell -0.2% last month versus expectations for a -0.1% decline. The bigger surprise came from core ex-food and ex-energy index which fell -0.1% versus expectations for an increase of +0.2%. Keep in mind that core PPI declines less than 15% of the time, so this is meaningful and gives Powell and the rest of the FOMC ample cover to hold off on any hikes at the next meeting.

US import prices fell -1% month-over-month in December after a -1.9% decline in November, putting the year-over-year trend at -0.6%. That’s the first negative year-over-year print since August 2014. Yet another sign that inflation is rolling over.


Economy Flashing Warning Signs

Despite all the hoopla earlier this month over the December’s job’s report, this month’s Job Openings and Labor Turnover Survey (JOLTS) report showed that for the first time since the end of 2017 and just the 6thtime in this business cycle, hirings, job openings and voluntary quits fell while layoffs increased in November.

By digging further into the details of the Household survey as well we see that people holding onto more than one job rose +117k in December, accounting for over 80% of the total employment gain. On top of that, the number of unincorporated self-employed rose +126k. These two are things we normally see when times are tough, not when the economy is firing on all cylinders. Not to be a Negative Nancy or Debbie Downer here, but the prime-working-age (25-54) employment shrunk -11k in December on top of 48k the month before. This was before things started to get really scary for many workers with the government shutdown. Imagine how many more are now looking for a second job to make ends meet while they wait for those inside the beltway to work this mess out.

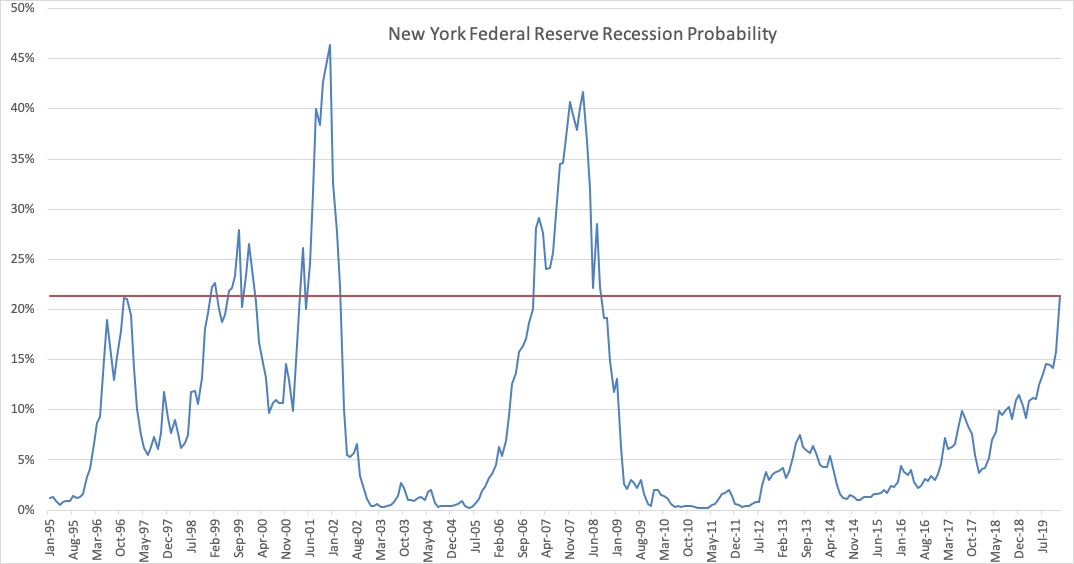
We also got a materially weak New York Empire Manufacturing survey report this week that saw New Orders decline for the second consecutive month and a sharp drop in the 6-month expectation index. The New York Federal Reserve’s recession risk model is now placing odds of a recession by the end of 2019 at over 21%, having more than doubled since this time last year and having reached the highest level in 10 years. Powell and his team at the Fed have plenty of reasons to hold off on hikes. I wouldn’t be surprised if their next move is actually to cut.


NY Fed Recession Probability


Risks, what risks, we don’t see no stinking risks

US economy isn’t as strong as the headlines would make you think. The political dialogue going back and forth while on the one hand entertaining in a reality TV I-cannot-believe-he/she-just-said-that kind of way isn’t so funny when we look at the severity of problems that need to be addressed – excessive debt loads, a bankrupt social security program, a mess of a healthcare sector – just to name a few. The market today isn’t pricing much of this in, and based on the year to date move in the major market indices, particularly not the potential economic damage the government shutdown if the situation worsens.

If we look outside the US, the market’s indifference is impressive. UK Prime Minister Theresa May’s Brexit plan suffered a blistering defeat in Parliament, the largest such defeat on record for over 100 years, leaving the entire Brexit question more uncertain than ever and it is scheduled to occur just over two months away. In the two days post the Brexit vote back in 2016 the Dow lost 870 points and the CBOE Volatility Index (VIX) rose 49%. This time around the equity markets were utterly disinterested and the VIX actually fell 3.5% – go figure. A messy Brexit has the potential to have a material impact on global trade and yet we basically just got a yawn from the stock market.

Over in Europe flat is the new up with Germany’s GDP expected to come in every so slightly positive and this is a nation that accounts for around one-third of all output in the euro area – with China a major customer. Overall, Eurozone imports and exports fell -2% in November.

The other major exporter, Japan, just saw its machinery orders fall -18.3% in December after falling -17% in November. Japan already had a negative GDP quarter in Q3 and the latest data we’ve seen on income and spending aren’t giving us much to be positive about for the nation.

The Trade War continues with some lip service on either side occasionally giving the markets brief moments to cheer on some potential (rather than actual) signs of progress. The overall global slowing coupled with the trade wars is having an effect. China’s exports for December were far worse than expected, -4.4% from year-ago levels vs expectations for +2%. Last week Reuters reported that China has lowered its GDP target for 2019 to a range of 6% to 6.5%, which is well below the 6.6% reported output gain widely expected last year which itself is the weakest figure since 1990. Retail sales growth has fallen to a 15-year low as auto sales contracted 4.1% in 2018, the first annual decline in 28 years. With a massive level of leverage in its economy, banking assets of $39.1 trillion as of Sept. 30, and nearly half of the $80.7 trillion 2017 world GDP, (according to the World Bank) waning economic growth could be a very big problem and not just for China. We’ll be watching this as it develops given our Rise of the New Middle-class and Living the Life investing themes.

The bottom line is we’ve been seeing the markets bounce off seriously oversold conditions after a breathtakingly rapid descent. The fundamentals both domestically and internationally are not giving us reason to think that this bounce is the start of another major bull run. With all the uncertainty out there, despite the market’s recent “feel good” attitude, we expect to see rising volatility in the months to come as these problems are not going to be easily sorted out.


Weekly Issue: Thematic M&A and Adding Back a Digital Infrastructure Position

Weekly Issue: Thematic M&A and Adding Back a Digital Infrastructure Position

Key points inside this issue

  • Despite the stock market’s year to date gains, concerns remain for December quarter earnings season
  • Thematic M&A was rampant in 2018
  • Our price targets on AMN Healthcare (AMN), Chipotle Mexican Grill (CMG) and Netflix (NFLX) remain $75, $550 and $500, respectively.
  • Putting shares of Guilty Pleasure thematic leader Altria (MO) on watch
  • We are issuing a Buy on and adding back shares of Digital Infrastructure company, USA Technologies (USAT), to the Tematica Select List with a price target of $10.


Despite the stock market’s year to date gains, concerns remain for December quarter earnings season

Over the last week, stocks continued to move higher placing all the major domestic stock market averages higher. Quite the turn from what we saw in much of the December quarter that evaporated all of 2018’s gains. Part of the rebound reflects the harsh beating that many stocks received as investors came to grips with the various factors that I’ve been discussing here over the last two months. The down and dirty summation of those factors is this: the global economy continues to slow and it is raising questions over not only GDP prospects for the coming year but also earnings.

Stoking those earnings growth concerns were negative pre-announcements from Apple (AAPL), Samsung, LG, Macy’s (M), Target (TGT) and Kohl’s (KSS) over the last two weeks. That combination points to slower smartphone demand, but I continue to see it picking up in the coming quarters as the Disruptive Innovation that is 5G ripples its way across our Digital Infrastructure and Digital Lifestyle investing themes.  This week we can add Delta Airlines (DAL), Dialog Semiconductor (DLGNF), Nordstrom (JWN), Electronics for Imaging (EFII), Sherwin Williams (SHW) and Ford Motor Company (F) to that list as well as earnings misses from Wells Fargo (WFC), BlackRock (BLK) and others. Not exactly a vote of confidence for the December quarter earnings season.

Adding fuel to the uncertainty, this morning rail company Genesee & Wyoming (GWR) reported traffic volumes for December fell 4.8% year over year. That piles on the limited data we are getting, which included the January reading for the Empire State Manufacturing Survey General Business Conditions Index that fell to 3.9 from 11.5 in December. That drop was led by a deceleration in new orders, inventories, and the number of employees. The survey’s six-month outlook also dropped, falling to 17.8 from 30.6 last month. These data points fit the view that there is a slowdown in manufacturing activity, which has piqued concerns about a broader slowdown in economic activity unfolding in 2019.

On top of that, yesterday Sen. Chuck Grassley said U.S. Trade Representative Robert Lighthizer saw little progress on “structural issues” in last week’s talks with China. These issues include intellectual property, stealing trade secrets, and putting pressure on corporations to share information with the Chinese government and industries. These issues are the very ones I was concerned about in terms of the trade negotiations. With China cutting its growth forecast some days ago to 6% from 6.5% and more data pointing to that economy cooling, there is likely room for the trade talks to include those issues, but my concern remains the ticking timeline until tariffs jump further. If that comes to pass, it would be another headwind to the global economy and corporate earnings for the coming quarters.

Given all of that, I remain concerned with the December quarter earnings season that will kick into gear next week and what it could do for the stock market’s recent rebound. We’ll continue to keep the long position in ProShares Short S&P 500 (SH) in play as we watch and listen to the thematic signals we see. One great thematic signal this week for our Guilty Pleasures investing theme is that Pizza Hut, owned by Yum Brands (YUM) is expanding beer delivery to 300 restaurants across seven states later this month. Amazing to think that only now Pizza Hut is realizing one of the great culinary pairings of Pizza and beer as it looks to offer customer one-stop shopping as well as capture that incremental revenue and profits. Odds are there will be some element of our Digital Lifestyle theme at play, given the push toward mobile orders we are seeing across the restaurant industry. Now to see what beer they offer… hopefully, it will be more than just the big brand beers like Budweiser.

Another signal that points to the bleeding over of our Digital Lifestyle, Disruptive Innovators and Aging of the Population themes is the partnering between Walgreens Boots Alliance (WBA) and Microsoft (MSFT). Over the next several years, the two will research and develop new methods of delivering healthcare services through digital devices, including virtually connecting people with Walgreens stores.

We at Tematica see thematic signals for our 10 investing themes practically everywhere… and that means we will continue using them to build and refine our investing mosaic in the days, weeks and months ahead. As we navigate the next few weeks, we may have a change or two on the Thematic Leaders and a few companies that make it onto the Contender List for when the stock market finds its footing.


Thematic M&A was rampant in 2018

Over the last two weeks, we here at Tematica have been reviewing the thematic database of more than 2,400 stocks that we’ve ranked based on their exposure to our 10 investment themes. That was no small project let me tell you, and it was a key initiative for 2018. In looking back over that body of work, I noticed more than a dozen companies that were in the database at the start of last year had been acquired during the second half of 2018. Here’s a short list of what I’m talking about:

As you can see, the acquisition activity was spread across a number of our themes and included both strategic and financial buyers. In each case, the buyer looked to fill a competitive hole be it a product, market or technology. That’s the classic finance take on it, but we know those buyers were looking to solidify their exposure to the thematic tailwinds that are powering their businesses or in some cases expose themselves to another one.

Are we likely to see more thematically based M&A in the coming months?

My view is yes, particularly as the global economy slows and companies look to deliver top and bottom line growth be it on an organic or acquired basis.

Adding back shares of Digital Infrastructure company USA Technologies

Today I am calling shares of mobile payments company, USA Technologies (USAT),  back onto the Tematica Select List following news earlier this week about the results of an internal investigation into its accounting practices. You may recall that last year, USAT shares were a high flyer for the Select List. However, upon learning that the USAT board would conduct an internal investigation into the accounting of certain of its present and past contractual arrangements and its financial reporting controls and would miss filing the company’s 10-K, we smartly jettisoned the shares near $10.25 last September.

We had been trimming the position at higher levels near $14 in the preceding months, but in light of those developments we “got out of Dodge”, so to speak, and did not stick around for the free fall to $3.44 by early December. While we continued to see growing adoption of mobile payments, especially at USAT’s core market of vending machines and unattended retail, we also saw the stock price pain associated with these investigations and potential financial restatements. “No thanks” was my thinking.

The company on Monday announced both the findings of its internal investigation and remedial actions to be implemented by the board. It also shared that it is working to file its 10-K as soon as possible and disclosed the departures of both its chief financial officer (CFO) and chief services officer (CSO). In tandem with those announcements, USAT also shared it is in negotiations for a new CFO.

In terms of the investigation and the planned responses, the company’s Audit Committee found that, for certain transactions, USAT had prematurely recognized revenue and, in some cases, the reported number of connections associated with the transactions under review. The committee went on to recommend the company enhance its internal controls and its compliance and legal functions; expand its public disclosures; and consider appropriate employment actions related to certain employees as well as splitting the roles of chairman and CEO.

These measures, along with the departure of the CFO and CSO, are not surprising, but they do put USAT on the path to restoring investor confidence in its reporting. While this investigation was happening the market for mobile payments continued to be on a tear as companies such as PepsiCo (PEP) inked a new five-year agreement with USAT.

Clearly, there is more work to be completed, and there is the risk that we are re-entering these shares on the early side. However, as we have seen in the past, as these clouds lift investors will focus on the tailwinds of the business, which in this case are centered on mobile payments and are improving. Therefore, we will resume ownership of USAT shares and look to scale on potential stock price weakness when the company formally restates its revenue and other key metrics. Better a bit early than too late is my thinking on this one.

Our previous price target on USAT shares was $16. However, we should prudently assume that several of the underlying financial metrics will be restated lower. Consequently, I’m taking a haircut relative to our prior target and putting out a new price target of $10. As the company releases its updated financials, I’ll look to fine-tune that price target as needed

  • We are issuing a Buy on and adding back shares of Digital Infrastructure company, USA Technologies (USAT), to the Tematica Select List with a price target of $10.


The Thematic Leaders

As the stock market moved higher week over week as of last night’s close, we saw several Thematic Leaders move higher. These included Aging of the Population leader AMN Healthcare (AMN), and Clean Living leader Chipotle Mexican Grill (CMG) as well as Thematic King Amazon (AMZN). The big winner, however, was Digital Lifestyle leader Netflix (NFLX), which yesterday announced it would boost prices for its monthly memberships by 13% to 18%. This marks the company’s biggest price increase and I suspect was well thought out by the management team, given the increasingly competitive playing field. That price increase should drive Wall Street’s revenue expectations higher and improve its ability to not only spend on proprietary content but also its ability to service its quarterly debt costs.

  • Our price targets on AMN Healthcare (AMN), Chipotle Mexican Grill (CMG) and Netflix (NFLX) remain $75, $550 and $500, respectively.


Putting Altria shares on watch

Even though we’re just a few weeks into 2019, shares of Guilty Pleasure leader Altria have been underperforming on both an absolute basis and a relative one compared to the S&P 500. Weighing the shares down are questions over its ability to recoup the $12.8 billion investment for a 35% stake, in e-vapor market leader Juul Labs (JUUL). While this is part of the company’s efforts to reposition itself, given prospects for continued declines in its core tobacco market, complicating things is the FDA’s move to stub out youth access to e-vapor and flavored cigarettes.

Odds are this will take several years to come about but it raises questions as to whether Altria is trading one shrinking market for another. Candidly, I would have preferred Altria take that $12.5 billion and spread it across several cannabis investments. I’ll continue to be patient for now with this thematic leader, however, I’ll be looking at several in the coming days that could offer a far better risk to return tradeoff.


Debt Bombs Ticking Across the Globe

Debt Bombs Ticking Across the Globe


There are times when writing from the macro perspective can be challenging, particularly when macro takes a backseat as it is prone to do during parts of the business cycle. This year macro is back with a bang.

JPMorgan recently assessed the chance of a recession in 2019 has risen to 35%from just 16% in March based on macro data alone. The markets realize that the underlying dynamics have changed and are grappling with what to expect next:

  • As we mentioned last time, in 2017 only 1 of the 70 asset classes Deutsche Bank tracks closed in negative territory despite many being inversely correlated – clearly a market behaving oddly. As of mid-November, 90% were in the red for 2018 as the overexuberance of 2017 is forced to pay the piper.
  • In 2017 44 of the 47 country stocks in the global MSCI index closed up for the year. As of the December 11thclosing, only 3 are in the green.
  • The suppressed volatility in 2017 has led to hyper in 2018 as the S&P 500 has lost 3% or more in three market sessions this year with not one gain of 3% or more, a dynamic which last happened in 1936. The Dow Jones Industrial Average has experienced four days of 3%+ losses and no daily gains of that magnitude, a dynamic which last happened in 1897. (Hat tip to David Rosenberg of Gluskin Sheff)

Market dynamics are reflecting the increase in macro/political volatility across much of the world, but the headlines have yet to catch up with the primary drivers underlying the deep changes. In our previous Context & Perspectives piece, I discussed how we are seeing a profound decline in the level of liquidity at a time when debt levels are back to record highs. This week is a highlight reel of warning signs in the context those record levels of debt.

  • US employment
  • US Treasury balance sheet and yield curve inversion
  • Oval Office produces day time TV level drama
  • US China Trade War
  • UK Brexit Drama Spikes
  • Paris on Fire
  • Italy sees an opportunity


USA Employment Picture

Last Friday’s Nonfarm payrolls were significantly below expectations at +155k versus expectations closer to +200k on top of downward revisions of 12k to the prior two months. That’s not great, but amidst all the hype around this being a phenomenally strong economy, the workweek shrunk to a 14-month low of 34.4 hours from 34.5 in October. That translated effectively into 370k jobs lost, which means that the real picture for employment was a net loss of -215k (+155k new payroll -370k from shortened work week). The -0.2% decline in aggregate hours worked, the second decline in the past three months, means that unless there was a big jump in productivity, output, aka real economic activity, contracted for the month.

We also saw a decline in earnings with average weekly income falling -0.1% given the decline in the average workweek and an increase of hourly earnings of +0.2% versus +0.3% expected. This is the first decline in weekly earnings in 2018 and may call into question the expectations around Christmas shopping.

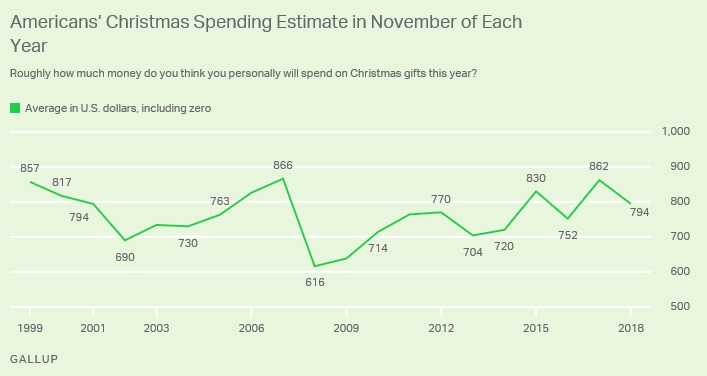
The recent University of Michigan Consumer Sentiment survey found that an increasing number of respondents are expecting unemployment to be higher in the next twelve months than lower and a recent Gallup poll found that Americans plan to spend less on holiday gifts today than they expected back in October and less than they expected to spend in 2017. The $91 decline in expected spending since October is, “one of the steeper mid-season declines, exceeded only by a $185 drop that occurred in 2008, as the Wall Street financial crisis was unfolding, and a $102 drop in 2009 during the 2007-2009 recession.” The environment is changing.

Putting it all together, last month saw a contraction in the workweek, in the index of aggregate hours worked and in average weekly earnings – not exactly a story of a robust economy despite the headline 3.1% year-over-year rise in average hourly earnings, the strongest read since 2009. Digging into the details can give a different picture.

Earlier this week the JOLTS (Job Openings and Labor Turnover Survey) saw the number of job openings increase in October to 7.08m from September’s 6.96m, but still below the August peak of 7.29m. The number of voluntary quits declined to a 4-month low. This was likely thanks to, per data from the Atlanta Fed Wage tracker, ‘job switchers’ and ‘job stayers’ enjoying the same wage gains for the first time in three years. This is an indicator of rising wage pressures which puts pressure on margins at a time when as the FT put it, “Cracks in the corporate debt market begin to show.”

October also saw a greater-than-expected increase in consumer credit to $25.4b versus the $15b driven largely by student debt and auto loans – debt, debt and more debt.

Over the past few weeks your Tematica Research team has called out some Thematic Signals here, here and here that illustrate between the impact our Aging of the Population and the Middle Class Squeeze investing themes, many American consumers continue to struggle.


US Treasury Balance Sheet and Yield Curve Inversions

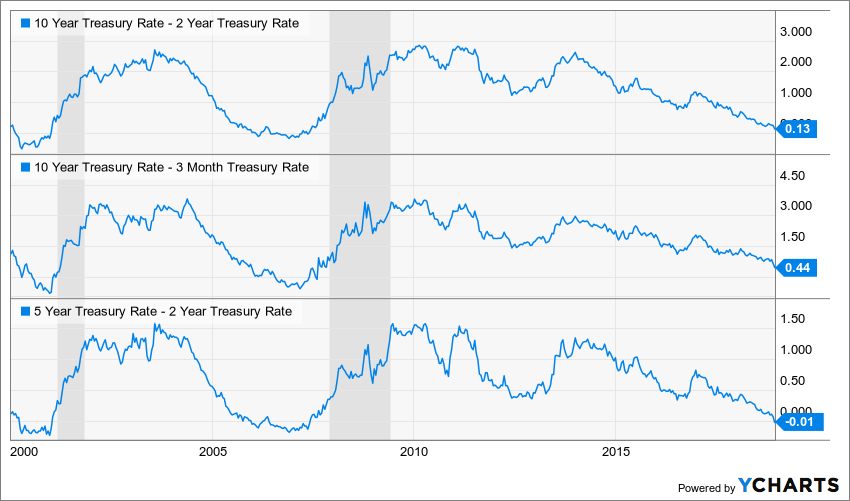
This week’s CPI report was in line with expectations at 2.2% year-over-year and showed inflation that is high enough for the Federal Reserve to proceed with another rate hike this month, but the bond yield landscape is changing. On December 3rd, the 3-year Treasury note yield exceeded that of the 5-year for the first time since 2007, which is known as a yield curve inversion. As of December 12th, the 5-year yield sat below the 2-year. The spread between the 10-year and the 2-year is at a level not seen since 2007 and is close to inverting as well. The spread between the 10-year and the 3-month (which is closely watched as a recessionary signal) has plummeted from 136 basis points in February to just 44 and been cut in half in the past month alone. This has the Federal Reserve’s attention.


As a reluctantly avid Fed watcher, (I wish monetary policy wasn’t such a driving force in the global economy these days) I’d be remiss if I didn’t point out this fascinating tidbit. On June 27, 2017, when the VIX Volatility Index sat at 11, US Federal Reserve Chair Janet Yellen said,

“You know probably that would be going too far but I do think we’re much safer and I hope that it will not be in our lifetimes and I don’t believe it will be.”


On Tuesday December 11th, 2018 (532 days or 1.46 years later) when the VIX sat at 22, now former US Federal Reserve Chair Janet Yellen said on CNBC,

“I’m not sure we’re working on those things in the way we should, and then there remain holes, and then there’s regulatory pushback. So I do worry that we could have another financial crisis. ″

You can’t make this stuff up.

On top of raising rates to tighten financial conditions, the Federal Reserve tapering has reduced its balance sheet by 8.3% since its tapering program commenced 13 months ago – that’s a solid level of liquidity drain as we’ve discussed in our last Context & Perspective piece.

The futures market is now pricing in less than 20 basis points of rate hikes next year versus over 55 basis points just a few months ago.

Oval Office Drama

Just when you thought the acrimony inside the beltway could not possibly get worse, it did. On Tuesday December 11thPresident Trump and Vice President Pence met with House Minority Leader Nancy Pelosi and Senate Majority Leader Chuck Schumer in the Oval Office while the network TV cameras rolled to discuss the impending government shutdown.

If this is a preview of what we can expect in the next two years with a divided government, the markets are right to be concerned with Capitol Hill’s ability to take constructive action if/when the economy slides into a recession let alone deal with the immediacy of a potential government shutdown which would leave federal employees without a paycheck at Christmas.

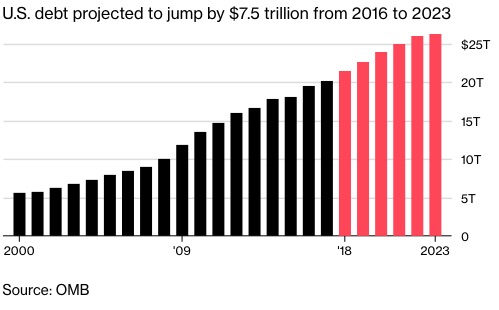
At a time when corporate balance sheets are the weakest they’ve been since the financial crisis, the federal deficit is at a percent of GDP not seen outside of a war or a recession. Total public debt outstanding has risen by $1.7 trillion (or 6.6%) since the start of the year. The current debates in DC are not focused on reducing the deficit, but rather a battle over where to spend. This means we are likely to see a greater supply of Treasury bonds on the market in the coming year(s) to compete with the high level of corporate debt that will need to be refinanced as we discussed in our last piece.


This level of dysfunction is particularly concerning when we look around the world and see political volatility outside the US also reaching heights rarely seen. Keep in mind that during the prior financial crisis leadership in much of the world’s leading nations were much more stable. The bottom line here is the current market volatility doesn’t fully reflect the heightened political risks emerging.


US China Trade War

The trade war between the US and China has seen some major fireworks over the past few weeks from the arrest of China’s Huawei’s CFO Meng Wanzhou to Canada granting her bail to rumors that China plans to submit a proposal to reduce its 25% surcharge on US-made vehicles. One day it is acrimony, the next rumors of attrition. What we do know is that China’s economy is weakening, (China imports rose just 3% year-over-year versus expectations for 14%) and the trade wars are having an impact on both nations. Regardless of one’s political preferences on this topic, when the two largest economies in the world go head-to-head, it is going to have a negative impact on global growth in at least the near-to-medium term.

Tying this back to the debt issue, given China’s black box economy with data tightly controlled by its government, it is impossible to have accurate data on just how high the nation’s debt level has reached. Estimates are that China’s total debt has hit more than 300% of GDP(according to the Institute of International Finance), versus the “official’ level of 47%, and Chinese distressed assets have grown by over 25% in the 18 months according to data from PwC.

China’s economic growth has been heavily dependent on ever-rising levels of debt and is showing signs of stumbling. As the world’s second largest economy, when China struggles the world will feel it.

UK Brexit Drama Spikes

The UK was not to be outshined by this week’s Oval Office “disagreement” as its political strife spiked when Prime Minister Theresa May postponed the Parliamentary vote on the agreement she reached with the European Union on fears that it had a snowball’s chance in hell of passing. The EU leaders insist that there will be no fundamental changes made and the Prime Minister survived a vote of no confidence in her leadership the night of December 12thas euro-skeptic MPs attempted a coup against her to wrest control of the final 106 days of Brexit talks. She was forced to agree to not lead the Tories into the next election, which puts her at risk of becoming a lame duck like her German counterpart, Angela Merkel.

We are quickly moving towards the worst of all possible outcomes, at least in the near-to-medium term, with no deal between the European Union and the United Kingdom and the UK lacking any strong leadership as it sails into uncharted political territory. All this uncertainty it a major headwind to economic activity on both sides at a time when people in the UK and the EU are increasingly angry over the lack of improvement in household finances as it has also been struggling under the Middle Class Squeeze. Voters will be looking for more rather than less government spending if/when their respective economies weaken, which means even more debt in a world awash with it.

Paris on Fire

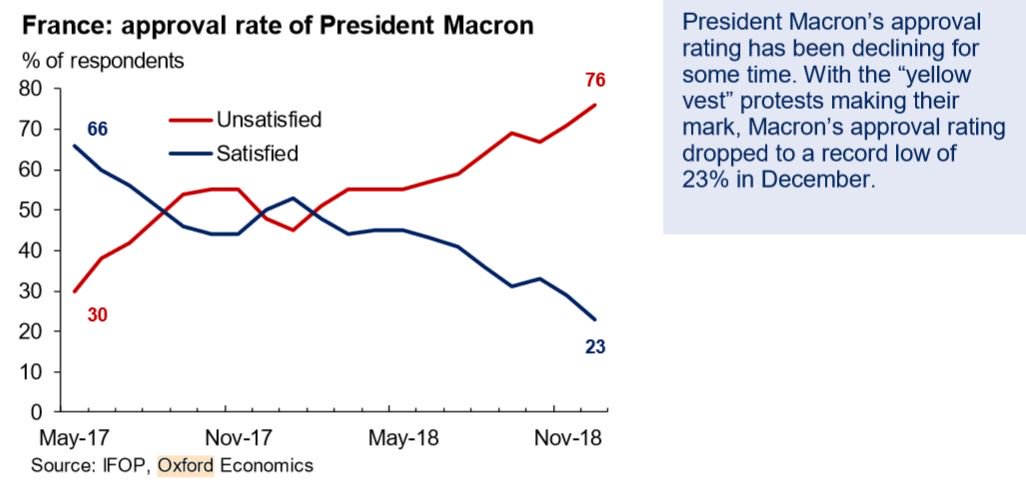
Over the past weekend Paris erupted into violent protests, the magnitude of which is under debate, but the result of which was a clear – a loss a political firepower for France’s President Macron as he agreed to roughly €10 billion in concessions, including a minimum wage hike and tax breaks for employers. Many in France have also been suffering from Middle Class Squeeze and are frustrated by their leaders’ ongoing inability to shift the economy into something that provides them with better opportunities. Their demands mean more government spending which means more debt.

France is now on track to have the biggest budget deficit in the EU next year and Macron’s credibility and political power have taken a serious blow. This is yet another dangerous blow to the European Union.


Italy Sees and Opportunity

While Paris was burning, Italy’s Matteo Salvini and Claudio Borghia were loving (and tweeting)  what this would likely mean for their budget talks with Brussels, who as you may recall had sent the Italian leadership back to the drawing board in Rome to hammer out a budget with a smaller deficit. To put their deficit in perspective, the rejected plan was for 2.4% of GDP versus the US on track this year for over 6.6%. The troubles in Paris may give Rome confidence to push back against Brussel’s demands as they meet on December 12th. Late on the night of Wednesday December 12thrumors started to fly that perhaps the Italians would reduce the planned deficit to 2% of GDP. Either way, Italy is facing a weak and weakening economy with nearly €200 billion of Italian bonds coming due next year that will need to be reissued in addition to its current deficit.

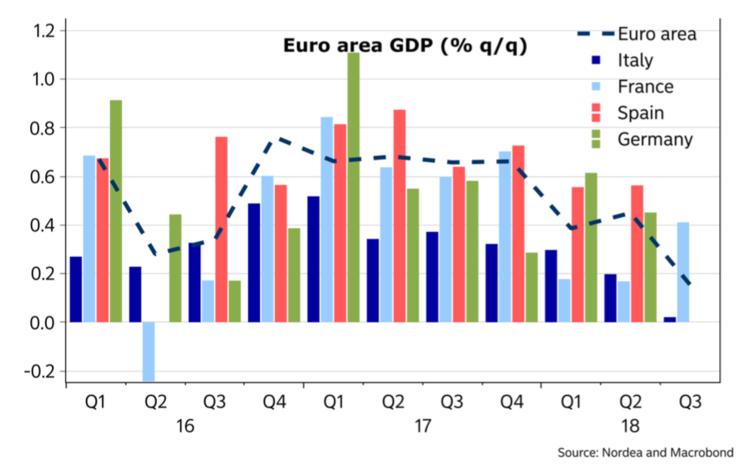
Fighting Brussels is one thing, but the debt markets are another thing entirely and they are not pleased with what they see as evidenced by the widening spread between the Italian and the German 10-year, which has reached the highest level since the worst of the eurozone crisis. Moody’s has downgraded Italy’s rating to Baa3 while S&P and Fitch held their ratings but downgraded the nation’s outlook. If Italy’s economy weakens further, and its economy already contracted by -0.1% in the third quarter versus the prior, it could lose its investment grade standing which would have a major impact on bond markets as Italy’s external debt was $2.5T at the end of 2017.

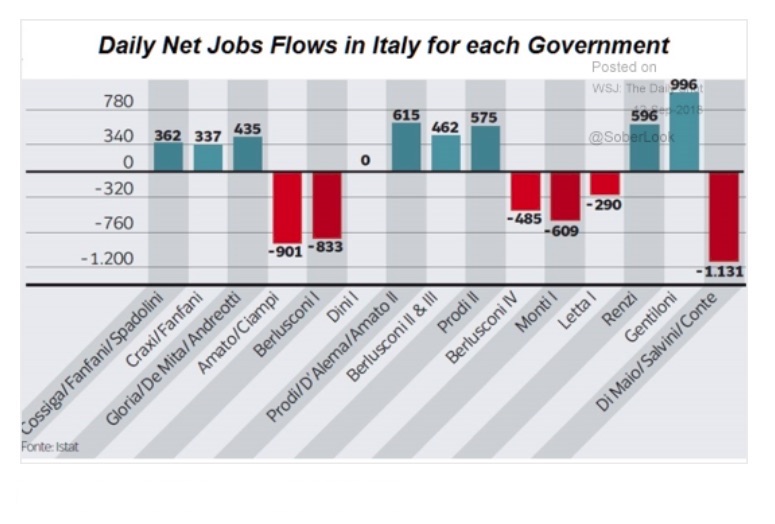
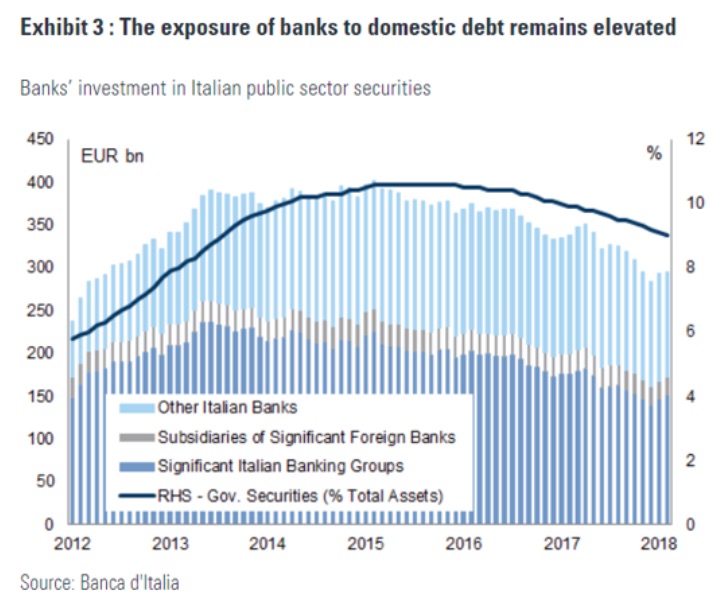
When it comes to the problems arising from Aging of the Population and the Middle Class SqueezeItaly is in even worse shape than the United States and its banks still hold an elevated level of domestic debt. The employment situation is worsening.

The banking sector is quite vulnerable.

Italy, like France and the UK, is facing voters who a frustrated with the lack of improvement in the household finances and the populist movements sweeping across them are looking for governments to spend their way into national prosperity. Neither Italy, France, Germany nor the UK have strong or stable political leadership and GDP growth is faltering. This is not good.

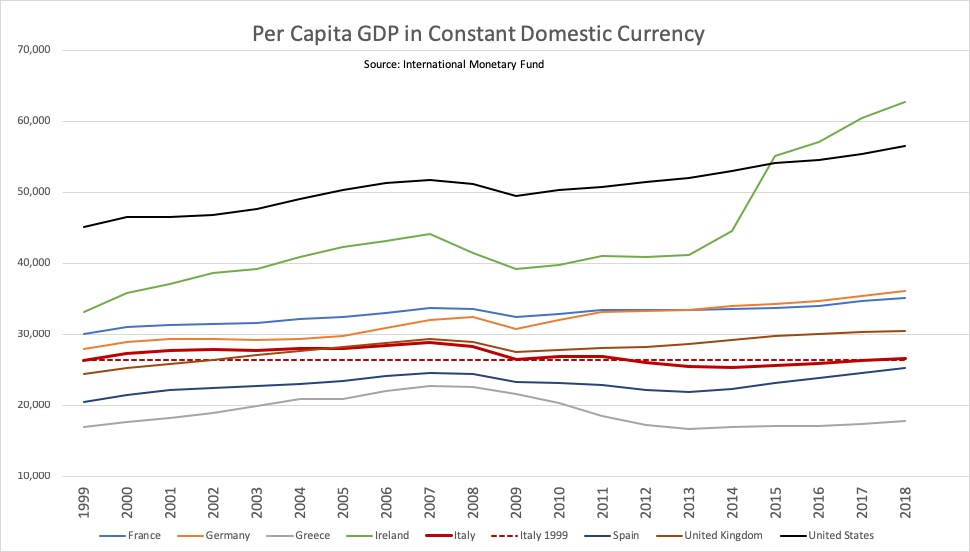
According to data from the International Monetary Fund’s October 2018 Edition of the World Economic and Financial Survey, since the inception of the unified currency, Italy has seen all of a 1% increase in its per capita GDP (as measured by chained domestic currency) while even beleaguered Greece has enjoyed a 5% increase. On the other end of the spectrum Ireland has seen its per capita GDP nearly double with an increase of 89%, Germany is in second place with a 29% improvement while the US and the UK both have seen a 25% improvement. Is it any wonder that voters in Italy are becomingly increasingly skeptical of the euro?


Putting it all together

In our last Context & Perspective piece I discussed how we are seeing a profound decline in the level of liquidity at a time when debt levels are back to record highs. In this week’s piece, I discuss the trends across major parts of the world that are likely to lead to even more debt. We look to be in the final innings of what the master investor Ray Dalio of Bridgewater Associates refers to as the debt super-cycle. These cycles tend to run 50-75 years and we are today at the far end of that range with excessive leverage across much of the world, highly concentrated lending portfolios and a mismatch between assets and liabilities and/or liabilities and asset cash generation potential.

We’ll be talking about this more in the coming months but before then, I highly recommend Mr. Dalio’s free book on how to navigate a debt crisis, which you can get a copy of here. The impact of all this debt on the economies of the world will have a profound impact on tomorrow’s investable markets.


While The Market Regained Some of Its Footing, It’s Shaky At Best

While The Market Regained Some of Its Footing, It’s Shaky At Best


Key Points from This Report:

  • Did the election matter?
  • Italy is a growing problem for the Eurozone and U.S. Investors should care
  • The rising dollar and interest rates
  • Another strong jobs report – be careful what you wish for
  • More signs that the global economy is slowing
  • The trade war with China continues with no end in sight.
  • The Market has found at least some shaky footing


Did the Election Matter?

The big news of the week was the non-news of the election, which gave both sides sufficient wins to claim victory. The market engaged in what was likely a brief “thank-God-there-were-no-surprises-this-time” rally the following day. For investors, the election means that any further tax cuts are highly unlikely and while the need for infrastructure spending is something both parties agree on, the budget process for that spending has the potential to be reminiscent of a Jerry Springer episode – let the games begin.

We’ll probably hear more threats concerning impeachment, but the election results make it unlikely that will be anything more than the usual vitriol coming out of the beltway these days. Overall the election ended up being a non-event, followed by a relief rally… but several issues remain that could complicate matters for the market and investors.


Italy is a growing problem for the Eurozone and U.S. Investors should care

Italy continues to vex both the eurozone and those pundits who insist that cooler heads will prevail. I live a good portion of my time in Italy and I can assure you, there are no cooler heads in Italy’s leadership and its citizenry are becoming more and more enraged by their governments’ endless inability to address the myriad of issues facing the nation, regardless of which party or coalition is in charge. Keep in mind that Italy faces even more challenging demographics than the U.S., (which in comparison is akin to our Aging of the Population investing theme on steroids) as its population is skewed even older thanks to insanely high youth unemployment, which drives many of the young to look outside their birth country for better opportunities.

The U.S. isn’t alone in its desperate need for infrastructure investment. Remember that bridge in Genoa, Italy that collapsed in August killing 43 people? Despite the promises in the days following the tragedy that the nation’s leadership would mobilize all available resources immediately and get a new bridge for this vital part of the region’s infrastructure up as soon as humanly possible, nothing has been done.

Not.

One.

Damn.

Thing.

And that is just a bridge. Last week the nation was hit with massive storms that caused an incredible amount of damage, inflicting even more pain on a country that is already a mess. I expect Italy will not be the one to blink first when it comes to the revised budget due to Brussels later this month. There will be a showdown with the rest of the Eurozone and it is going to get even messier.

For some perspective, just 10 years ago Luigi Di Maio, the leader of the Five Star Movement and Deputy Prime Minister, was living with his parents and working as a drinks server at the Napoli stadium. In just 10 years he’s gone from one of those guys walking around, hocking drinks from his tray, to leading Italy. Is it any wonder that the rest of Europe’s leadership isn’t exactly thrilled with Italy’s leadership choices?

Adding to the drama, France’s leader, Emmanuel Macron, looks to be struggling under all the pressure and Germany’s Angela Merkel is now a lame-duck having announced she is stepping down as the leader of her party and will not be seeking reelection. Europe is without strong leadership at a time when it desperately needs it. This is going to get worse before it gets better.

Why should investors care what happens in Italy?

The eurozone economy is nearly the size of the United States’ and Italy is both too big to save and too big to fail without putting the entire region into an economic tizzy. Italy has the potential to seriously rock the markets at a time when interest rates are rising most everywhere, and dollar liquidity is shrinking.


The rising dollar and interest rates

With global liquidity shrinking at the fastest pace since 2008, the dollar continues to strengthen, causing a variety of problems for a broad swath of market participants. The strong dollar has been causing pain in the commodity complex and those economies tied to it, for example, this week U.S. West Texas Intermediate (WTI) crude fell more than 21% from last month’s four year high. The recent strong jobs reports mean the Fed is likely to continue on its rate hike path and Thursday’s post-meeting announcement referred to a strengthening labor market and economic activity rising at a strong rate – pretty much like the Bat-signal for more hikes coming. The lack of foreign buyers of Treasury auctions is adding to rate pressures. So far in calendar year 2018, we have seen half the level of foreign buying we saw in 2017.


Another strong jobs report – be careful what you wish for

Last month businesses added an additional 250k to the U.S. workforce, well above the expected roughly 200k, but the real number would have been even more incredible had it not been for the 198k that were not at work due to weather conditions – a level three times the historical norm thanks to Hurricane Michael. Without Mike, the number would have been closer to +400k, so while Wall Street is getting serious jitters as the bears have been pacing around the major indices, Main Street is busy hiring. Break out the champagne and party hats?

Err, not so fast. As much as I love a glass of the chilled bubbly, digging into the details gets me a bit nervous to see that while construction activity has been contracting for several quarters, the sector has added 100k to its ranks since July. Contracting activity levels while growing payrolls? Not exactly good for the bottom line. The Federal Reserve’s Beige book has been a compendium of executive angst over the impact of trade wars on their businesses, but transportation services grew their ranks by 25k, the most in 13 months. This is likely because 100% of the net new jobs over the past four months have gone to those with a high school education or less. Great for the development of skills in that cohort, not so great for their employers who are experiencing lower productivity levels, which translates into earnings pressure for investors.

Cocktail Investing Podcast Episode 85We also saw wages rise +3.1% year-over in October from +2.8% in September, the fastest rate since 2009. We suspect consumers in our Middle-class Squeeze investing theme are cheering as are retailers that are gearing up for the 2018 holiday shopping season – for more on that, check out this week’s Cocktail Investing Podcast where we talk with the National Retail Federation and its consumer survey findings for holiday shopping this year.

Back to the October wage gains, we strongly suspect the Fed is watching as increased pay pressures have pulled 711k into the workforce, which pushed the labor force participation rate up by +0.02% in October. Without the new entrants into the workforce, the unemployment rate would have dropped to 3.3%, which would be the lowest level in 65 years!

So, jobs look fantastic right? Errrmmmmm, yes but… the manufacturing workweek was cut a second time by 0.2% since June to the lowest number of hours since January – could be the trade war is cutting folks’ hours. Overall, the labor market is exceptionally tight so no wonder the Fed this week announced that “The labor market has continued to strengthen and … economic activity has been rising at a strong rate,” keeping in place its plan to continue to gradually raise rates.


More signs that the global economy is slowing

While the US is still humming along, most are not paying attention to the slowing happenings outside our borders. The IHS Markit Composite PMI in the euro area dropped to a 2-year low of 53.1 in October from 54.1 in September while Italy dropped to its lowest level since November and is now in contraction territory- anything below 50 is in contraction. Germany’s real manufacturing orders year-over-year declined -2.2%. Eurozone GDP slowed to a 5-year low in Q3 of a less than +1% annual rate. The US will not be unaffected by the slowing outside its borders.


The trade war with China continues with no end in sight.

We’ve already talked a lot about this in previous weeks, so we will just leave this one with a note that China is looking to regain its place as the world’s dominant nation and its leader has his job for life. The strange events surrounding many high-profile people ranging from the leader of Interpol to actress Fan Bingbing to Alibaba’s Jack Ma give the impression that some seriously strange things are going on in the nation and perhaps the CCP leadership is looking to close ranks and tighten its grip – there is going to be a lot more to this story in the months and years to come.


The Market has found at least some shaky footing

Finally, after a brutal October, the market has managed to regain some of the ground it lost in the early days of November but let me point out that it is unusual for the S&P 500 to lose 10% or more twice in any given year. Going back roughly half a century, such double dipping typically precedes or occurred in conjunction with a recession, (with the exception of 1987 which wasn’t much fun).

As earnings season is nearing a close, corporate share buyback programs have been able to restart their purchases, helping put a (temporary?) floor under the market. I remain warry that we haven’t seen the end of this period of volatility.


Is Now the Time to Panic?

Is Now the Time to Panic?

What we are currently seeing in the market is a symptom of a whole lot of leverage in equities that had been in rich territory at a time when, even though it is still moving along, signs abound that the economy is slowing. Is this a ‘buy the dip’ opportunity or is it just the start of a much bigger downturn?

It has been a stormy week from the onslaught of hurricane Michael to the sea of red in global equity markets as the market shift we have been awaiting finally took hold. Wednesday the Dow lost over 800 points and had its worst day since February. The S&P 500 has had its worst losing streak in two years with over half of the S&P 500 at least two standard deviations below their 50-day moving average – the highest such percentage since March. A full two-thirds of the S&P 500 is now down 10% or more from their respective highs – that is a broad-based decline. The Russell 2000 has blown through all support levels down through its 200-day moving average. The once high-flying NYSE FANG+ Index has fallen more than 16% from its recent highs. All 65 members of the S&P 500 Tech sector closed in the red Wednesday, something we haven’t seen since the beginning of April.

Outside the US markets have been struggling even more – the US is just starting to catch up. Germany’s DAX is down to 6-month lows, the MSCI Asia-Pac Index hit a 17-month low, the Emerging Market index hit a 19-month low and 13 of the 47 members of the MSCI all-country index are down 10% or more year-to-date. Korea hasn’t seen a decline like this in 7 years. Taiwan hasn’t seen a decline of this magnitude in over 10 years. China’s Shanghai and Shenzhen Indices are at levels not seen since 2014. For those who regularly read on commentary on TematicaResearch.com, we’ve been pointing out for months that the large outperformance of US equities versus the rest of the world was unsustainable.


The big question on everyone’s mind now is, “Is this a ‘buy the dip’ opportunity or is this just the start of a much bigger downturn and what should we expect as we head into earnings season?”

Let’s start with earnings season which is likely to see the reporting quarter’s performance decent relative to expectations, so I’m not worried about meeting target numbers. What I am worried about is investor reactions and guidance. Since mid-September 48 of the S&P 1500 companies have reported and while their results relative to performance have been solid, only 10 companies have traded higher on their earnings day and the average stock has declined 3.8% on the day. This is an acceleration of the reactions we saw from investors last quarter.

Expectations are being adjusted. Over the past month, analysts have raised forecasts for 358 companies in the S&P 1500 and lowered them for 534 which is a net of 12.2% of the index adjusted downward, the most negative EPS revision spread since March 2017. We’d warned earlier in the year that the benefits from tax cuts and the massive injection of federal spending would likely translate into weakness in the later part of the year – well, here you have it. We are no longer seeing dramatic increases in earnings estimates while corporate guidance is slowing shifting to the downside.

Looking at factors affecting forward guidance, we are seeing rising costs across a broad range of inputs – energy, tight labor markets, higher interest rates and let’s not forget everyone’s favorite ongoing trade war. Earnings season also means that one of the major buyers of equities, companies themselves, is forced to sit on the sidelines for some time.

The big picture here is that global liquidity conditions have materially changed as central banks have shifted gears in an environment that is full of extremes.

  • Banks are shedding assets with several having announced layoffs in the credit loan groups as credit growth has been slowing.
  • China and Japan, two of America’s largest creditors to the tune of over $1 trillion, are reducing their exposure to Treasuries at a time when the nation is running fiscal deficits typically only seen during a war or major recession with debt to GDP reaching levels not seen since World War II.
  • This year the net flows into US mutual funds and ETFs is 46% below that experienced in the first three quarters of last year.


This contracting liquidity is occurring in the context of a variety of extreme conditions.

  • The recent tax cuts and federal spending boon represents the largest stimulus to the economy outside of a recession since the 1960s, that at a time when the economy is already above full employment.
  • We’ve seen an explosion in debt across the globe with the ratio of global debt to GDP rising from 179% in 2007 to 217% today, according to the Bank for International Settlements.
  • According to S&P Global Ratings, the percent of companies considered highly-leveraged (with debt-to-earnings ratio of 5x or more) has risen from 32% in 2007 to 37% in 2017 – so much for healthy balance sheets in the corporate sector.
  • Around 47% of all investment grade corporate debt is in the lowest category (BBB-rated) both in the US and Europe, versus just 35% and 19% respectively in 2007.
  • Total US non-financial corporate debt as a percent of GDP is near a post-World War II high.
  • The quality of corporate debt is at extreme levels as well with 75% of total leverage loan issuance in 2017 covenant-lite versus 29% in 2007.
  • There was an estimated $8.3 trillion in dollar-denominated emerging-market debt at the end of 2017, according to the Institute of International Finance, accounting for over 75% of all EM debt. According to Bloomberg, some $249 billion needs to be repaid or refinanced through next year with the US dollar having strengthened considerably against their local currencies, making that debt all the more expensive.
  • It isn’t just debt that is at extreme levels as the percent of household net worth in equities has never been higher.


The Bottomline on the Recent Market Turmoil

We’ve got a whole lot of leverage in the system with equities that had been in rich territory at a time when while the economy is still moving along, signs of slowing abound. Is this time to panic? Definitely not. The US stock market is getting in sync with what has been happening with yields, what is going on outside the US and with more realistic growth prospects. Both myself and Chris Versace, Tematica’s Chief Investment Officer, will be examining and re-examining thematic signals identify well-positioned companies in light of our 10 investing themes. This means being on the lookout for confirming data points that give comfort and conviction for positions existing Thematic Leader positions and opportunities to scale into them at better prices. It also means building a shopping list of thematically well-positioned companies to buy at more favorable prices.

This means asking questions like “Where will the company’s business be in 12-18 months as these tailwinds and its own maneuverings play out?”

A great example is Amazon (AMZN), which our regular readers know continues to benefit from our Digital Lifestyle investment theme and the shift to digital shopping, as well as cloud adoption, which is part of our Digital Infrastructure theme and with its significant pricing power, our Middle-Class Squeeze theme which focuses on the cash-strapped portion of the population. And before too long, Amazon will own online pharmacy PillPack and become a key player in our Aging of the Population theme. Amid the market selloff, however, the company continues to improve its thematic position. First, a home insurance partnership with insurance company Travelers (TRV) should help spur sales of Amazon Echo speakers and security devices. This follows a similar partnering with ADT (ADT), and both arrangements mean Amazon is indeed focused on improving its position in our Safety & Security investing theme. Second, Bloomberg is reporting that Amazon Web Services has inked a total of $1 billion in new cloud deals with SAP (SAP) and Symantec (SYMC). That’s a hefty shot in the arm for the Amazon business that is a central part of our Digital Infrastructure theme and is one that delivered revenue of $6.1 billion and roughly half of the Amazon’s overall profits in the June 2018 quarter.

At almost the same time, Alphabet/Google (GOOGL) announced it has dropped out of the bidding for the $10 billion cloud computing contract with the Department of Defense. Google cited concerns over the use of Artificial Intelligence as well as certain aspects of the contract being out of the scope of its current government certifications. This move likely cements the view that Amazon Web Services is the front-runner for the Joint Enterprise Defense Infrastructure cloud (JEDI), but we can’t rule our Microsoft or others as yet. I’ll continue to monitor these developments in the coming days and weeks, but winning that contract would mean Wall Street will have to adjust its expectations for one of Amazon’s most profitable businesses higher.

Those are a number of positives for Amazon that will play out not in the next few days but in the coming 12-18+ months. It’s those kinds of signals that team Tematica will be focused on even more so in the coming days and weeks.


WEEKLY ISSUE: Revisiting Aging of the Population theme and introducing a new position

WEEKLY ISSUE: Revisiting Aging of the Population theme and introducing a new position

Key points inside this issue

  • We are issuing a Buy on and adding shares of AMN Healthcare (AMN) to the Tematica Investing Select List with a price target of $75.

Today we complete the recasting of our 10 investment themes that we’ve undertaken over the last several weeks. That process has led to several new investment positions and today we have a new one as well as we revisit our Aging of the Population investing theme.

Stepping back a few paces, I recognize that we’ve introduced several new positions in as many weeks. Hang tight for a day or two, and I’ll share the logic behind what we’ve been up to, and I suspect you’re going to nod your head as you read it. For now, let’s get to Aging of the Population and that new pick.


There Is Just No Fighting Father Time

As we look around us, it’s rather obvious that people are living longer, which in many respects is a good thing, but those extra years have a significant impact on society. As we age our needs and abilities change, and with that so do the services and products that we consume.

According to a National Center for Health Statistics report released in 2016, the average life expectancy in the U.S. stands at 78.8 years on average, with women outlasting men by a few years 81.2 years of age vs. 76.6 years. By 2030, the Administration on Aging (AOA) estimates there will be about 72.1 million people aged 65 or older, more than twice their number in 2000. In 2010, the baby boom generation was between 46 and 64 years old, and that generation is now beginning to enter their 70s.

Over the next 13 years, all of the baby boomers will have moved into the senior generation, resulting in a major structural shift in demographics. From 2010 to 2030, the percent of the population over 65 will increase from 13 percent to 19 percent while the percent of the U.S. population aged 20-64, the primary working years, will decrease from 60 percent to 55 percent. The broadening of the upper age pyramid is poised to significantly impact demands on healthcare, housing and transportation and question the ongoing viability of social service programs like Medicare, Medicaid and Social Security. Ah, yes more fun times to be had in Washington over the next decade.


We in the United States are hardly alone in this demographic shift 

Canada, Japan, and most of Europe have an even higher percentage of their populations in the older age brackets. According to population projections from the United Nations published in its 2013 “World Population Ageing” report, the global population aged 65 and older will triple over the next 40 years, from 500 million in 2010 to 1.5 billion by 2050, thus doubling the share of this demographic across the world from 8 percent to 16 percent. There is a shift toward older age brackets in almost every country as people live longer and have fewer children. Digging into the specifics of that UN report one sees that:

  • Roughly 26 percent of Japan’s population is aged 65 or older, and 32.2 percent are expected to be senior citizens there by 2030
  • Germany has 17 million people who are aged 65 and older, and that number is expected to swell to 21 million by 2030.
  • By 2030, there are projected to be nearly 16 million retirees in Italy with 25.5 percent of Italian citizens anticipated to be 65 or older.
  • There are 8.4 million Spaniards age 65 or older, and they comprise 17.6 percent of Spain’s population. Those numbers are estimated to grow to 11.5 million in 2030 when this age group is expected to make up 22 percent of the population.

How does this stack up against what it used to be?

Per historical data from the UN, life expectancy was 65 years in 1950 in the more developed regions, as compared with 42 years in the less developed regions. (Note that the latter number was heavily skewed by higher child-mortality rates.) Between 2010 and 2015, these figures are estimated to be 78 years in the more developed regions and 68 years in the less developed regions. The gap is expected to narrow even further: By 2045 to 2050, life expectancy is projected to reach 83 years in the more developed regions, and 75 years in the less developed regions.

As the life expectancy gap narrowed between developed and less developed regions, the average age expectancy of both groups increased. The number of people 65 and older was 841 million in 2013, four times higher than the 202 million seen in 1950. This population is expected to nearly triple by 2050 when its number is expected to surpass the two billion mark. The proportion of the world’s 65-or-older population is expected to increase to 21 percent in 2050 from just 12 percent in 2013 and 8 percent in 1950.

This living longer is the basis for our Aging of the Population investment theme. It will lead to new products and services that cater to the needs of this increasing “older population ”demographic, but it also means greater demands on savings and investments. Unfortunately, according to a report by the Economic Policy Institute (EPI), the average household aged 56-61 has amassed a retirement nest egg of just $163,000 which equates to an average monthly income of just $681 across a 20-year retirement according to EPI. Worse yet, an estimated 41% of households aged 55-64 have no retirement savings at all and over 20% of married Social Security recipients and 43% of single recipients 65 and over rely on their monthly benefit checks to provide at least 90% of their income.

The big issue facing the nation is the assumption of a 20-year retirement time period when data from the Social Security Administration shows one out of every four 65-year-olds today will live past the age of 90, while one out of 10 will live past 95. It’s no wonder 60% of baby boomers claim they’re more afraid of outliving their savings than actually dying. This is a massive problem across much of the world as rising life expectancies place much greater strains on government managed retirement programs while the percent of the population paying into those programs declines. Payout levels are growing while relative contribution levels are declining.


Who will ride the Aging of the Population tailwind?

The bottom line with this massive worldwide demographic shift towards a more senior population is a reallocation of spending and consumption habits. Money that was once dedicated to supporting a young and growing family will increasingly shift toward spending that serves an aging population. Pronounced spending shifts such as these can have a dramatic impact and in this case, the snowballing of the “older population” likely means an even greater compounding effect will be had.

How big will this overall aging lifestyle-spending shift be?

According to research firm A.T. Kearny, worldwide spending (remember the aging of the population is global) by mature consumers is forecasted to reach $15 trillion annually by 2020. That’s a large opportunity for industries that are meeting the particular needs of consumers age 65 and older and with the aging population only expected to grow further between 2020 and 2030, spending by this cohort will grow substantially in the coming decade-plus. It also likely means that more companies will tailor products and services to meet this opportunity.

There are a number of industries that will likely be beneficiaries. Some are obvious — healthcare, pharmaceuticals and medical technology are what come to mind for most people and certainly receive significant weighting in the Aging of the Population index. Others are less obvious but just as important and likely to feel the same thematic impact. We’re talking about:

  • A shift in demand for different types of housing as seniors give up on the homestead and move into easier to maintain condos and townhouses.
  • An even greater focus on online retailers that will deliver purchases directly to the home, rather than having to go out and carry purchases from the store to the car and then into the home. Also driving this shift will be younger children making purchases for their aging parents and having them shipped directly to their home.
  • Financial Services stands right in the middle of the storm as the wealthiest generation in history starts to draw down on assets to fund retirement rather than accumulate more and more each year.
  • Fountain of Youth goods and services will be in even higher demand as Baby Boomers have shown they are not likely to let go of their youth easily.
  • And finally, technology and services that will help maintain independence— we’re talking about robots, digital assistants, monitoring equipment and even things such as the autonomous car.


Enter AMN Healthcare

One of the key aspects of our Aging of the Population investing theme centers on the aging of the baby-boomer generation and the corresponding needs and pain points. Looking at the domestic population, no matter the data or the source, it all points to the same thing — more people over age 65 than ever before.

Now for the real whammy: According to the National Council on Aging, 80% of older adults have at least one chronic condition, and 68% have at least two. Combined with the underlying demographic shift, this will place far greater demands on the domestic health care system in the coming years.

While many tend to focus on any one of the various aspects of the health care systems, the combination of the aging population and chronic conditions is a demand driver for nurses. But here’s the problem: The U.S. has been dealing with nursing constraints over the last few decades. Viewed against the aging population and an aging nursing workforce with limited capacity at nursing schools, that constraint is looking more and more like an outright shortage.

  • According to the Bureau of Labor Statistics’ Employment Projections 2014-2024, Registered Nursing (RN) is listed among the top occupations in terms of job growth through 2024. The RN workforce is expected to grow from 2.7 million in 2014 to 3.2 million in 2024, an increase of 439,300 or 16%. The Bureau also projects the need for 649,100 replacement nurses in the workforce bringing the total number of job openings for nurses due to growth and replacements to 1.09 million by 2024.
  • By 2025, the shortfall is expected to be “more than twice as large as any nurse shortage experienced since the introduction of Medicare and Medicaid in the mid- 1960s,” according to Vanderbilt University nursing researchers.
  • Roughly a million registered nurses (RNs) are older than 50, according to the American Nurses Association. What this means is roughly one-third of the current nursing workforce will reach retirement age in the next 10 to 15 years. Some estimates place the total number of nurses expected to exit the position as high as 700,000 over the next eight years.


Where does this leave us?

The nursing shortage that we’ve identified as part of our Aging of the Population theme looks to benefit from both a significant increase in demand but also a scarce-resource tailwind as well. That combined tailwind has been extremely beneficial to the shares of AMN Healthcare Services (AMN), a healthcare workforce and staffing solutions company with an emphasis on the nursing industry. Tematica Investing subscribers should be familiar with the company given the AMN shares resided on the Tematica Investing Select List from August 2016 until May 2017, when we were stopped out of the position.

Staffing Industry Analysts (SIA) estimates that the segments of the target market in which AMN primarily operate have an aggregate 2018 estimated market size of $17 billion, of which travel nurse, per diem nurse, locum tenens and allied healthcare comprise $5.4 billion, $3.7 billion, $3.7 billion and $4.2 billion, respectively. Based on the consensus revenue forecast of $2.15 billion this year for AMN, the company has approximately 12.5% market share across those aggregate markets. And as the population continues ages, those figures will continue to rise, giving the opportunity for AMN to place not only nurses but assist in other physician leadership searches as part of its Managed Service Program offering. Generally speaking, AMN’s revenue and profit stream reflect the number of healthcare professionals it has placed on assignment multiplied by the average bill rate. More than likely as the shortage continues, the company’s average bill rate is poised to move higher making for nice incremental margin gains.

The question to be asked now is if there is sufficient upside in AMN shares to have them rejoin the Select List at current levels?

Looking at the discrepancy in the monthly JOLTS reports between the number of healthcare job openings vs. the number of filled healthcare jobs, we know the healthcare workers shortage pain point remains. Over the 12 months ending June 2018, per the monthly JOLTS report, the ratio of healthcare and social assistance job openings to hires has remained near 1.9x.  The analysis of the nursing shortage over the last few pages also tells us that it’s not going to be solved in one year’s time let alone in the coming few years, which means the sting of that pain point of that shortage will be felt some time to come. This will likely translate into continued top and bottom line growth for AMN as its revenue model capitalizes on that pain point. Should we see an increase in the number of new nurses coming into the market, this will likely augment AMN’s revenue stream as it leverages its market position and places a percentage of those new entrants.

Over the 2012-2020E period, AMN is expected to grow its bottom line at roughly a 17% compound annual growth rate (CAGR). As the nursing shortage pain point has intensified over the last several years, AMN shares have peaked at more than 21x earnings and bottomed out at an average P/E multiple at 14x. Applying these historic multiples implies upside from current levels to $72, with downside risk to $48. With more Baby Boomers turning 70 years old every day, odds are those historic PE multiples, particularly to the downside, will move higher in the coming years as the severity of the nursing and aging pain point is more fully recognized. While we could stretch the P/E multiple to warrant a $75-$85 price target (and downside to just under the current share price), a better way to view it would be to place a discounted P/E placed on expected EPS of $4.00 in 2020, which gives us a $75 price target.

  • We are issuing a Buy on and adding shares of AMN Healthcare (AMN) to the Tematica Investing Select List with a price target of $75.


Companies riding the Aging of the Population investing theme

  • A V Homes (AVHI)
  • Amedisys Inc. (AMED)
  • ANI Pharmaceuticals (ANIP)
  • Athene Holding (ATH)
  • Brookdale Senior Living (BKD)
  • Caretrust (CTRE)
  • Charles Schwab (SCHW)
  • Cross Country Healthcare (CCRN)
  • CVS Health (CVS)
  • Ensign Group (ENSG)
  • Estee Lauder (EL)
  • Express Scripts (ESRX)
  • Lab Corp. (LH)
  • Lindblad Expeditions (LIND)
  • Omega Healthcare (OHI)
  • Nu Skin (NUS)
  • Physicians Services (DOC)
  • Quest Diagnostics (DGX)
  • Service Corp (SCI)
  • Spok Holdings (SPOK)
  • StoneMor Partners (STON) – basically the same and AMN
  • Wright Medical Group (WMGI)
  • Zimmer Biomet Holdings (ZBH)
  • Zoetis (ZTS)