Weekly Issue: Looking for Trump-Proof Companies

Weekly Issue: Looking for Trump-Proof Companies

We exited last week with the market realizing there was more bark than bite associated with President Trump’s steel and aluminum tariffs. That period of relative calm, however, was short-lived as the uncertainty resumed in Washington yesterday in the form of changeups in the administration with Trump letting go Secretary of State Rex Tillerson just after agreeing to talks with North Korea, and more saber rattling with trade actions against China for technology, apparel, and other imports. This also follows Trump’s intervention in the proposed takeover of Qualcomm (QCOM) by competitor Broadcom (BRCM).

While many an investor will focus on the “new” volatility in the market, I’ll continue to use our thematic lens to look for companies that are “Trump-Proof” in the short-term. That’s not a political statement, but rather a reflection of the reality that the modus operandi of President Trump and his Twitter habit often cause significant swings in the market as the media attempts to digest and interpret his comments.

How will we find these so-called Trump-proof companies? By continuing to use our thematic lens to uncover well-positioned companies that are benefitting from thematic tailwinds that alter the existing playing field, regardless of the latest noise from Washington politicians.

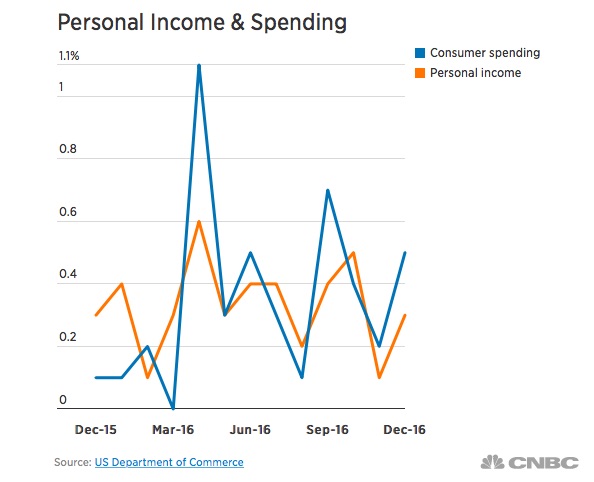
At least for now, volatility is back in vogue and that is bound to drive headlines and other noise. I’ll continue to focus on the data, and if you read this week’s Monday Morning Kickoff you know we are in the midst of a whopper of a data week. While the Consumer Price Index (CPI) for February was in line with expectations, and on a year over year basis core rose 1.8% — the same as in January — which should take some wind out of the inflation mongers. This morning we have the February Retail Sales report, which in my view should once again serve up confirming data for our positions in Amazon (AMZN) and Costco Wholesale (COST), which continue to benefit from our Connected Society and Cash-strapped Consumer investing themes.  Later in the week, the February reading on Industrial Production should confirm the demands that are exacerbating the current heavy truck shortage here in the U.S. – good news for the Paccar (PCAR)shares on the Tematica Investing Select List.


An Update on Our Once Star Performer, Universal Display (OLED)

A few weeks ago, I shared an update on Universal Display (OLED) shares, which have been essentially treading water following the company’s December quarter results. Later today, the management team will be presenting at the Susquehanna’s Seventh Annual Semi, Storage & Tech Conference. Odds are the management team will reiterate its view on market digesting the organic light emitting diode capacity additions made over the last several quarters, but I expect they will also describe the growing number of applications that will come on stream in the next 3-6 quarters.  As of late February, Susquehanna had a positive rating on OLED shares with a price target of $200 and I suspect they will have some bullish comments following today’s presentation.


Considering the ripples to be had with the latest Connected Society victim, Toys R Us

Over the weekend we were reminded of the situation facing many brick & mortar retailers that are failing to adapt their business to ride our Connected Society investing theme. I’m referring to toy and game retailer Toys R Us, the one-time Dick’s Sporting Goods (DKS) or Home Depot (HD) of its industry. Like several sporting goods retailers and electronic & appliance retailers such as Sports Authority, Sports Chalet, and HH Gregg that have gone belly up, if Toys R Us doesn’t get a last-minute lifeline or find a buyer it will likely file Chapter 7.

It’s been a rocky road for the one-time toy supermarket company as it entered bankruptcy in September, aiming to emerge with a leaner business model and more manageable debt. The company obtained a new $3.1 billion loan to keep the stores open during the turnaround effort, but results worsened more than expected during the holidays, casting doubt on the chain’s viability. The company entered this year with more than 800 stores in the U.S. — under both the Toys “R” Us and Babies “R” Us brands, but by January, it announced the shuttering of 180 locations.

The pending bankruptcy to be had at Toys R Us is but the latest in the retail industry, but it’s not likely to be the last. Claire’s Stores Inc., the fashion accessories chain with a debt load of $2 billion, is also preparing to file for bankruptcy in the coming weeks as is Walking Co. Holdings Inc.

What these all have in common is the increasing shift by consumers to digital commerce and the growing reliance on retailers for what is termed the direct to consumer (D2C) business model. Certain branded apparel, footwear, and other consumer product companies, like Nike (NKE) have embraced Amazon’s formidable logistics capabilities and this has benefitted our United Parcel Service (UPS) shares. As we have said before, and we recognize it sounds rather simplistic, when you order products online they have to get to where they are being sent. Hello UPS!

Now let’s consider the ripple effect of the pending Toys R Us bankruptcy.

When events such as this occur, there is a liquidation effect and a subsequent void. As we saw when Sports Authority went bankrupt, the businesses at Nike and Under Armour (UAA) were impacted by liquidation sales in the short term. At the same time, both lost the recurring sales associated with Sports Authority. Odds are we will see the same happen with Toys R Us with companies like Mattel (MAT) and Hasbro (HAS) taking it on the chin. In my view these companies are already struggling as teens, tweens and kids of all ages shift to digital games, apps and e-gaming, which are aspects of our Connected Society and Content

In my view these companies are already struggling as teens, tweens and kids of all ages shift to digital games, apps and e-gaming, which are aspects of our Connected Society and Content is King themes. When was the last time you saw an elementary schooler play with Ken or Barbie? More likely they are on an iPad or Microsoft (MSFT) Xbox while their older siblings are playing the new craze sweeping the nation – Fortnite. And yes, that it appears the rumors are true and Fornite will soon be available across Apple’s iDevices.

Looking at the financial performance of Mattel, not even the all mighty Star Wars franchise could save them from delivering declining revenue and earnings this past holiday shopping season. On the liquidation front, we are likely to see the toys businesses at Target (TGT) as well as Walmart (WMT) take the brunt of the blow. But here too this is likely just another hit as these two retailers have already been dealing with falling revenue at Mattel and Hasbro. Walmart is the largest customer for Mattel and Hasbro, accounting for about 20% of total sales for each toy maker. Both toy companies get nearly 10% of their revenue from Target too.

One of the investing strategies that I employ with the Select List is “buy the bullets, not the guns” which refers to buying well-positioned suppliers that serve a variety of customers. In situations like what we are seeing in the brick & mortar retail sector, we can turn that strategy upside down and uncover those companies, like Mattel and Hasbro, that we as investors should avoid given the multiple direct and indirect headwinds they are currently facing or about to.


Big Five Sporting Goods is no sporting chance without e-commerce

Big Five Sporting Goods is no sporting chance without e-commerce

You’ve probably noticed that retailers are doing all they can to clear out winter-related items as they prepare for the spring season. It means sales, sales, sales, and in some cases compressed margins. Walk through almost any mall, and you’ll see signs for buy one get one free, buy one get the next one 50% off, and so on.

When we think of spring, most of us tend to think of spring break and the start of spring sports, particularly for school age kids. Why that age? Because they tend to grow, and that means each year new items ranging from athletic shoes, cleats, pants, shirts, jerseys, helmets, and other pieces of athletic wear tend to be bought.

Notice I said usually. In 2017, according to Census Bureau data found in the December Retail Sales Report, sales at sporting goods, hobby, book and music stores were unchanged in the December quarter and fell 3.4% for the year in full. One of those reasons is actually good news for our Amazon (AMZN) shares as non-store retail sales rose 12.7% year over year in December and was up 10% for all of 2017 compared to 2016. The sporting goods category wasn’t the only one to be hit by the shift to digital commerce – for perspective, compared to retail sales (excluding food and auto sales) that rose 4.4% in 2017, digital sales rose nearly 2.3x faster. As we like to say at Tematica, it’s all about connecting the data dots and ahead of Amazon’s December quarter results those retail data points were rather revealing.

The question we have to ponder is whether people are not buying athletic equipment for their kids or, if they are shifting where they buy it — from sporting goods stores like Dick’s Sporting Goods (DKS) to big box retailers like Target (TGT), Walmart (WMT), Costco Wholesale (COST) and discount retailers, as well as online at Amazon (AMZN).

We’re also seeing another factor on the competitive landscape: Foot Locker (FL) and Finish Line (FINL) move to expand from athletic footwear into athletic wear. Those factors led to several sporting good chains, such as Sports Authority, Sports Chalet, MC Sports and others, to file for bankruptcy.


And that brings us to Big 5 Sporting Goods (BGFV)

For those unfamiliar with the company, at the end of 2017 it operated 435 stores in 11 states and offered athletic shoes, apparel and accessories, as well as a broad selection of athletic equipment for team sports, fitness, camping, hunting, fishing, tennis, golf, winter and summer recreation and roller sports. Pretty much a full- service sporting goods store complete with a digital platform as well.

Has Big Five been spared the pain that has been felt in the sporting goods industry?

In a word, no, and we can say this because earlier this month it reported disappointing fourth-quarter 2017 sales that included same-store sales falling 9.4%. Those top line results led the company to revise its bottom line results for the quarter into the red. While some of this can be attributed to mild December temperatures that led to weak demand for cold weather products, the reality is Big Five’s same store sales excluding winter-related and firearm-related products were down low-single digits for the quarter. This tells us that something else is afoot, and odds are it’s the increasingly competitive landscape.

In response to that disappointing fourth-quarter 2017 pre-announcement, Big Five Sporting Goods shares have slumped some 27% since the start of 2018. And this leads us to the obvious question – should we be interested in BGFV shares at current levels?

At the current share price, based on historic multiples and current earnings expectations of $0.55-$0.56 per share last year and this year vs. $0.82 per share in 2016, there’s upside to $6.00-$6.25 per share. Not exactly upside enough to get excited for a business that is being challenged and expected to deliver contracting revenue in the first half of 2018.

Odds are BGFV shares will get cheaper before they get expensive, and while that could make them tempting to some, we’ll take a pass at least until the company’s e-commerce efforts become material to its overall revenue and profit. Based on what I heard on the company’s last earnings call, it’s going to be some time until that happens…if it does…  that means the company is poised to be trapped in the headwind of our Connected Society investing theme. In other words, more pain as Amazon and even Walmart continue to rise the tailwind of that theme to revenue and profits.

Boosting Price Target on UPS Shares Amid eCommerce Surge

Boosting Price Target on UPS Shares Amid eCommerce Surge

Key Points from this Post:

  • We are boosting our price target on United Parcel Service (UPS) shares to $130 from $122. Our new price target is a tad below the high end of the price target range that clocks in at $132, and offers an additional 7.6% upside from current levels.
  • As additional holiday sales shopping forecasts are published, we’ll be double and triple checking our UPS price target for additional upside.
  • Our price target on Amazon (AMZN) shares remains $1,150.
  • Our price target on Alphabet (GOOGL) shares remains $1,050


We have long said that United Parcel Service shares are the second derivative to the accelerating shift toward digital shopping. Whether you order from our own Amazon (AMZN), Nike (NKE), Wal-Mart (WMT), William Sonoma (WSM) or another retailer, odds are UPS will be one of the delivery solutions.

As we enter 4Q 2107 this week, we’re seeing rather upbeat forecasts for the soon to be upon us holiday shopping season. We’d note that most of these forecasts focus on the period between November and December/January, more commonly known as the Christmas shopping and return season that culminates in post-holiday sales that have retailers looking to make room for the eventual spring shopping season. With Halloween sales expected to reach $9.1 billion this year up 8.3% year over year per the National Retail Federation, we suspect there will be plenty of costumes, candy, and other items for this “holiday” that are purchased online.

Now let’s review the 2017 holiday shopping forecasts that have been published thus far:

Deloitte: Deloitte expects retail holiday sales to rise as much as 4.5% between November and January of this year, vs. last year’s rise of 3.6%, to top $1 trillion. In line with our thinking, Deloitte sees e-commerce sales accelerating this year, growing 18%-21% this year compared to 14.3% last year, to account for 11% of 2017 retail holiday sales.

eMarketer is forecasting total 2017 holiday season spending of $923.15 billion, representing 18.4% of U.S. retail sales for the year, 0.1% decline from last year. Parsing the data from a different angle, that amounts to nearly 20% of all 2017 retail sales. Digging into this forecast, we find eMarketer is calling for US retail e-commerce sales to jump 16.6% during the 2017 holiday season, driven by increases in mobile commerce and the intensifying online battle between large retailers and digital marketplaces. By comparison, the firm sees total retail sales growing at a moderate 3.1%, as retailers continue to experience heavy discounting during the core holiday shopping months of November and December.

As we saw above, a differing perspective can lead to greater insight. In this case, eMarketer’s data puts e-commerce’s share of this year’s holiday spending at 11.5% with the two months of November and December accounting for nearly 24% of full-year e-commerce sales.

AlixPartners: Global business-advisory firm, AlixPartners, forecasts 2017 US retail sales during the November-through-January period to grow 3.5%-4.4% vs. 2016 holiday-season sales. Interestingly enough, the firm arrives at its forecast using some mathematical interpolation – over the past seven years, year-to-date sales through the back-to-school season have accounted for 66.1% to 66.4% of retail sales annually, with holiday sales accounting for 16.9% to 17.0%.

NetElixir: Based on nine years of aggregate data from mid-sized and large online retailers, NetElixir forecasts this year’s holiday e-commerce sales will see a 10% year-over-year growth rate. NetElixir also predicts Amazon’s share of holiday e-commerce sales will reach 34%, up from the 30% last year.

These are just some of the holiday shopping forecasts that we expect to get, including the barometer that most tend to focus on – the 2017 holiday shopping forecast from the National Retail Federation. What all of the above forecasts have in common is the acceleration of e-commerce sales and the pronounced impact that will have in the November-December/January period.

In looking at revenue forecasts for UPS’s December quarter, current consensus expectations call for a 5.8% year over year increase vs. $16.9 billion in the September quarter. We suspect this forecast could be conservative, and the same holds true for EPS expectations, which likely means there is upside to be had vs. the $6.01 per share in consensus expectations for 2017. Over the 2014-2016 period, UPS shares peaked during the holiday shopping season between 19.3-23.5x earnings, or an average P/E ratio of 21.3x. Applying that average multiple to potential 2017 EPS between $6.01-$6.15 derives a price target between $127-$131.

As consumers continue to shift disposable spending dollars to online and mobile platforms, we continue to see Amazon, as well as Alphabet (GOOGL), benefiting as consumers embrace this shift and Cash-Strapped Consumers look to stretch the spending dollars they do have this upcoming holiday shopping season.

  • We are boosting our price target on United Parcel Service (UPS) shares to $130 from $122, an additional 7.6% upside from current levels.
  • Our price target on Amazon (AMZN) shares remains $1,150.
  • Our price target on Alphabet (GOOGL) shares remains $1,050
Consumers Spend More in December, But Ouch Those Revolving Debt Levels Sure Could Hurt

Consumers Spend More in December, But Ouch Those Revolving Debt Levels Sure Could Hurt

This morning the US Bureau of Economic Analysis published its take on Personal Income & Spending for December. We’re rather fond of this monthly report given the data contained within and the implications for several of our investment themes, including Cash-strapped Consumers as well as Affordable Luxury and the Rise & Fall of the Middle Class. 

So what did the December report show?

Personal Income rose 0.3 percent, far faster than in November, but still below the 0.4-0.5 percentage gains registered in September and October. We saw the same pattern with Disposable Income (which is a better barometer for discretionary spending), as one would expect to see during the holiday shopping laden month of December.

That’s as good a segue as any to remind our readers that holiday shopping during November and December came in stronger than the National Retail Federation had forecasted. The final tally was a year over year increase of 4.0 percent compared to the NRF’s 3.6 percent forecast.

Now you’re probably saying to yourself, “How can that be given all the bad news that we’ve been hearing from Macy’s (M), Target  (TGT), Kohl’s (KSS), Sears (SHLD) and other brick and mortar retailers?”

To be honest, we doubt the average person would have thrown in the “other brick and mortar retailers” part, but we know our readers are smarter than the average bear.

The answer to that question is that non-store sales, Commerce Department verbiage for e-tailers like Amazon (AMNZ), eBay (EBAY) and digital Direct to Consumer business like those found at Macy’s, Under Armour (UAA), Nike (NKE) and other retailers, rose 12.6 percent year over year to $122.9 billion. We certainly like those stats as they confirm several aspects of our Connected Society investing theme, but we would argue a more telling take on the data is that non-store sales accounted for 19 percent of holiday shopping in 2016, up from 17 percent the year before. Nearly one-in-five shopping dollars was spent through online or mobile shopping.

We’ll get a better sense of this shift, which we only see as accelerating, later this week when both United Parcel Service (UPS) and Amazon report their quarterly results for the December quarter. Team Tematica will also be listening to Direct to Consumer comments from Under Armour and other apparel and footwear companies as they too report quarterly results over the next few weeks.

Now let’s take a look at December Personal Spending – it rose 0.5 percent, a tick higher than was expected. Given the NRF data above, it was rather likely we were going to get a better print vs. expectations.

In combining both the income and spending data for the month, we get the savings rate, which fell to 5.4 percent, a five-month low. Compared to a few years ago, that savings level looks rather solid even though it’s well below the longer-term trend line. What we do find somewhat disconcerting, given the prospects for the Fed to boost interest rates up to three times this year after only doing so just two times in the last two years, is the amount of revolving consumer debt outstanding. As evidenced in the graph below, those levels have continued to climb steadily higher during 2015 and 2016.

Should interest rates move higher in 2017, the incremental interest expense could crimp consumer wallets, reducing their disposable income in the process. To us, that could mean less Affordable Luxury or even Guilty Pleasure spending as more become Cash-strapped Consumers.