Category Archives: Economic Commentary

Thematic Tailwinds and Headwinds Drive February Retail Sales 

Thematic Tailwinds and Headwinds Drive February Retail Sales 

This morning the US Department of Commerce published its February Retail Sales report, which was in line with expectations growing 0.1 percent compared to January. This report is always an interesting read due in part to the fact that we can look at the data a number of ways — month over month, year over year, and three-month comparisons on a trailing and year over year basis. As you can imagine, this can lead to quite a bit of confusion when trying to puzzle together exactly what the investing signal is coming out of that retail report noise.

Here’s our take on it featuring the thematic lens that we hang our hat at here at Tematica . . .

February 2017 vs. January 2017

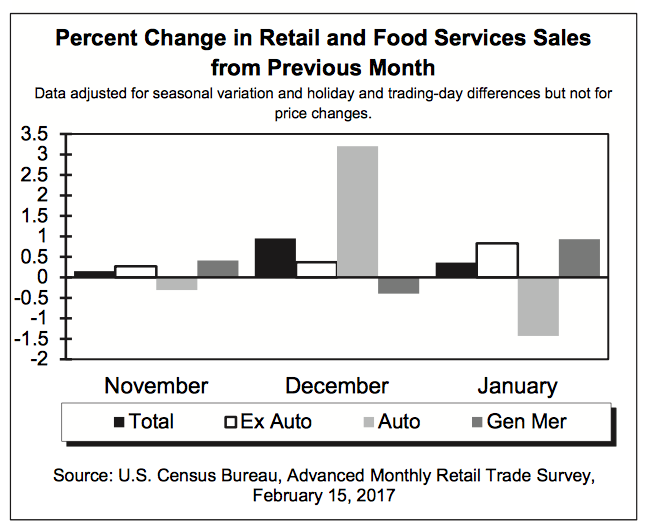
Month over month retail sales climbed by 0.1 percent, in line with expectations. The four categories that saw faster spending growth than the average were furniture (+0.7 percent), building materials (+1.8 percent), health & personal care stores (+0.7 percent) and nonstore retailers (+1.2 percent). The sequential increase in building material demand, as well as furniture, fits with the mild winter weather that led to a pickup in construction employment and a stronger than seasonal pickup in housing starts.

The continued tick higher in health & personal care stores ties with our Aging of the Population investing theme. We continue to see this category rising faster than overall retail spending as the first baby boomers turn 70 this year with another 1.5 million each year for the next 15 years. The scary part is of these baby boomers, roughly only 50 percent have saved enough for retirement, which touches on our Cash Strapped Consumer investing theme.

Finally, we once again see Nonstore retailers taking consumer wallet share in February, which comes as no surprise as Amazon and other retailers continue to expand their service offerings and geographic footprints, while other traditional brick & mortar retailers focus on growing their direct to consumer business. In short, our Connected Society investing theme continues to transform retail.

Month over month weakness was had at electronics & appliance stores, clothing, and department stores. Compared to January gasoline station sales ticked down modestly as well, which we attribute to the essentially flat gasoline prices month over month per data from AAA.


February 2017 vs. February 2016

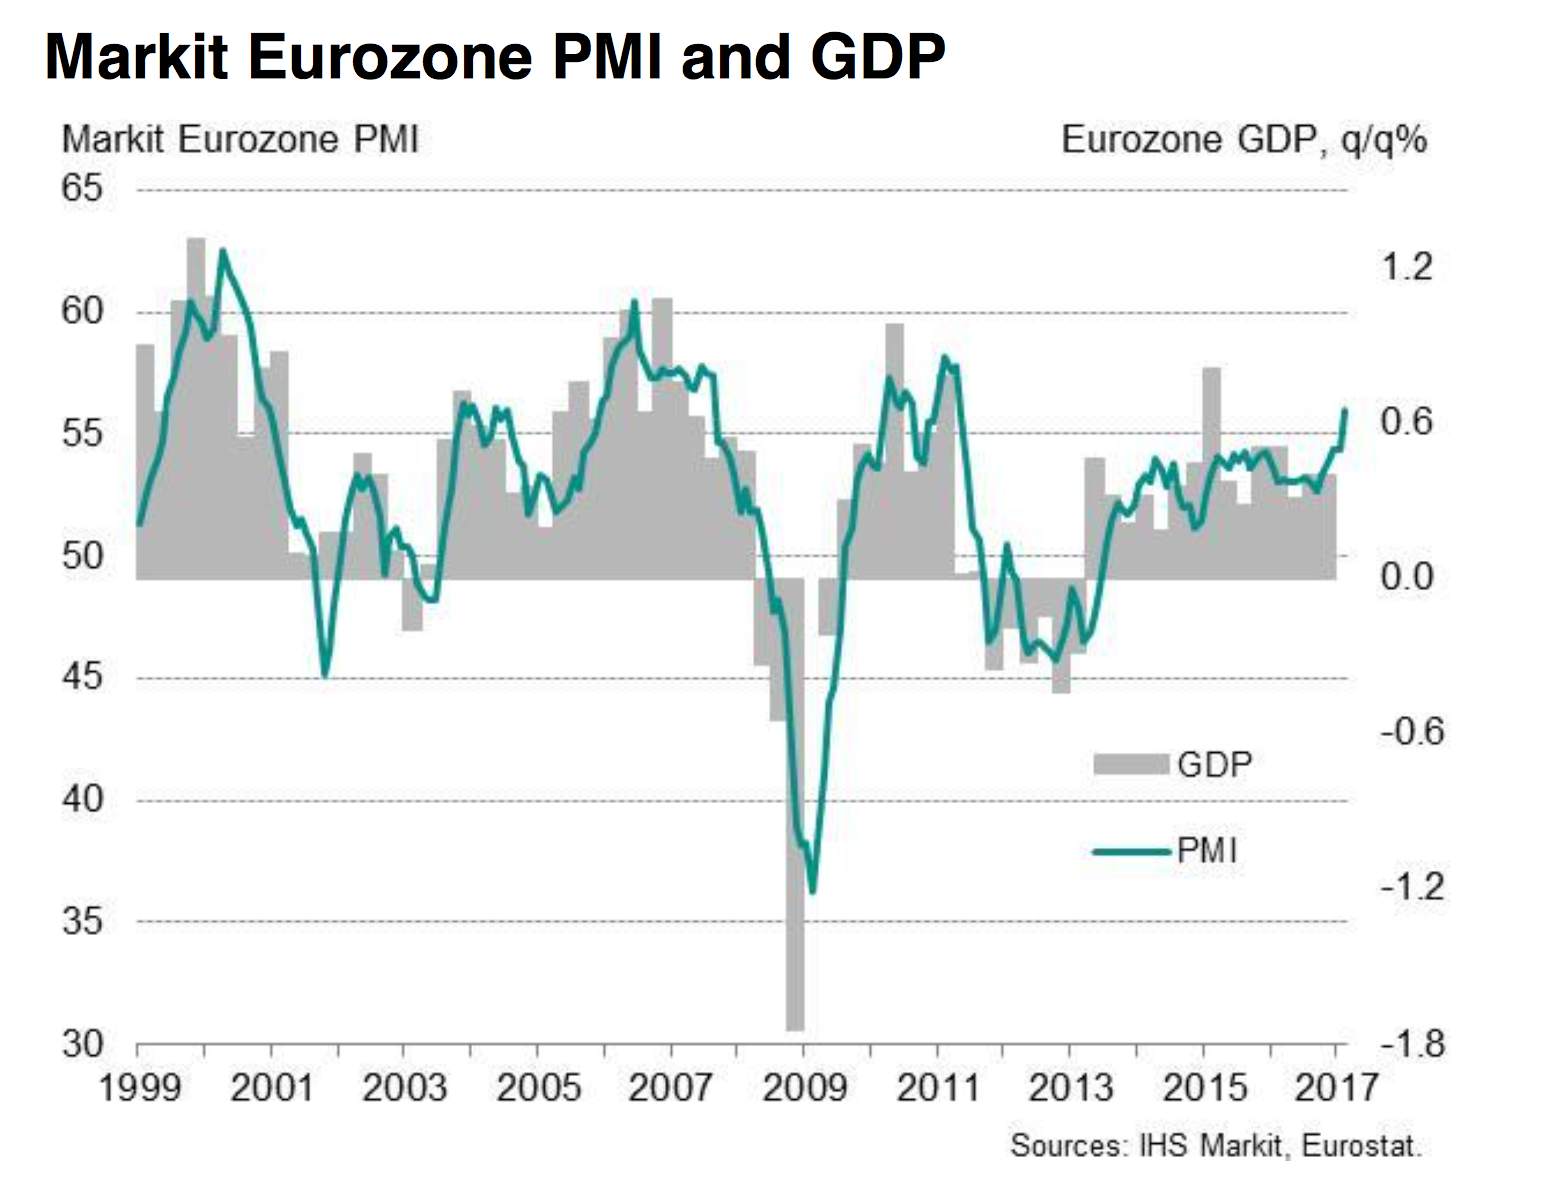
Year over year February Retail Sales excluding autos and food rose 5.9 percent led by a 19.6 percent increase in gasoline station sales, a 13.0 percent increase in Nonstore retail, a 7.3 percent rise in building materials, a 7.0 percent increase at health & personal care stores. Without question, the rise in gasoline station sales reflects the year over year 18 percent increase in gas prices per AAA data, while the milder winter we discussed earlier is likely pulling demand forward in construction and housing — we’ll look for February and March housing data to confirm this. The rise in gas prices reflects OPEC oil production cuts, which serves as a reminder that oil and other energy products are part of our Scarce Resource investing theme — there is only so much to be had, and production levels dictate supply.

As far as the year over year increase in health & personal care goes, it’s the same story — the Aging of the Population as Father Time is a tough customer to beat no matter how people embrace our Fountain of Youth investing theme. Finally, and certainly no surprise is the continued increase in Nonstore retail sales. Candidly, we see no slowdown in this Connected Society shift — all we need to do is look at the evolving shopping habits of the “younger” generation.

The two big declines were had were…. no surprise….. electronic & appliance stores, which fell 6 percent year over year, and department stores, which dropped 5.6 percent compared to February 2016.  With hhgregg (HGG) closing a good portion of its stores and JC Penney (JCP) recently announcing even more store closures, the results of these two categories, which are likely feeling the heat from Amazon (AMZN) in particular and others benefiting from the Connected Society tailwind, the results from these two categories is anything but surprising.

If we look at the three month rolling average on both a sequential and year over year basis, the leaders remained the same — building materials, gasoline stations, Nonstore retail and health & personal care. Behind each of these there is a clear thematic tailwind, even construction and housing, which is has historically been a beneficiary of the rising aspect of our Rise & Fall of the Middle Class investing theme. We’ll have a better sense of that with tomorrow’s February Housing Starts and Building Permits report.

And just in case anyone was holding out hope for electronics & appliance stores and department stores, the three-month rolling averages showed continued declines on both on a sequential and year over year basis. Nothing like a thematic headwind to throw cold water on your business.

The question to us is whether we will see more M&A chatter like we saw several weeks back with Macy’s (M) and more recently with Hudson Bay (TSE:HBC) being interested in Neiman Marcus. We can understand one company picking off well-positioned assets that might improve its overall customer mix, but we suspect there will be a number of companies left standing with no dance partners when this game of retail musical chairs is over. That means more companies going the way of Wet Seal than not, which means pain for mall REIT companies like Simon Property Group (SPG).

Before we go, we have to mention the piece by Tematica’s Chief Macro Strategist, better known on the Cocktail Investing Podcast as the High Priestess of Global Macro, Lenore Hawkins, which  called out the lack of weekly, year over year wage growth in February. Paired with higher prices, such as gas prices and others, that are leading to a pickup in reported inflation, it tells us our Cash-strapped Consumer investing theme has more room to go.

Hat tip to Lenore Hawkins, who added her special sauce and insights to this viewpoint. 

Note: Tematica’s subscription trading service, Tematica Pro, has a short position in SPG shares. 


What We’re Watching This Week

What We’re Watching This Week

[MM_Access_Decision access=’true’]
The Article Below is Exclusively for Tematica Research Members
[/MM_Access_Decision]

[MM_Access_Decision access=’false’]
You do not have access to this content until you upgrade to a Tematica Membership. Click here for details.
[/MM_Access_Decision]


As you probably know, this week is a shortened one following the 3-day holiday that was President’s Day. We still have a number of companies reporting their quarterly earnings this week, and that includes the Tematica Select List’s own Universal Display (OLED). The shares have had a strong run, up just over 28 percent year to date, and that likely has them priced near if not at perfection. Last week, Applied Materials (AMAT) gave a very bullish view when it comes to the ramping organic light emitting diode manufacturing capacity, as the industry prepares for Apple (AAPL) and others switching to this display technology. Consensus expectations for Universal’s December quarter results are EPS of $0.42 on $68.6 million in revenue. We expect a bullish outlook to be had when Universal reports its results this Thursday.

Alongside Universal Display, there will be a few hundred other companies reporting. Among those, we’ll be tuning into reports from Wal-Mart (WMT), Macy’s (M), JC Penney (JCP) and TJX (TJC) for confirming data on our Amazon (AMZN) thesis. Similarly, we’ll be looking at Cheesecake Factory’s (CAKE) for confirmation in the restaurant pain that is benefitting our McCormick & Co. (MKC) and United Natural (UNFI) shares.

On the economic data front, the calendar is a tad light, with the highlight likely to be the next iteration of the Fed’s FOMC minutes. Given Fed Chairwoman Janet Yellen’s two-day testimony on Capitol Hill that we touched on above, we’re not expecting any major surprises in those minutes. Even so, we’ll be pouring over them just the same.

This morning we received the February Flash Manufacturing PMI metrics from Markit Economics and not only did Europe crush expectations hitting a six-year high in February. Across the board, from business activity to backlogs of work and business confidence, the metrics rose month over month. One item that jumped out to us was the increase in supplier delivery times, which tends to be a harbinger of inflation — something to watch in average selling price data over the next few months. Turning to Japan, the Markit flash manufacturing PMI rose to 53.5 in February, its highest level since March 2014, with sequential strength in all key categories — output, exports, employment and new orders. but Japan hit it’s highest level since March 2014.


Here at home, the Flash U.S. Composite Output Index hit 54.3 in February, a downtick from 55.8 in January, but still well above the 50 line that denotes a growing economy. The month over month slip was seen in manufacturing as well as the service sector. Despite that slip, new manufacturing order growth remained faster than at any other time since March 2015 and called out greater demand from energy sector clients. No surprise, given the rising domestic rig count we keep reading about each week.

Manufacturers also called out that input cost inflation was at its highest level since September 2014 and we think this is something that will have the Fed’s ears burning.


Currently, our view is the next likely rate hike by the Fed will be had at the May meeting, which offers plenty of time to assess pending economic stimulus, immigration and tax cut plans from President Trump. Again, we’ll be watching the data to determine to see if that timing gets pulled forward.

Stay tuned for more this week.

January Retail Sales – Department Store Pain vs. E-tailing Gains

January Retail Sales – Department Store Pain vs. E-tailing Gains

Earlier today the Census Bureau published its report on January Retail Sales, which topped expectations with a print of +0.4 percent vs. the expected 0.1 percent. Stripping out January Auto sales and food services, Retail sales +0.2 percent month over month. To us, the more telling figure was the 5.1 percent year over year increase in Retail only sales that was fueled by the 14.5 percent increase in Nonstore retailers, the +13.9 percent increase in gasoline station sales as well as strong showings from the Health & Personal Care stores categories and Building Material & Garden stores. Lackluster categories remained General Merchandise and Department Stores as well as Furniture and Electronics & Appliance stores.


Donning our thematic hats and looking at the January report, we find continued support for the accelerating shift toward digital commerce that sits at the core of our Connected Society investing theme and benefits companies like Amazon (AMZN) and Alphabet (GOOGL), both of which are on the Tematica Select List, and eBay as well as delivery companies such as United Parcel Service (UPS). To us there is no more telling statistic for that than the year over year comparison between Nov. 2015 – Jan. 2016 and Nov. 2016 – Jan. 2017. when Nonstore retail sales rose 12.7 percent vs. 4.6 percent for overall retail sales. Talk about a share gain!

We see the strong showing by Health & Personal Care stores as rather confirming for our Aging of the Population investment theme, while the continued pain felt at department stores comes as little surprise given the post-holiday shopping comments we’ve heard from Macy’s (M), Kohl’s (KSS), JC Penney (JCP) and others, which includes a number of location closures. That loss of anchor tenants alongside announced store closings ranging from The Limited to Wet Seal and others only supports our Death of the Mall view that poses a significant headwind to mall real-estate investor trust companies like Simon Property Group (SPG), Westfield Corp. (WFGPY) and Taubman Centers (TCO).

  • We continue to rate AMZN shares a Buy with a price target of $975
  • We continue to rate GOOGL shares a Buy with a $900 price target
January Retail Sales – Department Store Pain vs. E-tailing Gains

January Retail Sales – Department Store Pain vs. E-tailing Gains

Earlier today the Census Bureau published its report on January Retail Sales, which topped expectations with a print of +0.4 percent vs. the expected 0.1 percent. Stripping out January Auto sales and food services, Retail sales +0.2 percent month over month. To us, the more telling figure was the 5.1 percent year over year increase in Retail only sales that was fueled by the 14.5 percent increase in Nonstore retailers, the +13.9 percent increase in gasoline station sales as well as strong showings from the Health & Personal Care stores categories and Building Material & Garden stores. Lackluster categories remained General Merchandise and Department Stores as well as Furniture and Electronics & Appliance stores.

Donning our thematic hats and looking at the January report, we find continued support for the accelerating shift toward digital commerce that sits at the core of our Connected Society investing theme and benefits companies like Amazon (AMZN), a Tematica Select List holding, and eBay as well as delivery companies such as United Parcel Service (UPS). To us there is no more telling statistic for that than the year over year comparison between Nov. 2015 – Jan. 2016 and Nov. 2016 – Jan. 2017. when Nonstore retail sales rose 12.7 percent vs. 4.6 percent for overall retail sales. Talk about a share gain!

We see the strong showing by Health & Personal Care stores as rather confirming for our Aging of the Population investment theme, while the continued pain felt at department stores comes as little surprise given the post-holiday shopping comments we’ve heard from Macy’s (M), Kohl’s (KSS), JC Penney (JCP) and others, which includes a number of location closures. That loss of anchor tenants alongside announced store closings ranging from The Limited to Wet Seal and others only supports our Death of the Mall view that poses a significant headwind to mall real-estate investor trust companies like Simon Property Group (SPG), Westfield Corp. (WFGPY) and Taubman Centers (TCO).

Weak Economic Readings Are Good News for Our Positions

Weak Economic Readings Are Good News for Our Positions

From a market perspective, this holiday-shortened trading week certainly started off on a high note, reflecting what appeared to be progress in stabilizing oil prices in an OPEC and non-OPEC production deal. As more details became clear, however, it appeared there were cracks already in the works as oil production levels were to be frozen at January 2016 levels. Soon thereafter, we learned that Iran would be able to continue ramping up its production, which raised eyebrows over the likelihood that this deal would have even more problems. As we’ve seen in the past when oil prices collapse, these agreements tend to be fraught with side dealings. Time will tell if that once again turns out to be the case.

After two more days of an up market that built on Friday’s strong move, which was mostly oil and buyback-upsizing driven, we were reminded that there is still much uncertainty out there. I’m not referring to the 2016 presidential election, although as we inch closer and closer, it is becoming harder to guess who will be facing off with whom this fall.

No, I’m taking about the rash of news that hit on Thursday in the form of:

  • The U.S. Energy Information Administration (EIA) showing that U.S. crude stockpiles rose by 2.1 million barrels.
  • And then also this from the EIA — “U.S. Gulf of Mexico (GOM) crude-oil production is estimated to increase to record high levels in 2017 even as oil prices remain low. The EIA projects GOM production will average 1.63 million barrels per day in 2016 and 1.79 million b/d in 2017, reaching 1.91 million b/d in December 2017. GOM production is expected to account for 18% and 21% of total forecast U.S. crude-oil production in 2016 and 2017, respectively.”
  • Finally, the Organization for Economic Cooperation and Development (OECD) cut its 2016 economic-growth forecast once again. The group lowered its 2016 global-growth forecast by 0.3 percentage points to 3% for the year. That’s the second cut since October, when the OECD pegged 2016 growth at 3.6%.

Of course, government statistics and forecasts like the OECD’s tend to be a beat or two behind what’s happening on the economic dance floor, so you should keep tabs on other indicators in addition to these.

Candidly, that announcement was hardly surprising given the economic data we’ve been getting, and even that has been teed up by other data that I’ve been watching.

Chinese manufacturing remained slack in January, including the weakest reading for the government’s official purchasing managers’ index since August 2012. Longtime readers know that one data point I closely follow is the Association of American Railroads’ (AAR) weekly reading on U.S. railcar traffic and loadings. Let’s just say that if you’ve been paying attention to this indicator in the year-to-date period, the recent contracting regional Fed manufacturing reports haven’t been much of a surprise.

The AAR reported this week that U.S. weekly rail traffic totaled 505,148 carloads and intermodal units in the seven days ending Feb. 13. That’s down 3.8% from the same period last year. But a single week doesn’t make a trend, so we need to look at year-to-date data. On that basis, combined U.S. traffic for 2016’s first six weeks has fallen 5.8% year over year to 3,017,321 carloads and intermodal units. A similar drop has occurred in truck tonnage, the Dry Baltic Index and the Cass Freight Index, which combine to indicate that products, assemblies and parts are not moving to where they are needed. As we all know, that is not a good sign for the economy.

Add in the contractionary readings for the Philly Fed and Empire Manufacturing indices this week for February and it lets us know the domestic economy is not rebounding.

Now you might think that was it, but it wasn’t. Yesterday, heavy equipment company Caterpillar ([stock_quote symbol=”CAT”]) presented at the Barclays Investor Conference and shared the following information:

  • CAT expects sales and revenue to be about 10% below 2015.
  • CAT also said it’s seeing a lot of global market uncertainty, as well as overall weak industry demand. Management added that global economic growth is slowing, which generally drives weak industry performance in CAT’s markets.

It looks to me like the OECD may have another round of cuts to make to its 2016 forecast

For those who were hoping the consumer aspect of our economy would provide some needed lift, I’m sad to say that the details from the earnings reports for both Wal-Mart ([stock_quote symbo=l”WMT”]) and Nordstrom ([stock_quote symbol=”JWN”]) tell us something different.

While Wal-Mart reported a beat on fiscal fourth-quarter earnings with $1.49 per share during the latest quarter vs. the $1.46 expected, the chain also issued a lighter-than-expected outlook, including virtually no revenue growth this year.

“Net sales growth is now expected to be relatively flat, which compares to the previous estimate for growth of 3% to 4% on a constant-currency basis,” WMT reported in a statement. “This change reflects the impact from recently announced store closures globally, as well as the continued strengthening of the U.S. dollar.”

Last night, shares of retailer Nordstrom fell 8% following the company’s weaker-than-expected December-quarter results. It posted earnings per share of $1.17 on $4.19 billion in revenue; the consensus estimates from Thomson Reuters called for EPS of $1.22 on $4.22 billion in revenue. Guidance was weaker than the market was expecting.

Taken together, these two retail reports are likely to be harbingers of what’s to come as more retailers begin reporting their last-quarter results. To me, it says the Cash Strapped Consumer theme is alive and well.

Needless to say, I’m glad we have no industrial or retail names inside our current Tematica Select List holdings. In fact, the weak economic news is actually good news for our dividend-heavy holdings, and here’s why — Federal Reserve Bank of St. Louis President James Bullard is saying it would be “unwise” for the central bank to raise rates near-term. That comment is interesting, given that Bullard was one of those supporting rate hikes during most of 2015.

Also, Fed watcher Jon Hilsenrath of The Wall Street Journal is saying what more and more people are coming to realize: The Fed is unlikely to boost rates in the year’s first half. He said the central bank prefers to wait and measure the economy’s vector and velocity over the coming months. Depending on what the Fed finds, we could see one or two rate increases during 2016’s back half.

This combination of slower economic growth, uncertainty and the increasingly likelihood that the Fed rate hike will be pushed out means our dividend-heavy portfolio should continue to prosper in the coming weeks.

As we keep the current course steady, I’m going to start filling our shopping list. I shared some prospects in the last issue of the newsletter, but I have a few more, including one that should benefit from the continued shift in advertising dollars from traditional media to online and mobile. Given that it is an election year and we have the Olympics, this one sure is looking to be a winner. I’ll share my recommendation once I’ve completed my analysis.

Enjoy your weekend and I’ll see you back here next week.

Turn off the music, close up the bar and call it a night

Turn off the music, close up the bar and call it a night

While the “bad news is good news” move in the market over the last few days is decidedly more enjoyable than those gut-wrenching market falls of late, it’s like a party that goes on for too long; at some point someone has to turn off the music, close up the bar and call it a night.
We’ve already seen some warning signs that it might be time to head out before things get awkward in the form of negative earnings pre-announcements for several companies.


In this week’s issue of Tematica Insights:

  • With the September ISM Manufacturing Survey out, what does it mean for inflation and any potential Fed action on rates later this year.
  • Is this a good time to jump on buying opportunities with all the negative earnings pre-announcements coming out?
  • China’s adoption of Western diet demonstrates how thematics can play-out in society.
  • Tematica Select List company Skyworks ([stock_quote symbol=”SWKS”]) makes a move, which has adds an interesting wrinkle to our Connected Society thematic.

Download Monday Morning Kickoff


Companies Mentioned
  • Alcoa (AA)
  • Amazon.com (AMZN)
  • American Airlines (AAL)
  • Apple Inc. (AAPL)
  • Bank of America (BAC)
  • Caterpillar (CAT)
  • Chegg Inc. (CHGG)
  • ConAgra (CAG)
  • Corning Inc. (GLW)
  • Dunkin’ Brands (DNKN)
  • DuPont (DD)
  • FedEx (FDX)
  • Hewlett Packard (HPQ)
  • Illumina (ILMN)
  • Immersion Corp. (IMMR)
  • Kimco Realty (KIM)
  • Lifelock (LOCK)
  • Merk & Co. (MRK)
  • Netflix (NFLX)
  • Nu Skin (NUS)
  • Palo Alto Networks (PANW)
  • PayPal (PYPL)
  • PMC-Sierra (PMCS)
  • Skyworks Solutions (SWKS)
  • Starbucks Inc. (SBUX)
  • Swift Transportation (SWFT)
  • Synaptics Inc. (SYNA)
  • Taiwan Semiconductor (TSM)
  • The Container Store (TCS)
  • U.S. Global Jets ETF (JETS)
  • United Natural Foods (UNFI)
  • Verizon Communications (VZ)
  • Wal-Mart (WMT)
  • Walt Disney (DIS)
  • Whole Foods Market (WFM) Xylem, Inc (XYL)
  • Yum! Brands (YUM)
Economics & Expectations September 2015

Economics & Expectations September 2015

We recently closed the books on the month of August, and in short, it was one of the worst August months we have seen in some time. In our view, yet to emerge forecasted earnings revisions and second half economic expectations as well as the Fed’s upcoming FOMC meeting on September 16-17 will keep the market range bound in the short-term.

Recapping the last few weeks. 

Looking back since the last edition of Tematica Insights, we’ve received quite a heaping of discouraging data, and the market has reacted accordingly. After the sharp rebound in the market on August 26th and 27th following yet another interest rate cut by China and dovish comments from several Fed officials about the timing of interest rate hikes, the market closed out the last full week of August in the green, with the S&P 500 leaping up 120 points. Still way off the soaring heights we saw back in May, but a nice little rebound from the 1,868 price level we witnessed in the S&P 500 on August 25th, wiping out nearly two years of gains.

But as quick as even this modest glimmer of hope came, renewed concerns over China and Fed interest rate hike timing saw the market finish the month with a whimper as market levels moved downward the last couple of trading days in August. All told, we exited August with all three major US stock market indices — the S&P 500 (our preferred yardstick), the Dow Jones Industrial Average and the Nasdaq Composite Index — all in the red on a year-to-date basis.

china_pmiAs we’ve cautioned, the rash of recent stimulative measures by the Chinese central bankers would have little impact in the short-term, which is exactly what was realized with a first look at the dismal China PMI reading for August (see chart).

Per the report:

Chinese manufacturers saw the quickest deterioration in operating conditions for over six years in August, according to latest business survey data. Total new orders and new export business both declined at sharper rates than in July, and contributed to the most marked contraction of output since November 2011.

Mark our words: this unexpectedly worse situation is going to ripple through economic and earnings expectations. 

screen shot 2015-08-21 at 9.49.41 am
Screen Shot 2015-09-10 at 3.47.02 PMCompounding all of this, new orders as well as new export orders continued to fall in the US according to the August PMI data from Markit Economics (see chart).  This provides more confirmation for what we’ve been seeing in recent weeks in data points such as the declining year-over-year weekly railcar loadings  (see Weekly Rail Traffic Data chart) and weak regional Fed reports. Those domestic findings were echoed by a weaker than expected August ISM manufacturing report, which showed declines almost across the board, including greater drops in new orders.

Despite what the talking heads in Washington would say, there is little doubt the US economy is slowing. 

As if the rash of PMI data wasn’t enough to make one raise an eyebrow about the near-term velocity of the economy, comments from the recent September Beige Book (a qualitative assessment of the U.S. economy compiling findings from each of the 12 Federal Reserve districts) point to concerns over upcoming minimum wage hike increases, as well as higher costs associated with the Affordable Care Act. Eleven of 12 Fed districts reported only “moderate” to “modest growth”, with the Cleveland district reporting only “slight growth”. This compares with 10 districts that reported “moderate” to “modest” growth in the July Beige Book. Most districts described labor demand as “no more than modest” to “moderate”, while most describe actual job growth as “no better than slight” or “modest”.

Soon after the release of Beige Book, we received the August Employment Report with its 5.1 percent unemployment rate, and that hit the market like too much lighter fluid on a blazing charcoal barbeque. This headline employment figure — the last such report the Fed will view before the FOMC meeting — turned up the flames of uncertainty about what will happen with rates. When we parsed the data, however, we once again see Wall Street over-reacting, much the way it did at the end of August.

To us it’s pretty simple. When we look at more people leaving the work force than the number of jobs being added, it becomes pretty obvious that the drop in the Unemployment Rate was due to “bad math.”

Here’s what we mean: when looking at other indicators — Gallup, and parts of the PMI and ISM data — it all helps to paint a much truer picture of the employment situation, as does payroll-to-population and labor force participation rate data of the jobs market. While politicians in Washington, DC will point to the falling Unemployment Rate as being due to “progress”, the reality couldn’t be further from the truth.  Currently, labor force participation, which includes working-age Americans that are actually working or actively looking for work, stands at 62.6 percent — the lowest it’s been since 1977. That doesn’t speak to a healthy employment situation.

LFP

Despite all the would-be euphoria over the stronger-than-forecasted upward revision to 2Q 2015 gross domestic product (GDP), the data of late points to a greater fall should the Atlanta Fed’s GDPNow forecast as of September 3rd of 1.5 percent for the current quarter proves to be correct.

The one bright spot in the all data we’ve consumed over the last few weeks? The Eurozone.

We continue to see Eurozone expansion on the back of improving conditions in Germany, Italy, Spain and other countries. Tempering our enthusiasm, however, we need to be mindful that a contracting China is apt to weigh on the activity in the Eurozone. We’re only now starting to hear about the “China Ripple” — and no, it’s not the latest flavor from Ben & Jerry’s — but the ripple effect from the accelerating China slowdown. Australia’s growth came in at half of expectations, and now German factory orders dropped a larger than expected 1.4 percent in July compared to the previous month, dragged down by flagging foreign demand.

In our opinion, there are too many data points — better known as reasons — that make it hard to see Janet and the Fed’s pulling the rate trigger amid an increasingly uncertain environment. The table on page 5 details our thinking on this.

So, what does all this data point to?

With the unofficial end of summer and back-to-school shopping all rolled into one we find ourselves in “return to work” mode with just three weeks left in the quarter. Soon companies will begin hiding behind the “quiet period” and before too long it will be earnings pre-announcement season. Where did the time go?

As the Labor Day holiday weekend faded away, we see expectations for S&P 500 earnings have seen little change over the last four weeks — that’s in spite of the rash of global economic data we just plowed through, all pointing to slower growth. Let’s go over the numbers, shall we?

On September 3, we saw 2015 earnings expectations at $119.34 per share, down all of just 0.25 percent versus the $119.65 per share forecasts called for as of August 6, according the data from FactSet.

Drilling down a bit deeper into expectations for the current quarter, we see the rising China weakness reported in the July and August PMIs, which also hinted at more to come in September — given new order weakness. The FactSet data also shows third-quarter expectations for the S&P 500 at $29.18 per share. That’s down 0.7 percent from the $29.40 per share forecast on August 6.

Flip it around, and it means the S&P 500 group of companies will need to grow earnings by 7 percent to hit current fourth-quarter expectations of $31.23.

The only times in recent history that the group grew earnings even close to that level was 8.7 percent in 2009 and 5.7 percent in 2013. Both times they managed it without facing the headwinds we now are experiencing.

Color us a tad crazy — and yes we realize that China does not “own” the revenue and profit stream of the S&P 500 — but considering ripple effects, the odds are high that we’ll see a greater impact on the S&P group of companies than just 0.25 percent on the back of China weakness.

Adding to our skepticism is the latest round of “will they-won’t they” Fed coyness over interest rates — this time by John Williams, president of the Federal Reserve Bank of San Francisco. In an interview with the Wall Street Journal just last week, Williams said:

All of the data that we have had up until now has been, I think, encouraging. It …has been about as good, or better, than I was expecting, in terms of the U.S. economy. But there are some pretty significant—and I would say have now grown larger—headwinds that have developed.

Put all this together and it seems, at least to us, that we are waiting for the mythical other shoes to drop. We, like everyone else in America will be watching the Fed and what it will do, or not do, with interest rates next week, which will then be quickly followed by earnings pre-announcements.

All this will provide a glimpse of what we will see in September quarterly earnings. Fasten that seat belt, have your hands on 10 and 2, and make sure your crash helmet is within arms reach!

An Opportunity out of the China Situation that Next to No One Is Talking About

An Opportunity out of the China Situation that Next to No One Is Talking About

What very few are talking about is what happened just after China’s devaluation of its currency on Aug. 11 and how it could affect the U.S. going forward.

When China loosened its grip, its currency fell more than China wanted. To stop the slide, the People’s Bank of China was forced to liquidate more than $100 billion of its reserves to support its currency, effectively engaging in a reverse of quantitative easing.

What asset did China primarily dump? U.S. Treasuries!

Back when the Fed was buying up Treasuries in order to put more money into the economy, a.k.a. quantitative easing, China was continuing its unprecedented reserve-accumulation exercise, which, starting in 2003, amassed almost $4 trillion in foreign assets! That is more than all of the Fed’s QE programs combined. So what we really experienced on a global level was hyper-QE.

If China finds it needs to support its currency even further, as the rest of the world sees its economy slowing and puts downward pressure on the Yuan, it will need to sell more reserves to support its currency, and it has a lot of Treasuries along with other assets available for sale. That will increase the amount of Treasuries on the market, which will push prices down and yields up — again a reverse of what we saw in QE.  And so we are on the cusp of entering the era of quantitative tightening!

Now if that didn’t get your attention, perhaps this geek-out will. A recent working paper published by the Bank for International Settlements titled “Global Dollar Credit and Carry Trades” found that one of the unintended consequences of the Federal Reserve’s quantitative easing program was the significant increase in issuance of dollar-denominated corporate bonds by emerging-market companies where the proceeds primarily fed into existing cash balances, a form of corporate dollar carry trade. The paper cites a 2015 study that estimates that the outstanding dollar-denominated debt of non-bank entities located outside the U.S. was around $9.2 trillion at the end of September 2015, an increase of more than 50% from the beginning of 2010.

In early August we pointed out just how much the dollar has appreciated relative to most every other currency since the end of QE, making this carry trade increasingly untenable. We’ve seen more and more slowing across the globe, with commodity-heavy countries like Australia, New Zealand and Canada (who just reported that it is now in a recession after two quarters of negative GDP growth) engaging in pretty aggressive easing cycles, which will only further weaken their currencies relative to the dollar. What is even more concerning is that a rather large percentage of these firms are in mining, oil and gas sectors, and we all know what has happened to prices for those commodities!

This means we have companies whose domestic currency is sliding further and further against the dollar in sectors that have been utterly slammed, with outstanding dollar-denominated bonds, making those bonds more and more expensive every day — pushing an unwinding of this dollar carry trade. We suspect traders on Wall Street aren’t the only ones stocking up on Mylanta these days, giving Johnson & Johnson ([stock_quote symbol=”JNJ”]) a tailwind in the midst of a tough market!

The Bottomline on all this . . .
Based on the data over the last few weeks and months, in our view the renewed global economic uncertainty —China as well as Russia (thanks to the drop in oil prices) as well as issues in Brazil plus mounting data that points to a slowing domestic economy — will see the Fed hold off hiking interest rates until later in the year if not 2016.

Let’s remember, too, that inflation remains far closer to 0% than the Fed’s 2% target rate, at least for now. While all of that is rather clear to us, for the market the issue is the coy nature of the Fed heads of late. We rather doubt the Fed will want to the tipping point that turns the current slowdown into something worse.


What does this mean for you?
Welcome to the macro jungle! Between China and the enormous dollar carry trade unwind, there are forces that can easily overwhelm any little rate hike the Fed may launch, which we still think is highly unlikely. So, as we see it:

  • The dollar is likely to continue to dominate — which is good for PowerShares DB US Dollar Index ([stock_quote symbol=”UPP”]) or WisdomTree Bloomberg USD Bullish Fund ([stock_quote symbol=”USDU”]).
  • Volatility is not disappearing any time soon — good for those willing to brave iPath S&P 500 VIX Futures ETN ([stock_quote symbol=”VXX”])
  • Emerging-market corporate bonds could get hit hard — not good for funds like iShares Emerging Markets Corporate Bond ETF ([stock_quote symbol=”CEMB”]).
An August We’d All Be Happy to Forget

An August We’d All Be Happy to Forget

Earlier this week, we closed the books on the month of August, and in a word it was one of the worst August months we have seen in some time.

After the sharp rebound higher following yet another interest rate cut by China and dovish comments from several Fed officials about the timing of interest rate hikes, the market closed in the green for the week, but renewed concerns over China and Fed interest rate hike timing saw the market finish the month down with a whimper yesterday. Exiting the month, all three major US stock market indices – the S&P 500 (our preferred yardstick), the Dow Jones Industrial Average and the Nasdaq Composite Index were all in the red on a year to date basis.

As we’ve cautioned, the rash of recent stimulative measures by the Chinese central bankers would have little impact in the short-term and that’s exactly what was realized Tuesday with the dismal China PMI reading for August. Per the report – “Chinese manufacturers saw the quickest deterioration in operating conditions for over six years in August, according to latest business survey data. Total new orders and new export business both declined at sharper rates than in July, and contributed to the most marked contraction of output since November 2011.”

Mark our words; this unexpectedly worse situation is going to ripple through economic and earnings expectations. 

Compounding it, new orders as well as new export orders continued to fall in the US according to Tuesday’s August PMI, providing more confirmation for what the declining weekly railcar loadings and weak regional Fed reports in recent weeks have told us. Those domestic findings were echoed by a weaker than expected August ISM manufacturing report, again published this morning, that showed declines almost across the board with greater drops in new orders. Despite what the talking heads in Washington would say, there is little doubt the US economy is slowing.

The one bright spot in the data this morning was the Eurozone, which continued to expand on the back of improving conditions in Germany, Italy, Spain and other countries. I’ve shared that the weak euro is benefiting net export demand in the region and that continues to happen.  Tempering our enthusiasm, however, we need to be mindful that a contracting China is apt to weigh on the activity in the Eurozone. As we learned overnight, Australia’s economy expanded last quarter at half the forecasted pace as a slowdown in key trading partner China weighed on exports. Given the importance of China as a trading partner for the Eurozone and to the US, the ripple effect on those two economies will soon be felt.With that in mind, let us share two observations.

  1. Despite all the would-be euphoria over the stronger-than-forecasted upward revision to 2Q 2015 gross domestic product (GDP) that occurred last week, the data of late points to a greater fall should the Atlanta Fed’s GDPNow forecast of 1.2% for the current quarter prove to be correct.
  2. Although we had a few very good days in the market, the return of volatility this week on the contracting China news (which wasn’t really all that unexpected given the monetary policy goosing of late) and weakening trajectory of the US economy, should serve as a reminder that rarely do the causes behind such sharp moves lower dissipate so quickly. That means we should expect forecasts for global growth and earnings to be revised as we exit the summer.
In addition to all that unnerving PMI data, this week bring the last set of employment data before the Fed’s next FOMC meeting set for September 16-17. Despite the reported 5.3% unemployment rate from the Bureau of Labor Statistics (BLS), which we see as solid as Swiss cheese, other metrics (payroll to population, labor force participation rate) and the low quality of jobs being created suggest all is not right with the BLS’s findings. That’s why we go one step deeper and look at the employment data found inside the ISM reports, regional Fed PMI reports and other third parties like Gallup.
Buried inside yesterday’s ISM report we learned the employment component once again slowed in August. While ADP’s August Employment Report found an uptick in hiring during August, we’d note the number of jobs created remained below the 200K line and the expected China shakeout and increasing global economic uncertainty is once again like to hit the pause button on hiring and other capital spending plans near-term. As we always say, be sure to look under the hood of the August Employment Report on Friday to get a more accurate read on what it means for the changing economic and demographic landscape here in the US.