Category Archives: Digital Lifestyle

Would you pay $25 to rent a movie?

Would you pay $25 to rent a movie?


Since the advent of the VCR, the basic formulas has been the same: release the movie into theaters, and then after a period of time release to directly to consumers, whether it’s a premium cable channel, VCR tape, DVD, or streaming service.  Of course, what has changed has been the decrease in the period of time between theatrical release and the direct to consumer offer.  Studios are about to test to see if they can make it not only shorter, but immediate:

Theater chains have long resisted the idea of letting studios release movies direct to consumers any sooner than 90 days after the films arrive in the cinemaplex, but reality is starting to set in.In 2016, DVD sales fell nearly 10 percent to $5.49 billion, according to the Digital Entertainment Group, but the overall home-entertainment industry grew 1.4 percent, thanks to streaming and digital sales. Studios get a higher profit margin from digital sales and would rather make their films available sooner rather than letting them linger in theaters for weeks making diminishing returns. A shorter window could also help save on advertising spending, eliminating the need for a separate campaign for home rentals. One answer is charging viewers a higher fee for a chance to see a movie at home just a few weeks after its theatrical release — what’s called a premium on-demand window. Among the major studios, Universal Pictures, Warner Bros. and 20th Century Fox have been the most publicly vocal about this approach. Executives have floated rental prices from $25 to $50, according to people familiar with the matter.

Source: Coming Soon to a TV Near You: Hollywood’s Latest Blockbusters – Bloomberg


On the face of it, $25 might seem staggering; however, when compared to the cost of a family of 4 to go to the movies topping $50 even before the concession stand, it seems like a good deal.  The obvious thematic headwind coming out of this development is the negative impact on the movie theaters. The other thematic headwind to consider is mall owners who are banking on the movie theater as being the new “anchor store” of the mall as retailers such as JC Penney (JCP), Macy’s (M) and Nordstroms(JWN) continue to struggle.

AMC Working On Streaming Service 

AMC Working On Streaming Service 

If you’re a fan of that one show where the undead aren’t the biggest threat to the living, or the one where the Cinnabon guy used to be a shady-ish lawyer, but you want a little more from the shows, you’re just the person AMC is looking for: The cable network is preparing to launch an online video streaming service featuring content related to its popular shows.Reuters, citing people familiar with the matter, reports that the planned service would be available only to customers who also subscribe to a cable TV package and would likely air supporting content — such as short digital-only segments — for its traditional shows.

Source: AMC Reportedly Working On Streaming Service Connected To Cable Packages – Consumerist


This article reports that AMC’s plans to launch its own streaming service is actually in support of cable TV rather than a threat to it.

Come on now, really?

While this first iteration of the service requires an authentication with a cable account, we see this as a trojan horse as AMC builds out its infrastructure and once the cord-cutting tipping point arrives, it’s ready to go to flip the switch and open up streaming to cord-cutters as well.

Bearish Thoughts on General Motors Shares

Bearish Thoughts on General Motors Shares

While higher interest rates might be a positive for financials, at the margin, however, it comes at a time when credit card debt levels are approaching 2007 levels according to a recent study from NerdWallet. The bump higher in interest rates also means adjustable rate mortgage costs are likely to tick higher as are auto loan costs, especially for subprime auto loans. Even before the rate increase, data published by S&P Global Ratings shows US subprime auto lenders are losing money on car loans at the highest rate since the aftermath of the 2008 financial crisis as more borrowers fall behind on payments. If you’re thinking this means more problems for the Cash-strapped Consumer (one of our key investment themes), you are reading our minds.

In 4Q 2016, the rate of car loan delinquencies rose to its highest level since 4Q 2009, according to credit analysis firm TransUnion (TRU). The auto delinquency rate — or the rate of car buyers who were unable make loan payments on time — rose 13.4 percent year over year to 1.44 percent in 4Q 2016 per TransUnion’s latest Industry Insights Report. That compares to 1.59 percent during the last three months of 2009 when the domestic economy was still feeling the hurt from the recession and financial crisis. And then in January, we saw auto sales from General Motors (GM), Ford (F) and Fiat Chrysler (FCAU) fall despite leaning substantially on incentives.

Over the last six months, shares of General Motors, Ford, and Fiat Chrysler are up 8 percent, -2.4 percent, and more than 70 percent, respectively. A rebound in European car sales, as well as share gains, help explain the strong rise in FCAU shares, but the latest data shows European auto sales growth cooled in February. In the U.S., according to data from motorintelligence.com, while General Motor sales are up 0.3 percent for the first two months of 2017 versus 2016, Ford sales are down 2.5 percent, Chrysler sales are down 10.7 percent and Fiat sales are down 14.3 percent.

In fact, despite reduced pricing and increasingly generous incentives, car sales overall are down in the first two months of 2017 compared to the same time in 2016.


So what’s an investor in these auto shares to do, especially if you added GM or FCAU shares in early 2016? The prudent thing would be to take some profits and use the proceeds to invest in companies that are benefitting from multi-year thematic tailwinds such as Applied Materials (AMAT), Universal Display (OLED) and Dycom Industries (DY) that are a part of our Disruptive Technology and Connected Society investing themes.

Currently, GM shares are trading at 5.8x 2017 earnings, which are forecasted to fall to $6.02 per share from $6.12 per share in 2016. Here’s the thing, the shares peaked at 6.2x 2016 earnings and bottomed out at 4.6x 2016 earnings last year, which tells us there is likely more risk than reward to be had at current levels given the economic and consumer backdrop.  Despite soft economic data that shows enthusiasm and optimism for the economy, the harder data, such as rising consumer debt levels paired with a lack of growth in real average weekly hourly earnings in February amid a slowing economy, suggests we are more likely to see GM’s earnings expectations deteriorate further. And yes, winter storm Stella likely did a number of auto sales in March.

Subscribers to Tematica Pro received a short call on GM shares on March 16, 2017


Barron’s Gets Behind our OLED, AMAT and DIS Positions

Barron’s Gets Behind our OLED, AMAT and DIS Positions

Over the weekend, among its many articles Barron’s published two pertaining to several positions on the Tematica Select List — Disruptive Technology plays Universal Display (OLED), Applied Materials (AMAT) and Content is King company Disney (DIS). In our view, each of these articles is bullish for the corresponding shares, but even so let’s review:

In “Corning, Samsung: China’s OLED Spend May Be Big Trouble in 2018, Says Bernstein”  following conversation with 23 companies and industry experts, investment firm Bernstein share their view that, “China is a big force in a rise in spending for display technologies, particularly, OLED, which is taking over from LCD, and also for spending on semiconductors, with the move to so-called 3-D NAND chips.”  The authors of the report go on to say:

“OLED capacity ramp-ups from the Chinese players are even more aggressive than we thought, and hence equipment and material players are benefiting from this ‘OLED capex cycle’. On the semiconductor equipment side, we are seeing a similar story – rising capex for 3D NAND coming from China will translate into good demand for semi equipment makers. Finally, for memory, DRAM supply is tight for now, so read-through is positive for DRAM pricing through 2017.”

We certainly see this rather positive and confirming for our investment thesis on Universal Display and Applied Materials. While many have and will likely continue to focus on Apple (AAPL) and its next iPhone iteration, we see a larger shift going on, much like the one we saw more than a decade ago when light emitting diode (LED) technology exploded. As LED applications expanded from mobile phones and backlighting for LCD TVs to automotive lighting, Cree (CREE) shares took off, which was very positive for our readers at the time since we had a Buy rating on the shares at the time. This time around, we see the same happening for Universal Display shares, especially since we see Universal’s business benefitting from its intellectual property licensing business. In our view that makes the company more like Qualcomm (QCOM) than Cree.

Turning to the second article, “Disney’s Iger On Movies, Parks, ESPN” the author hits a number of points that power our investment thesis — an improving movie slate and recent park price increases that should drive revenue higher this year. The article also bangs a familiar drum that is ESPN, which continues to hemorrhage customers as more and more cut the cord, but it also mentions that Disney is expected to launch its own over the top ESPN service later this year as well as ESPN landing on other over the top services like our own AT&T’s (T) DirectTV NOW. As we recently shared, Disney is also focusing on cost control inside ESPN, including laying off TV, radio, and online personalities as part of a plan to “trim $100 million from the 2016 budget and $250 million in 2017.”

Getting back to Disney’s film business, its latest release, live-action “Beauty and the Beast” delivered a record-setting weekend box office opening with $170 million. Not only was this a record-setting March opening weekend, but the seventh largest domestic opening of all-time. Internationally, “Beauty and the Beast” delivered an estimated $180 million in ticket sales from 44 material markets for an estimated $350 million global opening, making it the #14 on the all-time best list. We can already see the Disney merchandise flying off the shelves now and later this year when the DVD and video on demand releases hit just in time for year-end holiday shopping. Much the way Disney is adding Frozen and Star Wars franchise attractions to its park, we would not be surprised to see a Beauty and the Beast addition as well.

  • We continue to rate Universal Display (OLED) shares a Buy with a $100 price target.
  • Our rating on Applied Materials (AMAT) remains a Buy with a $47 price target. 
  • We continue to rate Disney (DIS) shares a Buy with a $125 price target.
More U.S. Households Now Have Netflix Than a DVR… Who Even Has a DVD Player Anymore?

More U.S. Households Now Have Netflix Than a DVR… Who Even Has a DVD Player Anymore?

The power of streaming the content you want, when you want it on the device you prefer is not to be underestimated. It’s been a sea-change in how people consume content, and that has led to a shift in the hardware that people use. With Netflix outstripping digital video recorders (DVRs), we have to question how much longer companies will manufacture those devices, which could be problematic for Tivo, a company that has already been contending with built-in DVR functionality inside digital cable set-top boxes. With Google set to unveil a TV streaming service with DVR functionality in the Cloud, it’s looking more and more like the only streaming hardware we may need will be smartphones, tablets, and smart TVs…. no good for all that cable set-top box subscription fee revenue at Comcast and others. Technology evolution…. a great tailwind for some, and a painful headwind for others.

Netflix has hit a new milestone: More U.S. television households now have the streaming service than a digital video recorder, according to a recent study.

About 54% of U.S. adults said they have Netflix in their household — while 53% have a DVR, according to Leichtman Research Group’s annual on-demand study. It’s the first time that households with Netflix (including those that use shared accounts) have surpassed the level of those with a DVR in the history of LRG’s studies. In 2011, according to the research firm, 44% of TV households had a DVR and 28% had Netflix.

Netflix has now eclipsed DVR usage despite the latter having a years-long head start. TiVo’s first digital video recorder shipped in 1999, while Netflix debuted its video-streaming service in 2007 and started the shift away from its DVD-by-mail business. As of the end of 2016, Netflix had 49.4 million streaming subscribers in the U.S., up 10.5% year over year.

Overall, 64% of respondents said they get a subscription video-on-demand service from Netflix, Amazon Prime Video, and/or Hulu.

Source: More U.S. Households Now Have Netflix Than a DVR | Variety

Thematic Tailwinds and Headwinds Drive February Retail Sales 

Thematic Tailwinds and Headwinds Drive February Retail Sales 

This morning the US Department of Commerce published its February Retail Sales report, which was in line with expectations growing 0.1 percent compared to January. This report is always an interesting read due in part to the fact that we can look at the data a number of ways — month over month, year over year, and three-month comparisons on a trailing and year over year basis. As you can imagine, this can lead to quite a bit of confusion when trying to puzzle together exactly what the investing signal is coming out of that retail report noise.

Here’s our take on it featuring the thematic lens that we hang our hat at here at Tematica . . .

February 2017 vs. January 2017

Month over month retail sales climbed by 0.1 percent, in line with expectations. The four categories that saw faster spending growth than the average were furniture (+0.7 percent), building materials (+1.8 percent), health & personal care stores (+0.7 percent) and nonstore retailers (+1.2 percent). The sequential increase in building material demand, as well as furniture, fits with the mild winter weather that led to a pickup in construction employment and a stronger than seasonal pickup in housing starts.

The continued tick higher in health & personal care stores ties with our Aging of the Population investing theme. We continue to see this category rising faster than overall retail spending as the first baby boomers turn 70 this year with another 1.5 million each year for the next 15 years. The scary part is of these baby boomers, roughly only 50 percent have saved enough for retirement, which touches on our Cash Strapped Consumer investing theme.

Finally, we once again see Nonstore retailers taking consumer wallet share in February, which comes as no surprise as Amazon and other retailers continue to expand their service offerings and geographic footprints, while other traditional brick & mortar retailers focus on growing their direct to consumer business. In short, our Connected Society investing theme continues to transform retail.

Month over month weakness was had at electronics & appliance stores, clothing, and department stores. Compared to January gasoline station sales ticked down modestly as well, which we attribute to the essentially flat gasoline prices month over month per data from AAA.


February 2017 vs. February 2016

Year over year February Retail Sales excluding autos and food rose 5.9 percent led by a 19.6 percent increase in gasoline station sales, a 13.0 percent increase in Nonstore retail, a 7.3 percent rise in building materials, a 7.0 percent increase at health & personal care stores. Without question, the rise in gasoline station sales reflects the year over year 18 percent increase in gas prices per AAA data, while the milder winter we discussed earlier is likely pulling demand forward in construction and housing — we’ll look for February and March housing data to confirm this. The rise in gas prices reflects OPEC oil production cuts, which serves as a reminder that oil and other energy products are part of our Scarce Resource investing theme — there is only so much to be had, and production levels dictate supply.

As far as the year over year increase in health & personal care goes, it’s the same story — the Aging of the Population as Father Time is a tough customer to beat no matter how people embrace our Fountain of Youth investing theme. Finally, and certainly no surprise is the continued increase in Nonstore retail sales. Candidly, we see no slowdown in this Connected Society shift — all we need to do is look at the evolving shopping habits of the “younger” generation.

The two big declines were had were…. no surprise….. electronic & appliance stores, which fell 6 percent year over year, and department stores, which dropped 5.6 percent compared to February 2016.  With hhgregg (HGG) closing a good portion of its stores and JC Penney (JCP) recently announcing even more store closures, the results of these two categories, which are likely feeling the heat from Amazon (AMZN) in particular and others benefiting from the Connected Society tailwind, the results from these two categories is anything but surprising.

If we look at the three month rolling average on both a sequential and year over year basis, the leaders remained the same — building materials, gasoline stations, Nonstore retail and health & personal care. Behind each of these there is a clear thematic tailwind, even construction and housing, which is has historically been a beneficiary of the rising aspect of our Rise & Fall of the Middle Class investing theme. We’ll have a better sense of that with tomorrow’s February Housing Starts and Building Permits report.

And just in case anyone was holding out hope for electronics & appliance stores and department stores, the three-month rolling averages showed continued declines on both on a sequential and year over year basis. Nothing like a thematic headwind to throw cold water on your business.

The question to us is whether we will see more M&A chatter like we saw several weeks back with Macy’s (M) and more recently with Hudson Bay (TSE:HBC) being interested in Neiman Marcus. We can understand one company picking off well-positioned assets that might improve its overall customer mix, but we suspect there will be a number of companies left standing with no dance partners when this game of retail musical chairs is over. That means more companies going the way of Wet Seal than not, which means pain for mall REIT companies like Simon Property Group (SPG).

Before we go, we have to mention the piece by Tematica’s Chief Macro Strategist, better known on the Cocktail Investing Podcast as the High Priestess of Global Macro, Lenore Hawkins, which  called out the lack of weekly, year over year wage growth in February. Paired with higher prices, such as gas prices and others, that are leading to a pickup in reported inflation, it tells us our Cash-strapped Consumer investing theme has more room to go.

Hat tip to Lenore Hawkins, who added her special sauce and insights to this viewpoint. 

Note: Tematica’s subscription trading service, Tematica Pro, has a short position in SPG shares. 


The data tells us that things aren’t exactly headed in the direction of an expanding economy

The data tells us that things aren’t exactly headed in the direction of an expanding economy

The start of March — the last month in the current quarter — started off on a much softer note than January and February, with far more modest gains in the stock market. Call it the calm before the Fed storm, given the next Federal Open Market Committee meeting next week. As we’ve moved closer to the FOMC meeting, the market’s expectations for the Fed to boost rates have climbed, but at the same time, we’ve gotten a number of conflicting data points.

Earlier this week in the Monday Morning Kickoff, we pointed out the weaker than expected January core capital goods orders and shipments, as well as disappointing January personal spending relative to expectations previously. Added to the mix are light vehicle sales data from last week and then the Atlanta Fed cutting its GDPNow forecast for the current quarter to 1.3 percent, down from 1.8 percent on March 1.

Not the direction of an expanding economy, but rather a slowing one, given the latest view that GDP in 4Q 2016 clocked in at 1.9 percent. As we outlined in this week’s Monday Morning Kickoff, there are a growing number of reasons to be cautious and the downward move in GDP expectations is another one, especially given the market’s current valuation.

Another reason for our cautiousness was published by WalletHub this week in a report based on Federal Reserve data that reminds us the Cash-strapped Consumer is alive and well. Per the report, U.S. consumers racked up $89.2 billion in credit card debt during 2016, pushing outstanding balances to $978.9 billion, which is roughly $3 billion below the all-time record set in 2007. Let’s put that into perspective — it equates to the average indebted household owing $8,377 to creditors. Yikes!

WalletHub projects that in 2017 we will surpass the current record by at least $100 billion. Not so good for an economy that has become reliant upon the consumer. This also helps explain why Automotive News reported incentive spending by automakers averaged $3,443 per vehicle in February, up 14 percent from a year ago. Another warning sign.

We’d also add in the growing brouhaha over the efforts to replace the Affordable Care Act, which given the response to the House bill put forth this week, looks to be on a course that is going to be less than smooth sailing. Following the issues surround the Executive Order on immigration, our concern is the market could wake up to the fact that it is going to take more time than expected for President Trump’s fiscal policies, especially tax reform, to ignite the domestic economy.

Given all these issues, it should be obvious why we recently raised a number of our stop loss positions, and we’ll continue to review them on an ongoing basis. Odds are we could see the market pullback in the coming weeks, and our strategy will be to scale into several positions on the Tematica Select List at better prices.


Checking in on Applied Materials and It Looks Good

A few weeks ago we added shares of semiconductor and display capital equipment company Applied Materials (AMAT) to the Tematica Select List as a Disruptive Technology play. As a quick reminder, Applied’s business is benefitting from next generation chip and display technologies that are forcing a ramp in new equipment demand. We’ve talked much about the adoption of organic light emitting diode display that has powered our Universal Display (OLED) shares higher (up nearly 57 percent as of last night’s close), but Applied is also seeing favorable demand signals for its chip equipment business.

Earlier this week, the Semiconductor Industry Association (SIA) reported worldwide sales of semiconductors rose 13.9 percent year over year to $30.6 billion for the month of January 2017. We’d note that January marked the global market’s largest year-to-year growth since November 2010, which to us confirms that chips, not cotton, are the new fabric of our increasingly digital lives.

Strong chip sales mean industry capacity should get tighter and foster additional demand for new industry capacity, and thus orders for Applied’s chip equipment business. We’re seeing tight capacity especially in the global NAND flash storage market, which led to sharp average selling prices in during 4Q 2016 per data from DRAMeXchange. Tight NAND flash supply is expected to persist through 2017 as the industry migrates to 3D NAND technology, which is spurring equipment demand at Applied as Samsung and Toshiba look to increase their output of 3D NAND flash throughout 2017.

  • We continue to rate AMAT shares a Buy with a $47 price target.
  • We continue to rate OLED shares a Buy with a $100 price target.


On Deck – Disney’s Annual Shareholder Meeting

The Walt Disney Company Chairman and CEO Robert Iger. (Photo by Chip Somodevilla/Getty Images)

Later today Content is King company Walt Disney will hold its annual shareholder meeting, and while we don’t expect anything material to emerge, CEO Bob Iger usually offers a pretty good rundown of the upcoming movie slate. As we have seen in the past and again more recently with Frozen, Star Wars and Marvel movies, the films lead to new park attractions and drive its merchandise business. So yes, we will be tuning in to hear what’s said later today.

  • As the company continues to focus on tentpole films that will ripple through its other businesses, we continue to rate Disney a Buy.
  • Our price target remains $125.
A quick reminder on being stopped out on Costco.

Last Friday afternoon we were stopped out of Costco Wholesale (COST) shares on the Tematica Select List when they briefly dipped below our $170 stop loss. Even though it was for the briefest of moments, the $169.90 low for the day means that the protective measure was triggered following quarterly earnings that missed expectations Thursday night.

Recall we sold half the position for a gain of more than 14 percent before dividends, and when paired with the stopping out of the remainder of the position, the blended return before dividends on the Tematica Select was 14 percent vs. a 9.8 percent move in the S&P 500 over the same time frame.

Given the business model dynamics and Costco continuing to benefit from the Cash-strapped Consumer tailwind, we’re inclined to revisit the shares in the coming weeks. The shares have continued to trade-off throughout this week in the $166 to $167 range, but we’re keeping an eye toward getting them back on the Tematica Select List at even better prices.

Post IPO Thoughts on Snap Shares and the $34.7 Billion Market Cap Question

Post IPO Thoughts on Snap Shares and the $34.7 Billion Market Cap Question

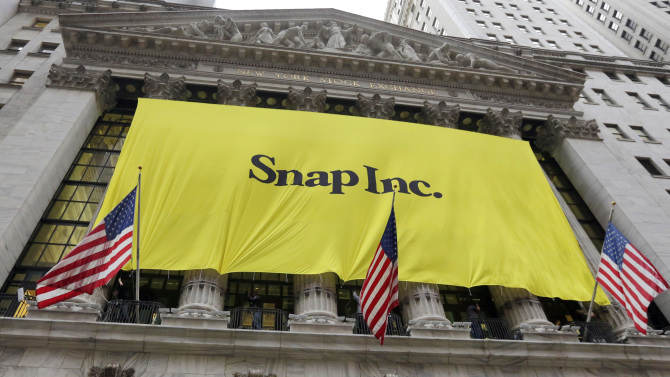
Last Thursday, March 2, shares of Snapchat parent Snap Inc. (SNAP) went public at $17, well above the $14-$16 initial public offering range. The shares hit a high of $29.44 on Friday morning before closing the week out at $27.09. That quick gain of just under 60 percent was great for investors that were involved with the IPO, but it wasn’t quite the same for investors that entered into SNAP shares after the shares started trading on Thursday morning.

With SNAP shares now trading in the secondary market and the buildup of the IPO now behind us, the question to us is are SNAP shares really worth the current $34.7 billion in market capitalization? At that market valuation, the shares are trading at about 37 times EMarketer’s estimate for Snap’s 2017 advertising sales. As spelled to out in the S-1 filing, Snap’s Snapchat is free and the company generates revenue “primarily through advertising,” the same was true of Facebook (FB) and Twitter (TWTR).

Actually, that’s not THE question, but rather one of the key questions as we contemplate if there is enough upside to be had in SNAP shares from current levels to warrant a Buy rating? Odds are the IPO underwriters, which include Morgan Stanley (MS), Goldman Sachs (GS), JPMorgan Chase (JPM), and Deutsche Bank (DB), that made a reported $85 million in fees from the transaction, will have some favorable research comments on SNAP shares in the coming weeks.

While SNAP shares fit within the confines of our Connected Society investing theme and are likely to benefit from the shift in advertising dollars to digital and social media platforms like Facebook and Alphabet’s (GOOGL) Google and YouTube, our charge is to question using our thematic 20/20 foresight to see if enough upside in the shares exists to warrant placing them on the Tematica Select List?

Boiling this down, it all comes down to growth

The question when looking at Snap is, “Can it grow its revenue fast enough and deliver positive earnings per share so we can see at least 20 percent upside in the shares?”

Well, right off the bat the company’s user base of 158 million active daily users was relatively flat in the December quarter and grew just 7 percent between 2Q 2016 and 3Q 2016.  Assuming the company is able to continue to grow its user base, something that has eluded Twitter for the most part, it will still need to capture a disproportionate amount of the mobile advertising market to hit Goldman Sach’s forest that calls for Snap to increase its revenue fivefold by 2018.

Snap recorded $404.5 million in revenue last year, up from $58.7 million in 2015, so a fivefold increase would put 2018 revenue at more than $2 billion. IDC projects that mobile advertising spend will grow nearly 3x from $66 billion in 2016 to $196 billion in 2020, while non-mobile advertising spend will decrease by approximately $15 billion during the same time period.

While a fivefold increase in revenue catches our investing ears, we have to question Snap’s ability to garner such an outsized piece of the mobile advertising market when going head to head with Facebook and its several platforms, Google, Twitter and others. The argument that a rising tide will lift all boats will only go so far when all of those boats are vying for the same position in the monetization river.

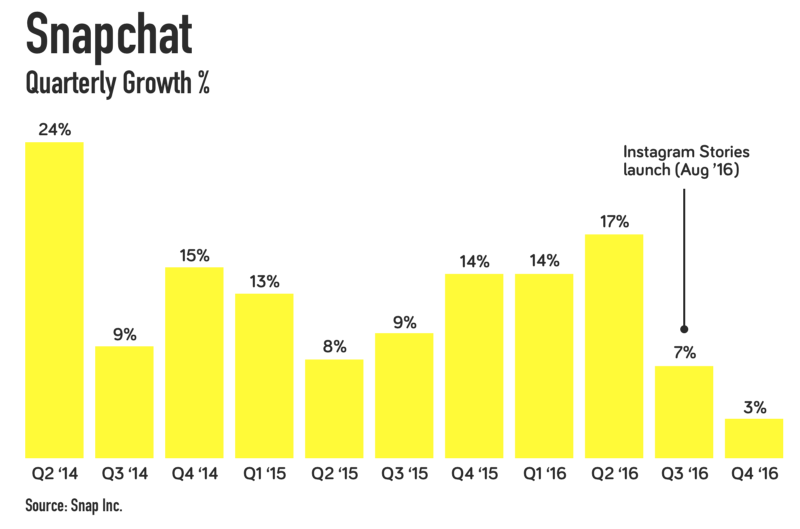
There are other reasons to be skeptical, including users migrating to newer social media platforms or ones that have been updated like Facebook’s Instagram that launched Stories to better compete with Snapchat. Snap called this out as a competitive concern in its S-1 filing — “For example, Instagram, a subsidiary of Facebook, recently introduced a “stories” feature that largely mimics our Stories feature and may be directly competitive.” With good reason, because as Instagram Stories reached 150 million daily users in the back half of 2016, Snapchat’s growth in average daily user count slowed substantially. Part of that could be due to Snap’s reliance on the teen demographic, which even the company has noted is not “brand loyal.” We’re not sure anyone has figured out how to model teen fickleness in multi-year revenue forecasts.


Making things a tad more complicated is the recent push back on digital advertising by Proctor & Gamble’s (PG) Chief Marketer Marc Pritchard, who publicly expressed his misgivings with today’s digital media practices and, “called on the media buying and selling industry to become transparent in the face of ‘crappy advertising accompanied by even crappier viewing experiences.'” As Pritchard made those and other comments, a survey from the World Federation of Advertisers showed that large brands are reviewing contracts related to almost $3 billion of advertising spend on programmatic advertising, which automates digital ad placement. The question to be answered is whether ads are actually seen and this has led to a call for companies like Snap to follow Facebook, YouTube and have Snapchat’s ad metrics audited by the Media Rating Council.


One other wrinkle in the Snap investing story is the company has yet to turn a profit.

In 2016, while Snap’s revenue was just over $400 million, it managed to generate a loss off $514.6 million and per the S-1 it will need to spend a significant amount to attract new users and fend off competition. In reading that, the concern is user growth could be far slower — and expensive — than analysts are forecasting, which would impact advertising revenue growth like we’ve seen at Twitter. The thing is, new user growth for Snapchat already slowed in the back half of 2016 as newer messaging apps like Charge, Confide and Whisper have come to market.

When Snap finally does turn a profit, we could see the outsized P/E ratio lead value and growth at a reasonable price (GARP) investors to balk at buying the shares, which means Snap will be relying on growth investors. It amazes us how some investors love companies even though they are not generating positive net income, but balk at P/E ratio that is too high the minute they start to generate positive albeit rather small earnings per share. We get around that problem by using a multi-pronged valuation approach to determine upside and downside price targets.


Is Snap the Next GoPro?

While all those numbers and forecasts are important to one’s investment decision making process (we make that point clear in Cocktail Investing: Distilling Everyday Noise into Clear Investment Signals for Better Returns), we have a more primal issue with Snap. Back in late 2015, we shared our view that GoPro (GPRO) was really a feature, not a product. As we said at the time, we saw Yelp (YELP), Angie’s List (ANGI), Groupon (GRPN) and others as features that over time will be incorporated into other products — like Facebook’s Professional Services, those at Amazon (AMZN) or others from Alphabet’s Google, much the way point-and-shoot cameras were overtaken by camera-enabled smartphones and personal information management functions were first incorporated into mobile phones and later smartphones, obviating the need for the original Palm Pilot and other pocket organizers.

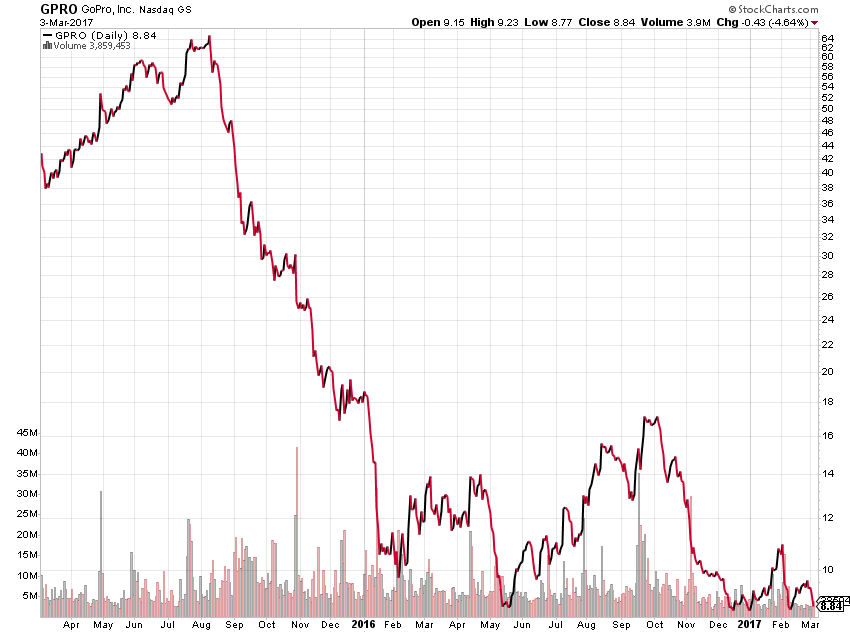
When GoPro shares debuted in June 2014, they were a strong performer over the following months until they peaked near $87, but 15 months after going public GPRO shares fell through the IPO price and have remained underwater ever since.

What happened?

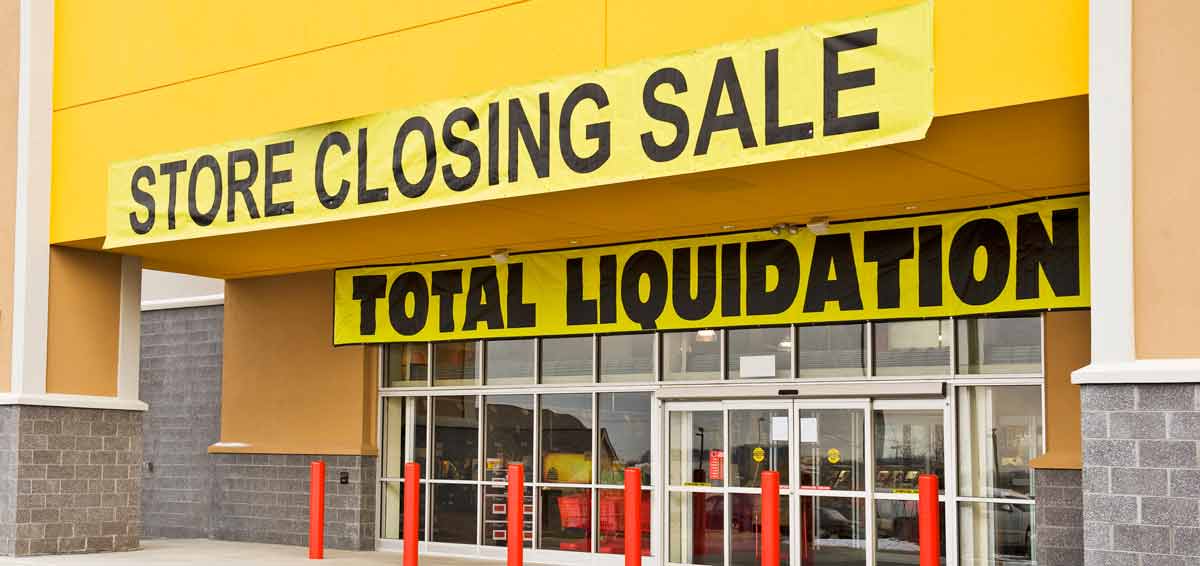
We recall hearing plans for a video network of user channels at GoPro as well as the management team touting the company as an “end to end storytelling solution,” but over the last few quarters, we’ve heard far more about new product issues, layoffs, facility closures and falling unit sales.  In 2016, GoPro saw camera unit sell-through fall 12 percent year-over-year to 5.3 million units from approximately 6 million units in 2015.

In our view, what happened can be summed up rather easily — GoPro was and is a feature, not a standalone product. It just took the stock market some time to figure it out once the IPO blitz and glory subsided. While we could be wrong, we have a strong suspicion that Snap is more likely to resemble GoPro than Facebook, which is monetizing multiple platforms as it extends its presence with new solutions deeper into the lives of its users and has changed the way people communicate.

As investors, we at Tematica would much rather own innovators of new products and solutions that are addressing pain points or benefitting from disruptive forces and changing economics, demographics, and psychographics in the marketplace than companies that offer features that will soon be co-opted by other companies and their products. Following that focus on 20/20 foresight, we avoided GoPro shares that fell from $19.50 in December 2015 to the recent share price of $8.84.

GoPro 2-year Share Price Performance


And then there’s this . . . 

There is another consideration which is not specific to Snap, but is rather an issue that all newly public companies must contend with — the lock-up expiration. For those unfamiliar with it, the lock-up period is a contractual restriction that prevents insiders who are holding a company’s stock, before it goes public, from selling the stock for a period usually between 90 to 180 days after the company goes public. Per Snap’s S-1, its lock-up expiration is 150 days, which puts it in 3Q 2017. Given the potential that insider selling could hit the shares, and be potentially disruptive to the share price, we tend to wait until the lock-up expiration comes and goes before putting the shares under the full Tematica telescope. This isn’t specific to Snap shares, but rather it’s one of our rules of thumb.

We have a strong suspicion that Snap is more likely to resemble GoPro than Facebook, but we’ll keep an open mind during the SNAP shares lock-up period, after all, companies are living entities that can move forward and backward depending on the market environment and leadership team. Let’s remember too that it took Facebook some time to figure out mobile.

Finally, we aren’t so thrilled that none of the 200 million shares floated came with voting rights, leaving the two founders Evan Spiegel and Robert Murphy with total control of the company. We prefer seeing more direct shareholder accountability… but hey, that’s us.


Verizon and AT&T Go Unlimited Data, Now Chevrolet Does Too

Verizon and AT&T Go Unlimited Data, Now Chevrolet Does Too

We’re seeing Connected Society mobile carriers morph their business models toward Content is King given their thinking that people will want to consume content on all these mobile devices. It’s true, so true in fact that Chevrolet is following AT&T and Verizon in offering an unlimited data plan for Chevrolet owners who have an in-vehicle OnStar 4G LTE Wi-Fi hotspot. Priced at $20/month, it’s another step forward for the Connected Car; in 2016 Chevrolet owners and their passengers streamed the equivalent of more than 17.5 million hours of video. Let’s just hope the driver had his or her eyes on the road and hands on the wheel… that said does it mean movie time will now be had in the car once self-driving cars go mainstream?

The new plan is priced at $20/month with service provided by AT&T.AirPodsChevrolet is claiming to be the first major automaker to offer an unlimited in-vehicle data plan.

The automaker shared interesting data about its customers who have been using the OnStar LTE hotspot in Chevrolet vehicles over the last few years. In 2016 in-vehicle data usage grew almost 200% as compared to 2015.To put this data usage in perspective, Chevrolet owners and their passengers streamed the equivalent of more than 17.5 million hours of video in 2016.

“We have contractors bidding jobs in their Silverados, families streaming movies in their Suburbans and Malibus and everyone tapping into the cloud for music,” said Alan Batey, president of GM North America and global head of Chevrolet. “With the most affordable unlimited 4G LTE data plan in the auto industry, the widest availability of Apple CarPlay and Android Auto and new connected services like OnStar AtYourService, our momentum can only grow.”

As the first automaker to offer 4G LTE connectivity across its entire retail portfolio, Chevrolet has sold more than 3.1 million OnStar 4G LTE-connected vehicles since June 2014 and has more vehicles on the road equipped with 4G LTE than any other automaker.

Chevrolet’s new unlimited prepaid data plan via OnStar and AT&T will be available starting tomorrow for $20/month. It doesn’t seem to be a limited time offer (as least for now) and looks to be a great deal as currently the $20/month option is for 4GB with $40/month giving customers 10GB.

Source: Chevrolet is first automaker to offer in-vehicle unlimited data for $20/month | 9to5Mac

Cocktail Investing Ep 6: The growing divide between the hard & the soft economic reports, boxed.com CEO Chieh Huang

Cocktail Investing Ep 6: The growing divide between the hard & the soft economic reports, boxed.com CEO Chieh Huang

In this week’s program, Tematica’s cocktail mixologists, Chris Versace and Lenore Hawkins talk about everything from the market’s reaction to Trump’s speech before Congress to the widening divide between the real hard economic data reports coming in, (spoiler alert – not so hot) and the softer sentiment reports which are on fire, as well as the latest Thematic Signals. From mobile carriers moving more and more into content in our Connected Society in which Content is King to McDonald’s experimenting with different delivery models for our Cash Strapped Consumer who is eschewing quick service restaurants, preferring Foods with Integrity.

This week we saw the wind down to the December quarter earnings season, Trump’s first speech before Congress and Amazon Web Services wreaked havoc on businesses far and wide when it went down. Snap, the parent company of Snapchat, traded publicly for the first time and despite iffy fundamentals, the share price jumped up dramatically.

January’s real personal income growth weakened materially while real spending growth was the weakest since 2009 – not exactly consistent with the jubilant headlines. It also raises questions for our consumer spending led economy. With signs of inflation picking up both in and outside the US per February data from Markit Economics and ISM, the Fed is looking more like it will hike in March, despite their recent Beige book being full of terms like “modest”, “moderate”, “mixed” and subdued” – go figure.

McDonald’s is looking to offer mobile ordering alongside curbside pickup as it experiences declining foot traffic and same store sales. As we share on the podcast, we think embracing technology is not going to get at the heart of McDonald’s problems.

Mobile carriers are finding more and more they need to feed their networks with content as more than 80 percent of 18 to 34-year-olds in the U.S. use mobile platforms to consume content, spending more than two hours on average every day viewing videos or using apps. We think this is bound to result in a boom for the eye-glass and contact lens industry in a few years time – we’re only half kidding.

If that all wasn’t enough, we had the great pleasure of speaking with Chieh Huang, CEO of our latest online shopping obsession, Boxed.com. In just four years Chieh and his team have grown the business from operating out of Chieh’s garage to now generating over $100 million in revenue while getting their products to 96 percent of their customers in just two days or less. We spoke with him about just how his team has generated such stellar growth and his insights into the incredible level of pain we see in the retail sector. We couldn’t have enjoyed ourselves more talking with a guy who is deep in the thick of a Disruptive Technology with a compelling offering for the Cash Strapped Consumer in our Connected Society.

Companies mentioned on the Podcast

  • ALDI
  • Amazon.com (AMZN)
  • Apple (APPL)
  • AT&T (T)
  • Boeing (BA)
  • Comcast (CMCSA)
  • Costco (COST)
  • Dycom (DY)
  • Goldman Sachs (GS)
  • Facebook (FB)
  • Lidl
  • McDonald’s (MCD)
  • Snap (SNAP)
  • United Parcel Service (UPS)
  • Verizon (VZ)
  • Walmart (WMT)
  • Wegmans Food Markets


Chris Versace Tematica Research Founder and Chief Investment Officer
Lenore Hawkins Tematica Research Chief Macro Strategist