Category Archives: Middle Class Squeeze

Weekly Issue: Investor anxiety continues

Weekly Issue: Investor anxiety continues

Key points inside this issue

  • As the investors grapple with anxiety over trade as well as the speed of economic and earnings growth, we’ll continue to hold ProShares Short S&P 500 (SH) shares.
  • Our price target on the shares of Guilty Pleasure Thematic Leader Del Frisco’s Restaurant Group (DFRG) remains $14.
  • Our price target on Middle-Class Squeeze Thematic Leader Costco Wholesale (COST) shares remains $250.
  • Our price target on Amazon (AMZN) shares remains $2,250


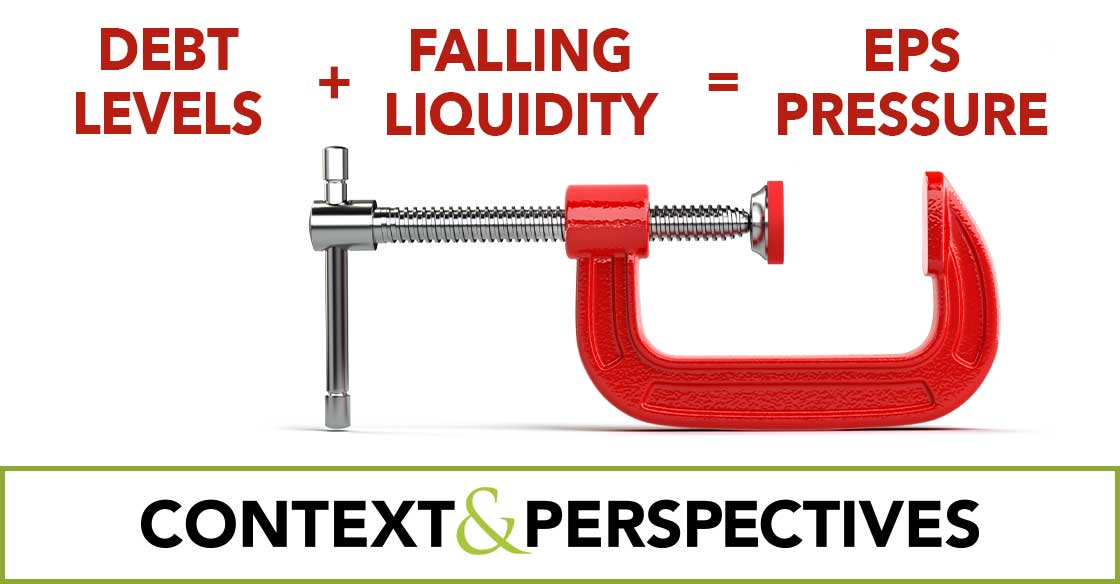
The stock market experienced another painful set of days in last week as it digested the latest set of economic data, and what it all means for the speed of the domestic and global economy. Investors also grappled with determining where the U.S. is with regard to the China trade war as well as the prospects for a deal by the end of March that would prevent the next round of tariffs on China from escalating.

There remain a number of unresolved issues between the U.S. and China, some of which have been long-standing in nature, which suggests a fix in the next 100+ days is somewhat questionable. This combination induced a fresh round of anxiety in the market, leading it to ultimately finish the week lower as the major indices sagged further quarter to date. In turn, that pushed all the major market indices into the red as of Friday’s close, most notably the small-cap heavy Russell 2000, which finished Friday down 5.7% year to date. For those keeping score, that equates to the Russell 2000 falling just under 15% quarter to date.

Last week we added downside protection to our holdings in the form of ProShares Short S&P 500 (SH) shares, and we’ll continue to hold them until signs of more stable footing for the overall market emerge. As we do this, I’ll continue to evaluate not only the thematic signals that are in and around us day-in, day-out, but also examine the potential opportunities on a risk to reward basis the market pain is creating.


Shares of Del Frisco’s get some activist attention

Late last week, our shares of Guilty Pleasure Thematic Leader Del Frisco’s Restaurant Group (DFRG) bucked the overall move lower in the domestic stock market following the revelation that activist hedge fund Engaged Capital has acquired a nearly 10% in the company with a plan to push the company to sell itself according to The Wall Street Journal. Given the sharp drop in DFRG shares thus far in 2018, down 52%, it’s not surprising to see this happen, and when we added the shares to our holdings, we shared the view that at some point it could be a takeout candidate as the restaurant industry continues to consolidate. In particular, Del Frisco’s presence in the higher end dining category and its efforts over the last few months to become a more focused company help explain the interest by Engaged.

In response, Del Frisco’s issued the following statement:

“Del Frisco’s is committed to maximizing long-term value for all shareholders. While we do not agree with certain characterizations of events or of our business and operations contained in the letter that we received from Engaged Capital, the Company values constructive input toward the goal of enhancing shareholder value. “

Compared to other Board responses this one is rather tame and suggests Del Frisco’s will indeed have a dialog with Engaged. Given the year to date performance in DFRG shares, odds are there are several on the Board that are frustrated either with the rate of change in the business or how that change is being viewed in the marketplace.

In terms of who might be interested in Del Frisco’s, we’ve seen a number of going private transactions in recent years led by private equity investors that re-tool a company’s strategy and execution or combine it with other entities. We’ve also seen several restaurant M&A transactions as well. Let’s remember too how on Del Frisco’s September quarter earnings conference call, the management team went out of its way to explain how the business performed during the last recession. That better than industry performance may add to the desirability of Del Frisco’s inside a platform, multi-branded restaurant company.

As much as we may agree with the logic behind Del Frisco’s being taken out, we’d remind subscribers that buying a company on takeout speculation can be dicey. In the case of Del Frisco’s, we continue to see a solid fundamental story. We are seeing deflation in food prices that bode well for Del Frisco’s margins and bottom line EPS. Over the last quarter we’ve seen prices in the protein complex – beef, pork, and chicken – move lower across the board. According to the United Nation’s Food and Agriculture Organisation’s (FAO) food price index, world food prices declined during the month of November to their lowest level in more than two years. We’re also seeing favorable restaurant spending per recent monthly Retail Sales reports, which should only improve amid year-end holiday dinners eaten by corporate diners and individuals.

We’ll continue to hold DFRG for the fundamentals, but we won’t fight any smart, strategic transaction that may emerge.

  • Our price target on the shares of Del Frisco’s Restaurant Group (DFRG) remains $14.


What to watch in the week ahead

As we move into the second week of the last month of the quarter, I’ll continue to examine the oncoming data to determine the vector and velocity of the domestic as well as global economy. Following Friday’s November Employment Report that saw weaker than expected job creation for the month, but year over year wage gains of 3.1% the Atlanta Fed continued to reduce its GDP forecast for the current quarter. That forecast now sits at 2.4%, down from 3.0% at the end of October.

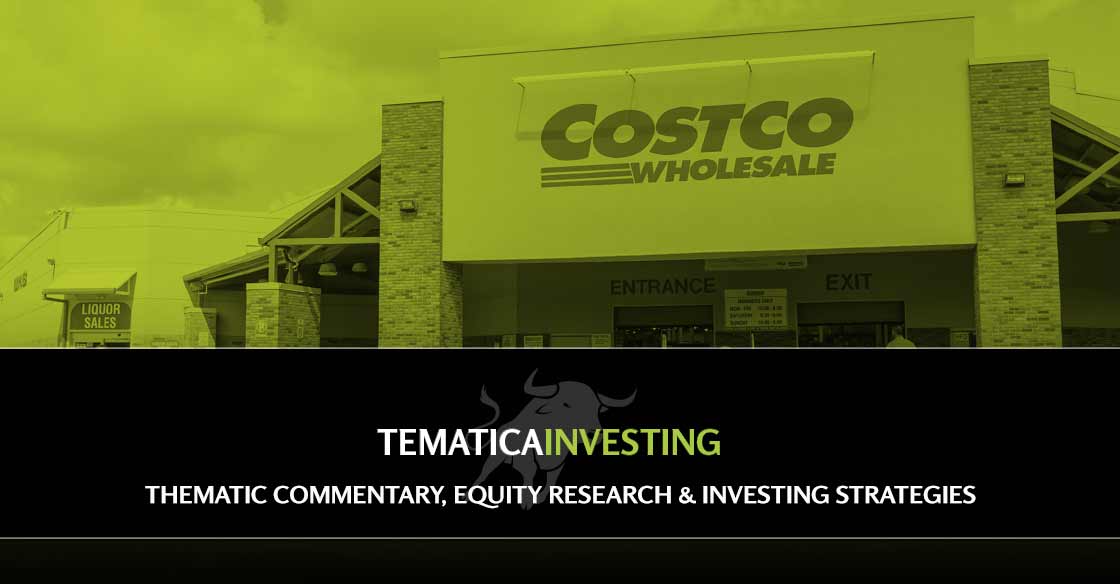
With the sharp drove in oil prices has consumers feeling a little holiday cheer at the gas pump, odds are next week’s November inflation reports will be tame. The fact that world food prices per the Food and Agriculture Organization’s (FAO) food price index hit the lowest level since May 2016 also bodes well for a benign set of inflation data this week. Later in the week, we’ll get the November Retail Sales report, which should be very confirming for our holiday facing positions – Amazon (AMZN), United Parcel Service (UPS), McCormick & Co. (MKC) and Costco Wholesale (COST) – that given the kickoff of “seasons eatings” with Thanksgiving and the start of the holiday shopping season that clearly shifted to digital shopping.

That report will once again provide context for this shift as well as more than likely confirm yet again that Costco Wholesale (COST) continues to take consumer wallet share. Speaking of Costco, the company will report its quarterly results this  Thursday. Quarter to date, the company’s monthly same store sales reports are firm evidence it is winning consumer wallet share, and we expect it did so again in November, especially with its growing fresh foods business that keeps luring club members back. Aside from its top and bottom line results, I’ll be focused once again on its pace of new warehouse openings, a harbinger of the crucial membership fee income to be had in coming quarters.

  • Our price target on Middle-Class Squeeze Thematic Leader Costco Wholesale (COST) shares remains $250.

We’ll end the economic data stream this week with the November Industrial Production report. Given the sharp fall in heavy truck orders in November, I’ll be digging into this report with a particular eye for what it says about the domestic manufacturing economy.

As discussed above, this week Costco will report its results and joining it in that activity will be several other retailers such as Ascena Retail (ASNA), DWS (DWS), American Eagle (AEO) and Vera Bradley (VRA). Inside their comments and guidance, which will include the holiday shopping season, I’ll be assessing the degree to which they are embracing our Digital Lifestyle investing theme. We’ll also see Adobe Systems (ADBE) report its quarterly result and I’ll be digesting what it has to say about cloud adoption, pricing and prospects for 2019. As we know, that is a core driver of Amazon Web Services, one of the key profit and cash flow drivers at Amazon (AMZN).

  • Our price target on Amazon (AMZN) shares remains $2,250


Weekly Issue: Looking Around the Bend of the Current Rebound Rally

Weekly Issue: Looking Around the Bend of the Current Rebound Rally


Stock futures are surging this morning in a move that has all the major domestic stock market indices pointing up between 1.5% for the S&P 500 to 2.2% for the Nasdaq Composite Index. This surge follows the G20 Summit meeting of President Trump and Chinese President Xi Jinping news that the US and China will hold off on additional tariffs on each other’s goods at the start of 2019 with trade talks to continue. What this means is for a period of time as the two countries look to hammer out a trade deal during the March quarter, the US will leave existing tariffs of 10% on more than $200 million worth of Chinese products in place rather than increase them to 25%.  If after 90 days the two countries are unable to reach an agreement, the tariff rate will be raised to 25% percent.

In my view, what we are seeing this morning is in our view similar to what we saw last week when Fed Chair Powell served up some dovish comments regarding the speed of interest rate hikes over the coming year – a sigh of relief in the stock market as expected drags on the economy may not be the headwinds previously expected. On the trade front, it’s that tariffs won’t escalate at the end of 2018 and at least for now it means one less negative revision to 2019 EPS expectations. In recent weeks, we’ve started to see the market price in the slowing economy and potential tariff hikes as 2019 EPS expectations for the S&P 500 slipped over the last two months from 10%+ EPS growth in 2019 to “just” 8.7% year over year. That’s down considerably from the now expected EPS growth of 21.6% this year vs. 2017, but we have to remember the benefit of tax reform will fade as it anniversaries. I expect this to ignite a question of what the appropriate market multiple should be for the 2019 rate of EPS growth as investors look past trade and the Fed in the coming weeks. More on that as it develops.

For now, I’ll take the positive performance these two events will have on the Thematic Leaders and the Select List; however, it should not be lost on us that issues remain. These include the slowing global economy that is allowing the Fed more breathing room in the pace of interest rate hikes as well as pending Brexit issues and the ongoing Italy-EU drama. New findings from Lending Tree (TREE) point to consumer debt hitting $4 trillion by the end of 2018, $1 trillion higher than less five years ago and at interest rates that are higher than five years ago. Talk about a confirming data point for our Middle-class Squeeze investing theme. And while oil prices have collapsed, offering a respite at the gas pump, we are seeing more signs of wage inflation that along with other input and freight costs will put a crimp in margins in the coming quarters. In other words, headwinds to the economy and corporate earnings persist.

On the US-China trade front, the new timeline equates to three months to negotiate a number of issues that have proved difficult in the past. These include forced technology transfer by U.S. companies doing business in China; intellectual-property protection that the U.S. wants China to strengthen; nontariff barriers that impede U.S. access to Chinese markets; and cyberespionage.

So, while the market gaps up today in its second sigh of relief in as many weeks, I’ll continue to be prudent with the portfolio and deploying capital in the near-term.  At the end of the day, what we need to see on the trade front is results – that better deal President Trump keeps talking about – rather than promises and platitudes. Until then, the existing tariffs will remain, and we run the risk of their eventual escalation if promises and platitudes do not progress into results.


The Stock Market Last Week

Last week we closed the books on November, and as we did that the stock market received a life preserver from Federal Reserve Chair Powell, which rescued them from turning in a largely across-the-board negative performance for the month. Powell’s comments eased the market’s concern over the pace of rate hikes in 2019 and the subsequent Fed November FOMC meeting minutes served to reaffirm that. As we shared Thursday, we see recent economic data, which has painted a picture of a slowing domestic as well as global economy, giving the Fed ample room to slow its pace of rate hikes. 

While expectations still call for a rate increase later this month, for 2019 the consensus is now looking for one to two hikes compared to the prior expectation of up to four. As we watch the velocity of the economy, we’ll also continue to watch the inflation front carefully given recent declines in the PCE Price Index on a year-over-year basis vs. wage growth and other areas that are ripe for inflation.

Despite Powell’s late-month “rescue,” quarter to date, the stock market is still well in the red no matter which major market index one chooses to look at. And as much as we like the action of the past week, the decline this quarter has erased much of the 2018 year-to-date gains. 


Holiday Shopping 2018 embraces the Digital Lifestyle

Also last week, we had the conclusion of the official kickoff to the 2018 holiday shopping season that spanned Thanksgiving to Cyber Monday, and in some cases “extended Tuesday.” The short version is consumers did open their wallets over those several days, but as expected, there was a pronounced shift to online and mobile shopping this year, while bricks-and-mortar traffic continued to suffer. 

According to ShopperTrak, shopper visits were down 1% for the two-day period compared to last year, with a 1.7% decline in traffic on Black Friday and versus 2017. Another firm, RetailNext, found traffic to U.S. stores fell between 5% and 9% during Thanksgiving and Black Friday compared with the same days last year. For the Thanksgiving to Sunday 2018 period, RetailNext’s traffic tally fell 6.6% year over year. 

Where were shoppers? Sitting at home or elsewhere as they shopped on their computers, tablets and increasingly their mobile devices. According to the National Retail Federation, 41.4 million people shopped only online from Thanksgiving Day to Cyber Monday. That’s 6.4 million more than the 34.7 million who shopped exclusively in stores. Thanksgiving 2018 was also the first day in 2018 to see $1 billion in sales from smartphones, according to Adobe, with shoppers spending 8% more online on Thursday compared with a year ago. Per Adobe, Black Friday online sales hit $6.22 billion, an increase of 23.7% from 2017, of which roughly 33% were made on smartphones, up from 29% in 2017.

The most popular day to shop online was Cyber Monday, cited by 67.4 million shoppers, followed by Black Friday with 65.2 million shoppers. On Cyber Monday alone, mobile transactions surged more than 55%, helping make the day the single largest online shopping day of all time in the United States at $7.9 billion, up 19% year over year. It also smashed the smartphone shopping record set on Thanksgiving as sales coming from smartphones hit $2 billion.

As Lenore Hawkins, Tematica’s Chief Macro Strategist, and I discussed on last week’s Cocktail Investing podcast, the holiday shopping happenings were very confirming for our Digital Lifestyle investing theme. It was also served to deliver positive data points for several positions on the Select List and the Thematic Leader that is Amazon (AMZN). These include United Parcel Service (UPS), which I have long viewed as a “second derivative” play on the shift to digital shopping, but also Costco Wholesale (COST) and Alphabet/Google (GOOGL). Let’s remember that while we love McCormick & Co. (MKC) for “season’s eatings” the same can be said for Costco given its food offering, both fresh and packaged, as well as its beer and wine selection. For Google, as more consumers shop online it means utilizing its search features that also drive its core advertising business.

As we inch toward the Christmas holiday, I expect more data points to emerge as well as more deals from brick & mortar retailers in a bid to capture what consumer spending they can. The risk I see for those is profitless sales given rising labor and freight costs but also the investments in digital commerce they have made to fend off Amazon. Sales are great, but it has to translate into profits, which are the mother’s milk of EPS, and that as we know is one of the core drivers to stock prices.


Marriott hack reminds of cyber spending needs

Also last week, we learned of one of the larger cyber attacks in recent history as Marriott (MAR) shared that up to 500 million guests saw their personal information ranging from passport numbers, travel details and payment card data hacked at its Starwood business. As I wrote in the Thematic Signal in which I discussed this attack, it is the latest reminder in the need for companies to continually beef up their cybersecurity, and this is a profound tailwind for our Safety & Security investing theme as well as the  ETFMG Prime Cyber Security ETF (HACK) shares that are on the Select List.


The Week Ahead

Today, we enter the final month of 2018, and given the performance of the stock market so far in the December quarter it could very well be a photo finish to determine how the market finishes for the year. Helping determine that will not only be the outcome of the weekend’s G-20 summit, but the start of November economic data that begins with today’s ISM Manufacturing Index and the IHS Markit PMI data, and ends the week with the monthly Employment Report. Inside those two reports, we here at Tematica be assessing the speed of the economy in terms of order growth and job creation, as well as inflation in the form of wage growth. These data points and the others to be had in the coming weeks will help firm up current quarter consensus GDP expectations of 2.6%, per The Wall Street Journal’s Economic Forecasting Survey that is based on more than 60 economists, vs. 3.5% in the September quarter.

Ahead of Wednesday’s testimony by Federal Reserve Chair Powell on “The Economic Outlook” before Congress’s Joint Economic Committee, we’ll have several Fed heads making the rounds and giving speeches. Odds are they will reinforce the comments made by Powell and the November Fed FOMC meeting minutes that we talked about above. During Powell’s testimony, we can expect investors to parse his words in order to have a clear sense as to what the Fed’s view is on the speed of the economy, inflation and the need to adjust monetary policy, in terms of both the speed of future rate hikes and unwinding its balance sheet. Based on what we learn, Powell’s comments could either lead the market higher or douse this week’s sharp move higher in the stock market with cold water.

On the earnings front this week, we have no Thematic Leaders or Select List companies reporting but I’ll be monitoring results from Toll Brothers (TOL), American Eagle (AEO), Lululemon Athletica (LULU), Broadcom (AVGO) and Kroger (KR), among others. Toll Brothers should help us understand the demand for higher-end homes, something to watch relating to our Living the Life investing theme, while American Eagle and lululemon’s comments will no doubt offer some insight to the holiday shopping season. With Broadcom, we’ll be looking at its demand outlook to get a better handle on smartphone demand as well as the timing of 5G infrastructure deployments that are part of our Disruptive Innovators investing theme. Finally, with Kroger, it’s all about our Clean Living investing theme and to what degree Kroger is capturing that tailwind.


Debt Levels + Falling Liquidity = EPS Pressure Ahead

Debt Levels + Falling Liquidity = EPS Pressure Ahead


Investing markets across the board have taken a serious beating in 2018. According to Deutsche Bank, of the 70 asset classes they track, 63, or 90% of them, are in the red for the year. In 2017 only 1 of the 70 closed in the red. We’ve undergone a massive shift in the investing landscape which bears further investigation.

Taking a step back to look at the market and the economy, over the nine years since the depths of the financial crisis bear market in March 2009 the S&P 500 rose 330% through its September peak. During that time GDP averaged an annual growth rate of 2.1%, which is just two-thirds of the average annual GDP growth rate from 1990 through 2007. In comparison, in the nine years between 1990 and 2000, the S&P 500 rose 350% within an economy that grew an average of 3.7% a year. During these two periods the S&P 500 gained roughly the same amount, but in the current period GDP rose at just over half the pace of the 1990 to 2000 period.

Why did we see such a profound increase in the S&P 500 when the economy was growing so much more slowly?

You can thank all that central bank provided liquidity in the form of various quantitative easing programs primarily provided by the Federal Reserve, the European Central Bank, Bank of Japan and let’s not forget the phenomenal growth in debt in China. As I described on this week’s Cocktail Investing Podcast, you can think of liquidity as water being poured into the global economic pool. As more water flows in, the level of the water, which is akin to the price of assets, rises. However, not all assets rise at the same rate every time. Last time around the increasing levels of liquidity were focused in housing and we saw real estate prices in much of the world rise at record rates. This time around the rising liquidity has been focused in the investing markets.


Draining the liquidity stimulus for the stock market

Today the water in that pool is being drained as global liquidity is shrinking at the fastest pace since 2008. The Federal Reserve is reducing liquidity in two ways, one by raising rates and the other by shrinking its balance sheet. When the Federal Reserve raises the Fed Funds rate, the result is higher short-term interest rates. That makes borrowing both more expensive for the borrower and riskier for the lender as the borrower has a higher hurdle to be able to service the debt. The Fed is currently shrinking its balance sheet at an effective annual rate of about $600 billion by not reinvesting those bonds it holds that mature. This means that when a bond the Fed owns for say $100 matures, the Fed receives the $100 and does not use it to purchase another bond, which means that $100 stays at the Fed and is effectively removed from the money supply.

On November 28th, Federal Reserve Chairman calmed the markets with his speech at The Economic Club of New York stating that rates, “remain just below the broad range of estimates of the level that would be neutral for the economy.” The market cheered this shift in tone from his stance in early October when he stated that rates were, “a long way from neutral.” One has to wonder how much the criticism coming out of the White House may have impacted such a change in the outlook for the economy in just 56 days. With most economic data available only on a monthly basis, it seems odd that one month’s worth of data would warrant the material shift that the market now expects. For months the data coming in has been suggesting a slowing economy both in the US and abroad, but we’ve seen nothing dramatic over the past 56 days.

The markets are now pricing in one more rate hike in 2018 and only one more in 2019, down from the prior view of up to four next year, which put downward pressure on the US Dollar that lasted all of one day, with the DXY US dollar index back in the green by the following morning. I’d like to point out that the target interest rate range is estimated to be between 2.5% and 3.5%. The Fed’s rate range today is between 2% and 2.25%, so we could be looking at future hikes that would total anywhere from 25 to 125 basis points. Powell also specifically mentioned that “equity market prices are broadly consistent with historical benchmarks such as forward price-to earnings ratios,” which indicates he isn’t worried about the recent stock market weakness.


Follow the Fed’s balance sheet deleveraging

While rising rates are good news for margins at banks, US banks look to be shoring themselves up for a slowdown. The inimitable David Rosenberg of Gluskin Sheff recently pointed out that, “They have shed assets in four of the past five weeks. On a four-week basis, bank assets have declined at nearly a 4% annual rate…. The part of the balance sheet that is expanding, and by the fastest pace, is bank holdings of Treasury securities which have bulged at a 13% annual rate over the past 13 weeks (and by 16% over the past four weeks.)”

In Asia (ex-Japan) the central banks’ supply of currency and bank reserves have decreased by 7% in real terms since the US Dollar started its recent move up in April. This is the steepest contraction in the monetary base since January and October of 2008 when it contracted by 11%.

Overall the inflation-adjusted global monetary base has contracted just five times since 1980 – 1982, 1990, 1998, 2011 and 2006. Every time the contraction either preceded or coincide with global economic slowdown. The question then is, what will be most affected?


What goes around is bound to come around

The last time around we saw liquidity raise home prices to record heights so when the liquidity flows reversed, home prices fell. Those areas in which prices had risen the fastest fell the hardest. This time around we’ve seen an increase in stock prices and a significant increase in corporate debt, which has increased by 86% from the 2007 peak by the end of the second quarter of 2018. As we see rates rising, here are some points that are cause for concern:

  • Global debt has reached a record $247 trillion, 318% debt to GDP – a ratio far above the roughly 200% in 2008.
  • The level of corporate debt has hit an all-time record high of $6.3 trillion, which looks manageable as in aggregate US companies have $2.1 trillion in cash to service that debt, but that cash is concentrated in the hands of a few behemoths.
  • The ability to service that debt is weak for many. The cash-to-debt ratio for speculative-grade borrowers fell to a record low of 12% in 2017, well below the 14% seen in 2008. This means that for every dollar they generate in cash flow, they have $8 of debt.
  • It isn’t just the speculative grade that is struggling. Over 450 investment-grade companies that are not in the top 1% of cash-rich issuers also have cash-to-debt ratios that are quite low, around 21%. Rising rates mean even weaker coverage ratios.
  • The quality of debt is low by historical norms. Moody’s Covenant Quality Indicator has been sitting at the lowest level of classification for the past 18 months, just slightly off its August 2015 record low.
  • 25% of all corporate debt is maturing over the next 3 years.
  • $2.2 trillion of corporate debt (more than one-third) is floating rate, which means as interest rates rise, interest payments on existing debt rises, which means margin compression.
  • An early warning sign — Deutsche Bank 6% coco bond has risen to 10.3%, the highest rate since 2016. Investors expect that Germany’s biggest bank will take serious hits in the next recession.

And what about that debt… about that debt… about that debt?

As we look to the holiday shopping season, it isn’t just corporate credit that has our attention. Our Middle-Class Squeeze investing theme is front and center when we see that in the third quarter the delinquency rate on credit card loan balances spiked to 6.2% at smaller banks (the group that excludes the 100 largest). That is well above the peak of 5.9% we saw during the financial crisis. The pace of the decline is also concerning, more than doubling in the past two years from less than 3% to 6.2%. The credit card charge-off rate at these same banks was 7.4% in the third quarter and has now been above 7% for five consecutive quarters. In comparison, during the financial crisis the charge-off rate was above 7% for only four consecutive quarters. You read that right, the charge-off rate has been worse in the past five quarters than in the debts of the financial crisis.

But hold on a minute, overall credit card and other revolving consumer credit was just $1 trillion in the third quarter, which is right about where it was at its prior peak a decade ago despite a population that has grown by about 20 million people. Doesn’t that mean that consumer debt isn’t a concern? If we look at the credit card delinquency rates for the top 100 banks, things do in fact look pretty good for the consumer, sitting at just 2.5%, which is well below the over 6.5% rate in the depths of the financial crisis.

The message here is that while the banks overall are not in danger here from credit card debt, what we are seeing is that those consumers who are the most vulnerable — those with weaker credit history — are already getting into trouble with their credit cards at a time when we are being told the economy is stronger than ever. What happens to them and to the smaller banks that serve them when times inevitably get tougher?

Overall retail sales in October, when adjusted for inflation, rose just 2%, at the lowest end of the post-financial crisis range but e-commerce continues to be extremely strong, reflecting our Digital Lifestyle investment theme. Total retail sales not adjusted for inflation rose 4.6%, but eCommerce accounted for the bulk of that, rising 14.5% from a year ago.


Falling liquidity plus upcoming debt refinancing will be a headwind to earnings.

The bottom line is we are in the midst of major shifts in market dynamics. The outsized performance of the stock market relative to the weak rate of economic growth was fueled by liquidity injections courtesy of many of the world’s central banks. Now that liquidity is draining out of the global economy at a meaningful rate at a time when the US is engaging in a level of deficit spending unheard of outside of a recession or war, so we are seeing a major increase in Treasury bond issuance. That means less liquidity as we see a significant increase in the supply of new Treasury bonds. The overall US corporate balance sheet is quite weak, particularly when we remove the handful of large cash holders. With over one-third of the outstanding corporate bonds floating rate and one-quarter of all corporate bonds rolling over the in next three years, rising interest rate expenses will be adding to the rising margin pressures from the tightest labor market in decades. In other words, a headwind to EPS generation that investors and the multiples they assign to the stock market will have to contend with.

In the coming months we will be watching for any changes in fiscal policy coming out of DC to gauge the level of Treasury bond issuance. We will be watching the dynamics in corporate credit as many will need to favor shoring up their balance sheets over dividends or buybacks. For investors, this is a time to ensure that not only are the companies in which you have invested benefiting from the types of long-term tailwinds we focus on with our investing themes, but to also review the financial health of the companies in your portfolio. There will be a price to pay for the past corporate debt extravaganza.


While The Market Regained Some of Its Footing, It’s Shaky At Best

While The Market Regained Some of Its Footing, It’s Shaky At Best


Key Points from This Report:

  • Did the election matter?
  • Italy is a growing problem for the Eurozone and U.S. Investors should care
  • The rising dollar and interest rates
  • Another strong jobs report – be careful what you wish for
  • More signs that the global economy is slowing
  • The trade war with China continues with no end in sight.
  • The Market has found at least some shaky footing


Did the Election Matter?

The big news of the week was the non-news of the election, which gave both sides sufficient wins to claim victory. The market engaged in what was likely a brief “thank-God-there-were-no-surprises-this-time” rally the following day. For investors, the election means that any further tax cuts are highly unlikely and while the need for infrastructure spending is something both parties agree on, the budget process for that spending has the potential to be reminiscent of a Jerry Springer episode – let the games begin.

We’ll probably hear more threats concerning impeachment, but the election results make it unlikely that will be anything more than the usual vitriol coming out of the beltway these days. Overall the election ended up being a non-event, followed by a relief rally… but several issues remain that could complicate matters for the market and investors.


Italy is a growing problem for the Eurozone and U.S. Investors should care

Italy continues to vex both the eurozone and those pundits who insist that cooler heads will prevail. I live a good portion of my time in Italy and I can assure you, there are no cooler heads in Italy’s leadership and its citizenry are becoming more and more enraged by their governments’ endless inability to address the myriad of issues facing the nation, regardless of which party or coalition is in charge. Keep in mind that Italy faces even more challenging demographics than the U.S., (which in comparison is akin to our Aging of the Population investing theme on steroids) as its population is skewed even older thanks to insanely high youth unemployment, which drives many of the young to look outside their birth country for better opportunities.

The U.S. isn’t alone in its desperate need for infrastructure investment. Remember that bridge in Genoa, Italy that collapsed in August killing 43 people? Despite the promises in the days following the tragedy that the nation’s leadership would mobilize all available resources immediately and get a new bridge for this vital part of the region’s infrastructure up as soon as humanly possible, nothing has been done.

Not.

One.

Damn.

Thing.

And that is just a bridge. Last week the nation was hit with massive storms that caused an incredible amount of damage, inflicting even more pain on a country that is already a mess. I expect Italy will not be the one to blink first when it comes to the revised budget due to Brussels later this month. There will be a showdown with the rest of the Eurozone and it is going to get even messier.

For some perspective, just 10 years ago Luigi Di Maio, the leader of the Five Star Movement and Deputy Prime Minister, was living with his parents and working as a drinks server at the Napoli stadium. In just 10 years he’s gone from one of those guys walking around, hocking drinks from his tray, to leading Italy. Is it any wonder that the rest of Europe’s leadership isn’t exactly thrilled with Italy’s leadership choices?

Adding to the drama, France’s leader, Emmanuel Macron, looks to be struggling under all the pressure and Germany’s Angela Merkel is now a lame-duck having announced she is stepping down as the leader of her party and will not be seeking reelection. Europe is without strong leadership at a time when it desperately needs it. This is going to get worse before it gets better.

Why should investors care what happens in Italy?

The eurozone economy is nearly the size of the United States’ and Italy is both too big to save and too big to fail without putting the entire region into an economic tizzy. Italy has the potential to seriously rock the markets at a time when interest rates are rising most everywhere, and dollar liquidity is shrinking.


The rising dollar and interest rates

With global liquidity shrinking at the fastest pace since 2008, the dollar continues to strengthen, causing a variety of problems for a broad swath of market participants. The strong dollar has been causing pain in the commodity complex and those economies tied to it, for example, this week U.S. West Texas Intermediate (WTI) crude fell more than 21% from last month’s four year high. The recent strong jobs reports mean the Fed is likely to continue on its rate hike path and Thursday’s post-meeting announcement referred to a strengthening labor market and economic activity rising at a strong rate – pretty much like the Bat-signal for more hikes coming. The lack of foreign buyers of Treasury auctions is adding to rate pressures. So far in calendar year 2018, we have seen half the level of foreign buying we saw in 2017.


Another strong jobs report – be careful what you wish for

Last month businesses added an additional 250k to the U.S. workforce, well above the expected roughly 200k, but the real number would have been even more incredible had it not been for the 198k that were not at work due to weather conditions – a level three times the historical norm thanks to Hurricane Michael. Without Mike, the number would have been closer to +400k, so while Wall Street is getting serious jitters as the bears have been pacing around the major indices, Main Street is busy hiring. Break out the champagne and party hats?

Err, not so fast. As much as I love a glass of the chilled bubbly, digging into the details gets me a bit nervous to see that while construction activity has been contracting for several quarters, the sector has added 100k to its ranks since July. Contracting activity levels while growing payrolls? Not exactly good for the bottom line. The Federal Reserve’s Beige book has been a compendium of executive angst over the impact of trade wars on their businesses, but transportation services grew their ranks by 25k, the most in 13 months. This is likely because 100% of the net new jobs over the past four months have gone to those with a high school education or less. Great for the development of skills in that cohort, not so great for their employers who are experiencing lower productivity levels, which translates into earnings pressure for investors.

Cocktail Investing Podcast Episode 85We also saw wages rise +3.1% year-over in October from +2.8% in September, the fastest rate since 2009. We suspect consumers in our Middle-class Squeeze investing theme are cheering as are retailers that are gearing up for the 2018 holiday shopping season – for more on that, check out this week’s Cocktail Investing Podcast where we talk with the National Retail Federation and its consumer survey findings for holiday shopping this year.

Back to the October wage gains, we strongly suspect the Fed is watching as increased pay pressures have pulled 711k into the workforce, which pushed the labor force participation rate up by +0.02% in October. Without the new entrants into the workforce, the unemployment rate would have dropped to 3.3%, which would be the lowest level in 65 years!

So, jobs look fantastic right? Errrmmmmm, yes but… the manufacturing workweek was cut a second time by 0.2% since June to the lowest number of hours since January – could be the trade war is cutting folks’ hours. Overall, the labor market is exceptionally tight so no wonder the Fed this week announced that “The labor market has continued to strengthen and … economic activity has been rising at a strong rate,” keeping in place its plan to continue to gradually raise rates.


More signs that the global economy is slowing

While the US is still humming along, most are not paying attention to the slowing happenings outside our borders. The IHS Markit Composite PMI in the euro area dropped to a 2-year low of 53.1 in October from 54.1 in September while Italy dropped to its lowest level since November and is now in contraction territory- anything below 50 is in contraction. Germany’s real manufacturing orders year-over-year declined -2.2%. Eurozone GDP slowed to a 5-year low in Q3 of a less than +1% annual rate. The US will not be unaffected by the slowing outside its borders.


The trade war with China continues with no end in sight.

We’ve already talked a lot about this in previous weeks, so we will just leave this one with a note that China is looking to regain its place as the world’s dominant nation and its leader has his job for life. The strange events surrounding many high-profile people ranging from the leader of Interpol to actress Fan Bingbing to Alibaba’s Jack Ma give the impression that some seriously strange things are going on in the nation and perhaps the CCP leadership is looking to close ranks and tighten its grip – there is going to be a lot more to this story in the months and years to come.


The Market has found at least some shaky footing

Finally, after a brutal October, the market has managed to regain some of the ground it lost in the early days of November but let me point out that it is unusual for the S&P 500 to lose 10% or more twice in any given year. Going back roughly half a century, such double dipping typically precedes or occurred in conjunction with a recession, (with the exception of 1987 which wasn’t much fun).

As earnings season is nearing a close, corporate share buyback programs have been able to restart their purchases, helping put a (temporary?) floor under the market. I remain warry that we haven’t seen the end of this period of volatility.


Weekly Issue: We aren’t out of the woods just yet

Weekly Issue: We aren’t out of the woods just yet

Key Points from this Issue:

  • We are downgrading Universal Display (OLED) shares from the Thematic Leaders to the Select List and cutting our price target to $125 from $150. In the coming days, we will name a new Thematic Leader for our Disruptive Innovators investing theme.
  • Given the widespread pain the market endured in October, Thematic Leaders Chipotle Mexican Grill (CMG), Del Frisco’s (DFRG), Axon Enterprises (AXXN), Alibaba (BABA) and Netflix (NFLX) were hit hard; however, the hardest hit was Amazon (AMZN).


This week we closed the books on the month of October, and what a month it was for the stock market. In today’s short-term focused society, some will focus on the rebound over the last few days in the major domestic stock market indices, but even those cannot hide the fact that October was one of the most challenging months for stocks in recent memory. In short, the month of October wiped out most the market’s year to date gains as investors digested both September quarter earnings and updated guidance that spurred a re-think in top and bottom line expectations.

All told, the Dow Jones Industrial Average fell 5.1% for the month, making it the best performer of the major market indices. By comparison, the S&P 500 fell 6.9% in October led by declines in eight of its ten subgroups. The technology-heavy Nasdaq Composite Index dropped 9.2% and the small-cap focused Russell 2000 plummeted 10.9%. That marked the Nasdaq’s steepest monthly drop since it posted a 10.8% fall in November 2008. The month’s move pulled the Russell 2000 into negative territory year to date while for the same time period both the Dow and S&P 500 closed last night up around 1.5%.

We are just over halfway through the September quarter earnings season, which means there are ample companies left to report and issue updated guidance. Candidly, those reports could push or pull the market either higher or continue the October pain. There are still ample risks in the market to be had as the current earnings season winds down. These include the mid-term elections; Italy’s next round of budget talks with Brussels; upcoming Trump-China trade talks, which have led to another round of tariff preparations; and Fed rate hikes vs. the slowing speed of the global economy.

Despite the very recent rebound in the stock market, CNN’s Fear & Greed Index remains at Extreme Fear (7) as I write this – little changed from last week. What this likely means is we are seeing a nervous rebound in the market, and it will likely some positive reinforcement to make the late October rebound stick. As we navigate that pathway to the end of the year, we will also be entering the 2018 holiday shopping season, which per the National Retail Federation’s annual consumer spending survey should rise more than 4% year over year.

This combination of upcoming events and sentiment likely means we aren’t out of the woods just yet even though we are seeing a reprieve from the majority of October. As is shared below, next week has even more companies reporting than this week as well as the midterm elections. The strategy of sitting on the sidelines until the calmer waters emerge as stock prices come to us is what we’ll be doing. At the right time, we’ll be adding to existing positions on the Thematic Leaders and Thematic Select List as well as introducing new ones.

Speaking of the Thematic Leaders and the Select List, as the mood shifts from Halloween to the year-end shopping season,  we have several companies including Amazon (AMZN), United Parcel Service (UPS), Costco Wholesale (COST), Del Frisco’s Restaurant Group (DFRG), McCormick & Co. (MKC) and Apple (AAPL) among others that should benefit from that uptick in holiday spending as well as our Digital Lifestyle, Living the Life and Middle-class Squeeze investing themes in the next few months.


UPDATES TO The Thematic Leaders and Select List

Given the widespread pain the market endured in October, we were not immune to it with the Thematic Leaders or companies on the Tematica Select List. Given the volatility, investor’s nerves it was a time of shoot first, ask questions later with the market – as expected – trading day to day based on the most recent news. I expect this to continue at least for the next few weeks.

The hardest hit was Amazon, which despite simply destroying September quarter expectations served up what can only be called a conservative forecast for the current quarter. For those that didn’t tune in to the company’s related earnings conference call, Amazon management flat out admitted that it was being conservative because it is too hard to call the second half of the quarter, which is when it does the bulk of its business during the frenetic holiday shopping season. I have long said that Amazon shares are one to hold not trade, and with the move to expand its private label product, move into the online pharmacy space as well as continued growth at Amazon Web Services, we will do just that. That conservative guidance also hit United Parcel Service (UPS) shares, but we see that as a rising tide this holiday season as digital shopping continues to take consumer wallet share this holiday shopping season.

Both Chipotle Mexican Grill (CMG), Del Frisco’s (DFRG), Axon Enterprises (AXXN), Alibaba (BABA) and Netflix (NFLX) have also been hit hard, and I’m waiting for the market to stabilize before scaling into these Thematic Leader positions. As we’ve moved through the current earnings season, comments from Bloomin’ Brands (BLMN), Del Taco (TACO), Wingstop (WING), Habit Restaurant (HABT) and others, including Chipotle, have all pointed to the benefit of food deflation. Chipotle’s Big Fix continues with progress had in the September quarter and more to be had in the coming ones. Del Frisco’s will soon report its quarterly results and it too should benefit from a consumer with high sentiment and lower food costs.

With Axon, the shares remain trapped in the legal volley with Digital Ally (DGLY), but as I pointed out when we added it to the Leaders, Axon continues to expand its safety business with law enforcement and at some point, I suspect it will simply acquire Digital Ally given its $30 million market cap. Turning to Alibaba (BABA) and Netflix (NFLX), both have been hit hard by the downdraft in technology stocks, with Alibaba also serving as a proxy for the current US-China trade war. In my opinion, there is no slowing down the shift to digital streaming that is driving Netflix’s business and its proprietary content strategy is paying off, especially outside the US where it is garnering subscriber growth at price points that are above last year’s levels. This is one we will add to as things settle down.

The same is true with Alibaba – there is no slowing down the shift to the Digital Lifestyle inside of China, and as Alibaba’s other business turn from operating losses to operating profits, I expect a repeat of what we saw with Amazon shares. For now, however, the shares are likely to trade sideways until we see signs of positive developments on trade talks. Again, let’s hang tight and make our move when the time is right.


Downgrading Universal Display shares to the Select List

Last night Thematic Leader Universal Display (OLED) reported rather disappointing September quarter results that fell well short of expectations and guided the current quarter below expectations given that the expected rebound in organic light emitting diode materials sales wasn’t ramping as expected despite a number of new smartphones using organic light emitting diode displays. On the earnings call, the company pointed out the strides being had with the technology in other markets, such as TV and automotive that we’ve been discussing these last few months but at least for the near-term the volume application has been smartphones. In short, with that ramp failing to live up to expectations for the seasonally strongest part of the year for smartphones, it speaks volumes about what is in store for OLED shares.

By the numbers, Universal now expected 2018 revenue in the range of $240-$250, which implies $63-$73 million for the December quarter vs. $77.5 million for the September quarter and $88.3 million in the year-ago one. To frame it another way, that new revenue forecast of $240-$250 million compares to the company’s prior one of $315- $325 million and translates into a meaningful fall off vs. 2017 revenues of $335.6 million. A clear sign that the expected upkeep is not happening as fast as was expected by the Universal management team. Also, too, the first half of the calendar year tends to be a quiet one for new smartphone models hitting shelves. And yes, there will be tech and consumer product industry events like CES, CEBIT, and others in 2019 that will showcase new smartphone models, but candidly we see these new models with organic light emitting diode displays as becoming a show-me story given their premium price points. Even with Apple (AAPL) and its September quarter earnings last night, its iPhone volumes were flat year over year at 46.9 million units falling short of the 48.0 million consensus forecast.

In my view, all of this means the best case scenario in the near-term is OLED shares will be dead money. Odds are once Wall Street computes the new revenue numbers and margin impact, EPS numbers for the next few quarters will be taken down and will hang on the shares like an anchor. Given our cost basis in the shares near $101, and where the shares are likely to open up tomorrow – after market trading indicates $95-$100, down from last night’s closing price of $129.65 – we have modest downside ahead. Not bad, but again, near-term the shares are likely range bound.

Given our long-term investing style and the prospects in markets outside of the smartphone, we’re inclined to remain long-term investors. That said, given the near-term headwinds, we are demoting Universal Display shares from the Thematic Leaders to the Select List. Based on revised expectations, we are cutting our price target from $150 to $125, fully recognizing the shares are likely to rangebound for the next 1-2 quarters.

  • We are downgrading Universal Display (OLED) shares from the Thematic Leaders to the Select List and cutting our price target to $125 from $150. In the coming days, we will name a new Thematic Leader for our Disruptive Innovators investing theme.


Clean Living signals abound

As we hang tight, I will continue to pour through the latest thematic signals that we see day in, day out throughout the year, but I’ll also be collecting ones from the sea of earnings reports around us.

If I had just read that it would prompt me to wonder what some of the recent signals have been. As you know we post them on the Tematica Research website but during the earnings season, they can get a tad overwhelming, which is why on this week’s Cocktail Investing podcast, Lenore Hawkins (Tematica’s Chief Macro Strategist) and I ran through a number of them. I encourage you to give it a listen.

Some of the signals that stood out of late center on our Clean Living investing theme. Not only did Coca-Cola (KO) chalk up its September quarter performance to its water and non-sugary beverage businesses, but this week PepsiCo (PEP) acquired plant-based nutrition bar maker Health Warrior as it continues to move into good for you products. Mondelez International (MDLZ), the company behind my personal fav Oreos as well as other cookies and snacks is launching SnackFutures, a forward-thinking innovation hub that will focus on well-being snacks and ingredients. Yep, it too is embracing our Clean Living investing theme.

Stepping outside of the food aspect of Clean Living, there has been much talk in recent months about the banning of plastic straws. Now MasterCard (MA) is looking to go one further with as it looks to develop an alternative for those plastic debit and credit cards. Some 6 billion are pushed into consumer’s hands each year. The issue is that thin, durable card is also packed with a fair amount of technology that enables transactions to occur and do so securely. A looming intersection of our Clean Living, Digital Infrastructure and Safety & Security themes to watch.


Turning to next week

During the week, the Atlanta Fed published its initial GDP forecast of 2.6% for the current quarter, which is essentially in line with the same forecast provided by the NY Fed’s Nowcast, and a sharp step down from the initial GDP print of 3.5% for the September quarter. Following the October Employment Report due later this week, where wage growth is likely to be more on investor minds that job gains as they contemplate the velocity of the Fed’s interest rate hikes, next week brings several additional pieces of October data. These include the October ISM Services reading and the October PPI figure. Inside the former, we’ll be assessing jobs data as well as pricing data, comparing it vs. the prior months for hints pointing to a pickup in inflation. That will set the stage for the October PPI and given the growing number of companies that have announced price increases odds are we will some hotter pricing data and that could refocus the investor spotlight back on the Fed.

Next week also brings the September JOLTS report as well as the September Consumer Credit report. Inside those data points, we expect more data on the continued mismatch between employer needs and available worker skills that is expected to spur more competitive wages.  As we examine the latest credit data, we will keep in mind that smaller banks reporting higher credit card delinquency rates while Discover Financial (DFS) and Capital One (COF) have shared they have started dialing back credit spending limits. That could put an extra layer of hurt on Middle-class Squeeze consumers this holiday season.

Also, next week, the Fed has its next FOMC meeting, and while it’s not expected to boost rates at that meeting, we can expect much investor attention to be focused on subsequent Fed head comments as well as the eventual publication of the meeting’s minutes in the coming weeks ahead of the December meeting.

On the earnings front, following this week’s more than 1,000 earnings reports next week bring another 1,100 plus reports. What this means is more than half of the S&P 500 group of companies will have issued September quarter results and shared their revised guidance. As these reports are had, we can expect consensus expectations for those companies to be refined for the balance of the year. Thus far, roughly 63% of the companies that have issued EPS guidance for the current quarter have issued negative guidance, but we have yet to see any meaningful negative revisions overall EPS expectations for the S&P 500.

Outside the economic data and corporate earnings flow next week, we also have US midterm elections. While we wait for the outcome, we would note if the Republicans maintain control of the House and Senate, it likely means a path of less resistance for President Trump’s agenda for the coming two years. Should the Democrats gain ground, which has historically been the case following a Republican presidential win, it could very well mean an even more contentious 24 months are to be had in Washington with more gridlock than not. Should that be the case, expectations for much of anything getting done in Washington in the medium-term are likely to fall.

Yes, next week will be another busy one that could challenge the recent market rebound. We’ll continue to ferret out signals for our thematic lens as we remain investors focused on the long-term opportunities to be had with thematic investing.


October Buy-the-Dip Trick or Treat?

October Buy-the-Dip Trick or Treat?


So much for the typical October strength in equities – a month in which the major US indices historically have gained ground 75% of the time. We’ve seen major index support levels broken while earnings beats have been smaller than we’ve seen over the past year with revenue and forward guidance giving investors jitters.

Over the summer and through September we warned that this earnings season would likely be a very bumpy ride as earnings would probably be decent, but guidance would not support the market’s multiples. Our concerns have proven warranted. Overall this earnings season the average company that has reported saw its shares fall 2% on its earnings reaction day – if this keeps up it will be the worst stock performance reaction on record since 2001.

How bad has it been?

  • On Wednesday, October 24, the Nasdaq had its worst daily drop since 2011, closing the day down over 10% from its recent highs and by the close of the trading day, the Dow Jones Industrial Average and the S&P 500 had lost all their gains for the year. If the market’s close in the red again Friday, the S&P 500 will have closed down 15 days during the month thus far, the most since 2012.
  • The FAANGM stocks entered a bear market this week, losing 4.4% on Wednesday – the worst decline since August 2011.
  • The Global MSCI All World Index hit a 14-month low, in bear market territory with a more than 20% decline since the January highs, losing 11% in October alone – the biggest decline since the financial crisis. This week only 4 of the 47 countries in the MSCI all country world index were above their 200-day moving average.
  • Homebuilder stocks have fallen more than 40% from their January highs – the canary in the consumer coal mine. New home sales plunged 5.5% in September versus expectations for a -0.6% decline as the supply of homes for sale rose +2.8% (the sixth consecutive increase) to the highest level since 2008 while demand has fallen to a 2-year low. Tell me again how great that consumer is doing and how they might contend with 5% mortgages? As those homes become more expensive to purchase, fewer Middle-Class Squeeze consumers will be filling out a mortgage application.
  • The only two S&P 500 sectors in the green this month are defensive – Consumer Staples (+1%) in the midst of its longest winning streak since November 2009 and Utilities (+3%). Even one of the must-have lifelines for our Digital Lifestyle investing theme mobile service wasn’t a safe haven as AT&T (T) shares fell some 9% this week hitting a new 52-week low in the process.
  • This week the Russell 2000 small cap index fell over 15% from its highs, closing Wednesday just 5 points away from a new 52-week low.
  • After spending 262 consecutive days above its 200-day moving average, oil closed this week below that marker. Streaks of such magnitude have only happened two other times over the past 30 years – April 10, 2000, which ended a 272-day streak and September 2, 2008, which ended a 330-day streak. Those dates are worth noting.
  • The first 18 trading days in October have seen a daily open to close loss 83.3% of the time, besting the previous 75% record in September of 2000. If the market rallies from open to close on the next 4 trading days, October’s closed in the red versus open will be 65.2% of days – the worst for any single month since October 2008 which was at the height of the financial crisis – and that is the very BEST we could hope for.

Investors are taking note with the weekly sentiment survey from AAII reporting that bullish sentiment fell to 27.9% from 34%, the fourth weakest reading for bullish sentiment this year. Bearish sentiment rose from 35% to 41%, the highest reading since the last week of June. Other indicators, such as the CNN Fear & Greed Index which fell to Extreme Fear (6) this week from Greed (64) a month ago, also point to increasing investor unease.


What is driving all this is the market starting to sync up with the reality of geopolitics and economics.

  • The era of central bank continual infusions of liquidity is over. The flow has not only stopped, but in the case of the US, reversed course.
  • We are facing trade wars and tariffs. The recent Federal Reserve Beige book was packed full of executives complaining about the impact of such on their businesses.
  • A decent portion of the domestic economic acceleration has been thanks to unsustainable fiscal deficits. The market is just starting to figure that out as the headlines move from cheerleaders to more rationale skeptics. Our Safety & Security investing theme is making headlines as a solid portion of growth has been driven by increases in defense spending which shifted from an average annual -2.1% rate of decline from June 2009 to March 2017 to a +2.9% average annual rate of increase since April 2017.
  • The Italian problem is not going away. It is too big to save and to say its current leadership is incompetent is putting it mildly, (as someone who lives a good portion of my time in Genoa of the collapsed bridge fame) and the clock is ticking on its sovereign debt bomb. As an example of the breathtaking level of incompetence, after two months basically no progress has been made on replacing that bridge despite its vital importance to not only Italy’s economy but to the greater Eurozone given its link to a major port.
  • China is in a full bear market, its economy is saddled with a staggering level of debt, and the Chinese yuan has dropped to its lowest level versus the dollar in a decade. We are watching these and other data points with an eye toward our Rise of the Global Middle-Class investing theme.
  • Geopolitical tensions are mounting around the world and the current Saudi situation highlights just how much the balance of global power is shifting.


The big question is where do we go from here?

Just 13% of stocks in the S&P 500 are above their 200-day moving average – these are mostly in the aforementioned Consumer Staples and Utilities sectors. This level has only occurred a few times in the past, marking just how oversold near-term the market has become. There is not one Energy or Industrial sector stock above its 50-day moving average. Rebounds are to be expected with such near-term oversold conditions.

Looking at the economics, the Citigroup Global Economic Surprise Index has been in negative territory, (meaning more data coming in below expectations than above) since April – the longest stretch in 4 years. The October Eurozone PMI fell to a 25-month low. Back in the US, the Richmond Federal Reserve local business conditions index for services hit a 7-year low, similar to what we’ve seen on the manufacturing side.

The employment situation is increasingly worrisome. The Richmond Fed’s wage expectations index for 6 months out recently jumped dramatically up to a level not seen since March 2000 as the available pool of labor has dropped to an 11-year low. Looking at who has been getting jobs recently, 70% of job gains over the past 6 months and 100% over the past 4 months have gone to folks with just a high-school degree or less. While we love to see more people getting jobs, from the corporate side of things, that means that companies are having to hire those with the weakest skill set. Great for the person getting a job as they can now develop more skills, but brutal for the employer who is facing weaker productivity as a result – that hurts earnings which are already facing rising costs from tariffs and trade wars as well as rising interest rates.

The bottom line is we are likely to see some interim rebounds, but it doesn’t look like the market is yet in sync with global realities. We have been pointing out for months that US stocks indices have been outperforming the rest of the world to a degree that was simply not sustainable.

The market is starting to appreciate the magnitude of the fiscal stimulus economic sugar high, that trade wars aren’t so easily won, that geopolitical risks are material, that the change in central bank liquidity flows matters and that future earnings growth is likely slower. We haven’t even gotten started when it comes to the fireworks I’m expecting from the Italian situation. We are likely to see the occasional rebound, but my money is that more pain is yet to come. That is great news for those that are focused on solid, long-term investing themes like the ones we have developed at Tematica Research, and have a shopping list of stocks ready for the bargains that will be coming our way.


Weekly Issue: Among the Volatility, We See Several Thematic Confirming Data Points

Weekly Issue: Among the Volatility, We See Several Thematic Confirming Data Points

Key points inside this issue:

  • As expected, news of the day is the driver behind the stock market swings
  • Data points inside the September Retail Sales Report keep us thematically bullish on the shares of Amazon (AMZN), United Parcel Service (UPS) and Costco Wholesale. Our price targets remain $$2,250, $130 and $250, respectively.
  • We use the recent pullback to scale further into our Del Frisco’s Restaurant Group (DFRG) shares at better prices, our price target remains $14.
  • Netflix crushes subscriber growth in the September quarter; Our price target on Netflix (NFLX) shares remains $500.
  • September quarter earnings from Ericsson (ERIC) and Taiwan Semiconductor (TSM) paint a favorable picture from upcoming reports from Nokia (NOK) and AXT Inc. Our price targets on Nokia and AXT shares remain $8.50 and $11, respectively.
  • Walmart embraces our Digital Innovators investment theme
  • Programming note: Much commentary in this week’s issue centers on the September Retail Sales Report. On this week’s Cocktail Investing podcast, we do a deep dive on that report from a thematic perspective. 


As expected, news of the day is the driver behind the stock market swings

If there is one thing we can say about the domestic stock market over the last week, it remains volatile. While there are other words that one might use to describe the down, up, down move over the last week, but volatile is probably the most fitting. Last week I shared the market would likely trade based on the data of the day — economic, earnings or political — and that seems to have been the case. While we’ve received several solid earnings reports, including one from Thematic Leader Netflix (NFLX), several banks and even a few airlines, the headline economic data came up soft for September Retail Sales and Housing.

And then there was yesterday’s FOMC minutes from the Fed’s September monetary policy meeting, which showed that even though the Fed expects to remain on its tightening path, subject to the data to be had, several members of the committee see “a period where the Fed even will need to go beyond normalization of rates and into a more restrictive stance.”

Odds are we can expect further tweets from President Trump on this given his prior comments that the Fed is one of his greatest risks. I also expect this to reignite concerns for the current expansion, particularly since the Fed has historically done a good job hiking interest rates into a recession. From a thematic perspective, continued rate hikes by the Fed is likely to put some added pressure on Middle-Class Squeeze consumers. Before you freak out, let’s check the data. The economy is still growing, adding jobs, benefiting from lower taxes and regulation. It’s not about to fall off a cliff in the near term, but yes, the longer the current expansion goes, the greater the risk of something more than just a slower economy. More reasons to keep watching the monthly data.

Here’s the good news, inside that data and elsewhere we continue to receive confirming signals for our 10 investing themes as well as favorable data points for the Thematic Leaders and other positions on the Tematica Investing Select List.


Several positives in the September Retail Sales report for AMZN, UPS & COST

Cocktail Investing Podcast September Retail Sales Report

With the consumer directly or indirectly accounting for nearly two-thirds of the domestic economy and the average consumer spending 31% of his or her paycheck on retails goods, this monthly report is one worth monitoring closely.

Let’s take a closer look at this week’s September 2018 Retail Sales report. First, let’s talk about the headline miss that was making the rounds yesterday. Yes, the month over month comparison Total Retail & Food Services excluding motor vehicles & parts fell 0.1%, but Retail rose 0.4% on the same basis. The thing is, most tend to focus on those sequential comparisons, but as investors, we examine year over year comparisons when it comes to measuring revenue, profit and EPS growth. On that basis, Total Retail & Food Services rose 5.7% year over year while Retail climbed 4.4% compared to September 2017. That sounds pretty solid if you ask me. Now, let’s dig into the meat of the report and what it means for several of our thematic holdings.

Right off the bat, we can’t ignore the 11.4% year over year increase in gas station sales during September, which capped off a 17.2% increase for the September 2018 quarter. With such an increase owing to the rise in oil and gas prices, we would expect to see weakness in several of the retail sales categories as the cost of filling up the car saps spending at the margin and confirms our Middle-Class Squeeze investing theme. And we saw just that. Department stores once again fell in September vs. year ago levels as did Sporting goods, hobby, musical instrument, & bookstores. Given recent construction as well as housing starts data, the Building material & garden eq. & supplies dealer category posted slower year over year growth, which was hardly surprising.

Other than gas station sales, the other big gainer was Nonstore retailers – Census Bureau speak for e-tailers and digital commerce that are part of Digital Lifestyle investing theme,  which saw an 11.4% increase in September retail sales vs. year ago levels. That strong level clearly confirms our investment thesis that digital shopping continues to take consumer wallet share, which bodes well for our Amazon (AMZN), United Parcel Service (UPS), and to a lesser extent our Costco Wholesale (COST). With consumers feeling the pressure of our Middle-Class Squeeze investing theme, I continue to see them embracing the Digital Lifestyle to ferret out deals and bargains to stretch their after-tax spending dollars, especially as we head into the holiday shopping season.

Sticking with Costco, the company recently reported its U.S. same-store-sales grew 7.7% for September excluding fuel and currency. Further evidence that Costco also continues to gain consumer wallet share compared to retail and food sales establishments as well as the General Merchandise Store category.

  • Data points inside the September Retail Sales Report keep us thematically bullish on the shares of Amazon (AMZN), United Parcel Service (UPS) and Costco Wholesale. Our price targets remain $2,250, $130 and $250, respectively.


Scaling deeper into Del Frisco’s shares

Now let’s dig into the report as it relates to Del Frisco Restaurant Group, our Thematic Leader for the Living the Life investing theme. Per the Census Bureau, retail sales at food services & drinking places rose 7.1% year over year in September, which brought its year-over-year comparison for the September quarter to 8.8%. Clearly, consumers are spending more at restaurants, than eating at home. Paired with beef price deflation that has been confirmed by Darden Restaurants (DRI), this bodes well for profit growth at Del Frisco.

Against those data points, I’m using the blended 12.5% drop in DFRG shares since we added them to our holdings to improve our costs basis.

  • We are using the recent pullback to scale further into our Del Frisco’s Restaurant Group (DFRG) shares at better prices, our price target remains $14.


Netflix crushes subscriber growth in the September quarter

Tuesday night Netflix (NFLX) delivered a crushing blow to skeptics as it served up an EPS and net subscriber adds beat that blew away expectations and guided December quarter net subscriber adds above Wall Street’s forecast. This led NFLX shares to pop rather nicely, which was followed by a number of Wall Street firms reiterating their Buy ratings and price targets.

Were there some investors that were somewhat unhappy with the continued investment spend on content? Yes, and I suppose there always will be, but as we are seeing its that content that is driving subscriber growth and in order to drive net new adds outside the US, Netflix will continue to invest in content. As we saw in the company’s September quarter results, year to date international net subscriber adds is 276% ahead of those in the US. Not surprising, given the service’s launch in international markets over the last several quarters and corresponding content ramp for those markets.

Where the content spending becomes an issue is when its subscriber growth flatlines, which will likely to happen at some point, but for now, the company has more runway to go. I say that because the content spend so far in 2018 is lining its pipeline for 2019 and beyond. With its international paid customer base totaling 73.5 million users, viewed against the global non-US population, it has a way to go before it approaches the 45% penetration rate it has among US households.  This very much keeps Netflix as the Thematic Leader for our Digital Lifestyle investing theme.

One other thing, as part of this earnings report Netflix said it plans to move away from reporting how many subscribers had signed up for free trials during the quarter and focus on paid subscriber growth. I have to say I am in favor of this. It’s the paying subscribers that matter and will be the key to the stock until the day comes when Netflix embraces advertising revenue. I’m not saying it will, but that would be when “free” matters. For now, it’s all about subscriber growth, retention, and any new price increases.

That said, I am closely watching all the new streaming services that are coming to market. Two of the risks I see are a recreation of the cable TV experience and the creep higher in streaming bill totals that wipe out any cord-cutting savings. Longer-term I do see consolidation among this disparate services playing out repeating what we saw in the internet space following the dot.com bubble burst.

  • Our price target on Netflix (NFLX) shares remains $500.


What earnings from Ericsson and Taiwan Semiconductor mean for Nokia and AXT

This morning mobile infrastructure company Ericsson (ERIC) and Taiwan Semiconductor (TSM) did what they said was positive for our shares of Nokia (NOK) and AXT Inc. (AXTI).

In its earnings comments, Ericsson shared that mobile operators around the globe are preparing for 5G network launches as evidenced by the high level of field trials that are expected to last at such levels over the next 12-18 months. Ericsson also noted that North America continues to lead the way in terms of network launches, which confirms the rough timetable laid out by AT&T (T), Verizon (VZ) and even T-Mobile USA (TMUS) with China undergoing large 5G field trials as well. In sum, Ericsson described the 5G momentum as strong, which helped drive the company’s first quarter of organic growth since 3Q 2014. That’s an inflection point folks, especially since the rollout of these mobile technologies span years, not quarters.

Turning to Taiwan Semiconductor, the company delivered a top and bottom line beat relative to expectations. Its reported revenue rose just shy of 12% quarter over quarter (3.3% year over year) led by a 24% increase in Communication chip demand followed by a 6% increase in Industrial/Standard chips. In our view, this confirms the strong ramp associated with Apple’s (AAPL) new iPhone models as well as the number of other new smartphone models and connected devices slated to hit shelves in the back half of 2018. From a guidance perspective, TSM is forecasting December quarter revenue of $9.35-$9.45 billion is well below the consensus expectation of $9.8 billion, but before we rush to judgement, we need to understand how the company is accounting for currency vs. slowing demand. Given the seasonal March quarter slowdown for smartphone demand vs. the December quarter and the lead time for chips for those and other devices, we’d rather not rush to judgement until we have more pieces of data to round out the picture.

In sum, the above comments set up what should be positive September quarter earnings from Nokia and AXT in the coming days. Nokia will issue its quarterly results on Oct. 25, while AXT will do the same on Oct. 31. There will be other companies whose results as well as their revised guidance and reasons for those changes will be important signs posts for these two as well as our other holdings. As those data points hit, we’ll be sure to absorb that information and position ourselves accordingly.

  • September quarter earnings from Ericsson (ERIC) and Taiwan Semiconductor (TSM) paint a favorable picture from upcoming reports from Nokia (NOK) and AXT Inc. Our price targets on Nokia and AXT shares remain $8.50 and $11, respectively.


Walmart embraces our Digital Innovators investment theme

Yesterday Walmart (WMT) held its annual Investor Conference and while much was discussed, one of the things that jumped out to me was how the company is transforming  itself to operate in the “dynamic, omni-channel retail world of the future.” What the company is doing to reposition itself is embracing a number of aspects of our Disruptive Innovators investing theme, including artificial intelligence, robotics, inventory scanners, automated unloading in the store receiving dock, and digital price tags.

As it does this, Walmart is also making a number of nip and tuck acquisitions to improve its footing with consumers that span our Middle-Class Squeeze and in some instances our Living the Life investing theme as well our Digital Lifestyle one.  Recent acquisitions include lingerie company Bare Essentials and plus-sized clothing startup Eloquii. Other acquisitions over the last few quarters have been e-commerce platform Shoebuy, outdoor apparel retailer Moosejaw, women’s wear site Modcloth, direct-to-consumer premium menswear brand Bonobos, and last-mile delivery startup Parcel in September.

If you’re thinking that these moves sound very similar to ones that Amazon (AMZN) has made over the years, I would quickly agree. The question percolating in my brain is how does this technology spending stack up against expectations and did management boost its IT spending forecast for the coming year? As that answer becomes clear, I’ll have some decisions to make about WMT shares and if we should be buyers as we move into the holiday shopping season.


Is Now the Time to Panic?

Is Now the Time to Panic?

What we are currently seeing in the market is a symptom of a whole lot of leverage in equities that had been in rich territory at a time when, even though it is still moving along, signs abound that the economy is slowing. Is this a ‘buy the dip’ opportunity or is it just the start of a much bigger downturn?

It has been a stormy week from the onslaught of hurricane Michael to the sea of red in global equity markets as the market shift we have been awaiting finally took hold. Wednesday the Dow lost over 800 points and had its worst day since February. The S&P 500 has had its worst losing streak in two years with over half of the S&P 500 at least two standard deviations below their 50-day moving average – the highest such percentage since March. A full two-thirds of the S&P 500 is now down 10% or more from their respective highs – that is a broad-based decline. The Russell 2000 has blown through all support levels down through its 200-day moving average. The once high-flying NYSE FANG+ Index has fallen more than 16% from its recent highs. All 65 members of the S&P 500 Tech sector closed in the red Wednesday, something we haven’t seen since the beginning of April.

Outside the US markets have been struggling even more – the US is just starting to catch up. Germany’s DAX is down to 6-month lows, the MSCI Asia-Pac Index hit a 17-month low, the Emerging Market index hit a 19-month low and 13 of the 47 members of the MSCI all-country index are down 10% or more year-to-date. Korea hasn’t seen a decline like this in 7 years. Taiwan hasn’t seen a decline of this magnitude in over 10 years. China’s Shanghai and Shenzhen Indices are at levels not seen since 2014. For those who regularly read on commentary on TematicaResearch.com, we’ve been pointing out for months that the large outperformance of US equities versus the rest of the world was unsustainable.


The big question on everyone’s mind now is, “Is this a ‘buy the dip’ opportunity or is this just the start of a much bigger downturn and what should we expect as we head into earnings season?”

Let’s start with earnings season which is likely to see the reporting quarter’s performance decent relative to expectations, so I’m not worried about meeting target numbers. What I am worried about is investor reactions and guidance. Since mid-September 48 of the S&P 1500 companies have reported and while their results relative to performance have been solid, only 10 companies have traded higher on their earnings day and the average stock has declined 3.8% on the day. This is an acceleration of the reactions we saw from investors last quarter.

Expectations are being adjusted. Over the past month, analysts have raised forecasts for 358 companies in the S&P 1500 and lowered them for 534 which is a net of 12.2% of the index adjusted downward, the most negative EPS revision spread since March 2017. We’d warned earlier in the year that the benefits from tax cuts and the massive injection of federal spending would likely translate into weakness in the later part of the year – well, here you have it. We are no longer seeing dramatic increases in earnings estimates while corporate guidance is slowing shifting to the downside.

Looking at factors affecting forward guidance, we are seeing rising costs across a broad range of inputs – energy, tight labor markets, higher interest rates and let’s not forget everyone’s favorite ongoing trade war. Earnings season also means that one of the major buyers of equities, companies themselves, is forced to sit on the sidelines for some time.

The big picture here is that global liquidity conditions have materially changed as central banks have shifted gears in an environment that is full of extremes.

  • Banks are shedding assets with several having announced layoffs in the credit loan groups as credit growth has been slowing.
  • China and Japan, two of America’s largest creditors to the tune of over $1 trillion, are reducing their exposure to Treasuries at a time when the nation is running fiscal deficits typically only seen during a war or major recession with debt to GDP reaching levels not seen since World War II.
  • This year the net flows into US mutual funds and ETFs is 46% below that experienced in the first three quarters of last year.


This contracting liquidity is occurring in the context of a variety of extreme conditions.

  • The recent tax cuts and federal spending boon represents the largest stimulus to the economy outside of a recession since the 1960s, that at a time when the economy is already above full employment.
  • We’ve seen an explosion in debt across the globe with the ratio of global debt to GDP rising from 179% in 2007 to 217% today, according to the Bank for International Settlements.
  • According to S&P Global Ratings, the percent of companies considered highly-leveraged (with debt-to-earnings ratio of 5x or more) has risen from 32% in 2007 to 37% in 2017 – so much for healthy balance sheets in the corporate sector.
  • Around 47% of all investment grade corporate debt is in the lowest category (BBB-rated) both in the US and Europe, versus just 35% and 19% respectively in 2007.
  • Total US non-financial corporate debt as a percent of GDP is near a post-World War II high.
  • The quality of corporate debt is at extreme levels as well with 75% of total leverage loan issuance in 2017 covenant-lite versus 29% in 2007.
  • There was an estimated $8.3 trillion in dollar-denominated emerging-market debt at the end of 2017, according to the Institute of International Finance, accounting for over 75% of all EM debt. According to Bloomberg, some $249 billion needs to be repaid or refinanced through next year with the US dollar having strengthened considerably against their local currencies, making that debt all the more expensive.
  • It isn’t just debt that is at extreme levels as the percent of household net worth in equities has never been higher.


The Bottomline on the Recent Market Turmoil

We’ve got a whole lot of leverage in the system with equities that had been in rich territory at a time when while the economy is still moving along, signs of slowing abound. Is this time to panic? Definitely not. The US stock market is getting in sync with what has been happening with yields, what is going on outside the US and with more realistic growth prospects. Both myself and Chris Versace, Tematica’s Chief Investment Officer, will be examining and re-examining thematic signals identify well-positioned companies in light of our 10 investing themes. This means being on the lookout for confirming data points that give comfort and conviction for positions existing Thematic Leader positions and opportunities to scale into them at better prices. It also means building a shopping list of thematically well-positioned companies to buy at more favorable prices.

This means asking questions like “Where will the company’s business be in 12-18 months as these tailwinds and its own maneuverings play out?”

A great example is Amazon (AMZN), which our regular readers know continues to benefit from our Digital Lifestyle investment theme and the shift to digital shopping, as well as cloud adoption, which is part of our Digital Infrastructure theme and with its significant pricing power, our Middle-Class Squeeze theme which focuses on the cash-strapped portion of the population. And before too long, Amazon will own online pharmacy PillPack and become a key player in our Aging of the Population theme. Amid the market selloff, however, the company continues to improve its thematic position. First, a home insurance partnership with insurance company Travelers (TRV) should help spur sales of Amazon Echo speakers and security devices. This follows a similar partnering with ADT (ADT), and both arrangements mean Amazon is indeed focused on improving its position in our Safety & Security investing theme. Second, Bloomberg is reporting that Amazon Web Services has inked a total of $1 billion in new cloud deals with SAP (SAP) and Symantec (SYMC). That’s a hefty shot in the arm for the Amazon business that is a central part of our Digital Infrastructure theme and is one that delivered revenue of $6.1 billion and roughly half of the Amazon’s overall profits in the June 2018 quarter.

At almost the same time, Alphabet/Google (GOOGL) announced it has dropped out of the bidding for the $10 billion cloud computing contract with the Department of Defense. Google cited concerns over the use of Artificial Intelligence as well as certain aspects of the contract being out of the scope of its current government certifications. This move likely cements the view that Amazon Web Services is the front-runner for the Joint Enterprise Defense Infrastructure cloud (JEDI), but we can’t rule our Microsoft or others as yet. I’ll continue to monitor these developments in the coming days and weeks, but winning that contract would mean Wall Street will have to adjust its expectations for one of Amazon’s most profitable businesses higher.

Those are a number of positives for Amazon that will play out not in the next few days but in the coming 12-18+ months. It’s those kinds of signals that team Tematica will be focused on even more so in the coming days and weeks.


Adding more Del Frisco’s to our plate following several bullish data points

Adding more Del Frisco’s to our plate following several bullish data points

Key points inside this issue

  • We are scaling into shares of Del Frisco’s Restaurant Group (DFRG) following several bullish data points from last week. Our price target for DFRG shares remains $14.
  • Our price target on Amazon (AMZN) remains $2,250
  • Our price target on United Parcel Service (UPS) shares remains $130
  • Our price target on Chipotle Mexican Grill (CMG) shares remains $550
  • Our price target on Costco Wholesale (COST) remains $250
  • I am reviewing our current price target of $130 for shares of McCormick & Co.
  • Last week’s podcast – Lithium Ion Batteries: The Enabler of the Digital Lifestyle
  • Last week’s Thematic Signals

Last Friday we received a number of positive data points for restaurant spending, which coupled with the latest US Department of Agriculture report on falling beef prices has me using the recent weakness in our Del Frisco’s Restaurant Group (DFRG) shares to improve our cost basis. Since adding DFRG shares to the portfolio, they’ve fallen nearly 10% since the end of August and just over 3% since we added them to our holdings despite favorable economic and industry reports. Part of that downward pressure came from Stephens throwing in the towel on its bullish stance on the shares last Wednesday. It would appear that Stephens jumped the gun given the favorable data that emerged later in the week.

Let’s review all of those data points…


August Retail Sales

The August Retail Sales report saw its headline figure come in at +0.1% month over month missing expectations of +0.4% and marked the slowest gain since February suggesting persistently high gas prices could be taking a bite out of consumer spending. With prospects for higher gas prices ahead following last week’s greater than expected crude inventory drawdown reported by the Department of Energy and the greater than expected jump in Total Consumer Credit for January, it would appear that Middle-Class Squeeze consumers slowed their spending in August vs. July. Hat tip to Tematica’s Chief Macro Strategist, Lenore Hawkins, and her coverage of those data points in last Friday’s Weekly Wrap. If I’m reading it, so should you.

Turning to the year over year view, August retail sales rose 6.2%, led by a more than 20% increase in gas station sales due to the aforementioned gas prices, and continued gains in Nonstore retailers (+10.4%) and food services & drinking places (+10.1%). Over the last three months, these last two categories are up 9.9% and 9.5% year over year, even as gas station sales are up nearly 21% by comparison. Those figures bode extremely well for our Digital Lifestyle positions in Amazon (AMZN) and United Parcel Service (UPS), our Clean Living holding that is Chipotle Mexican Grill (CMG) and Del Frisco’s Restaurant Group, a Living the Life company.

The report also offered confirming context for our shares in Costco Wholesale (COST) as its August same-store sales handily beat those contained in the August Retail Sales report. Also inside this latest missive from the U.S. Department of Commerce, grocery store sales rose 4.3% year over year in August, which keeps me bullish on our shares of McCormick & Co. (MKC) even as they hover over our current $130 price target.

In terms of areas reporting declines in August Retail Sales Report, we continue to see pressure at Sporting goods, hobby, musical instrument, & bookstores (-3.9%) and Department Stores (-0.7%), continuing the trend of the last few months. With Amazon continuing to flex its business model as well as its own line of private label products, including fashion, sportswear, and apparel, as well as continued digital commerce gains at Walmart (WMT) and its Bonobos brand, we see these retail categories remaining challenged in the coming months.


August restaurant data from TDN2K

On Friday we also received figures from TDn2K’s Black Box Intelligence that showed August same-store restaurant sales rose +1.8%, the best highest since 2015. TDn2K’s data is based on weekly sales from over 30,000 locations representing more than 170 brands and nearly $70 billion in annual sales. More positives for our positions in Chipotle and Del Frisco’s. I’ll tuck this data point away as well as the July and eventual September one to compare them against same-store sales quarterly results for out two restaurant holdings.


US Department of Agriculture

The most recent data published on Friday by the US Department of Agriculture showed cow prices were down 13.6% year over year in July, continuing the trend of double-digit year over year declines that began this past May. I see this as confirmation of deflationary beef prices that bode well for both margins and EPS gains at both Del Frisco’s and to a lesser extent Chipotle.

Later this week, I’ll look for further confirmation of beef deflation leverage when Darden Restaurants (DRI), the parent of Capitol Grill reports its quarterly earnings.


Scaling into Del Frisco’s shares

The net result of these three Friday data points has me adding to our Del Frisco’s Restaurant Group shares at current levels. If our Chipotle shares were lower than our entry point, I’d be doing the same, but they aren’t – if they do fall below the $473 layer, all things being equal I’d look to repeat today’s actions but with CMG shares.

  • We are scaling into shares of Del Frisco’s Restaurant Group (DFRG) following several bullish data points from last week. Our price target for DFRG shares remains $14.
UPDATE: Boosting our Costco Warehouse price target… again

UPDATE: Boosting our Costco Warehouse price target… again

Key points inside this issue:

  • We are boosting our price target on Costco Wholesale (COST) shares to $250 from $230.


Last Thursday night, Costco Wholesale (COST) once again shared blow away same-store-sales results this time for the month of August, which reflects the Middle-Class Squeeze tailwind as well as Costco’s positioning to ride our Digital Lifestyle investing theme as well. All told, sales for the period rose 12.2% to $11.0 billion, which capped the company’s August quarter with $43.4 billion, a 5.0% increase vs. the year-ago quarter, which was rather impressive given the year-ago quarter contained an extra week compared to this year. On a same-store sales basis, and stripping out foreign exchange and gas prices, Costco’s overall August sales climbed 8.0% year over year and 7.2% year over for the quarter.

Also impressive was the continued gains, both during August and the overall August quarter, for Costco’s e-commerce business, which was up 24.5% and more than 26%, respectively, when excluding the impact of gas and foreign currency.

And lest you think I forgot, Costco exited August with 762 active warehouse locations, up from 741 exiting a year ago, which bodes and 750 exiting its May 2018 quarter. The greater number of warehouse locations implies greater membership fees and higher membership fee income, which is not only a key differentiator vs. other retailers but also a prime driver of Costco’s EPS.

With consumers feeling the pinch of higher debt levels and inflation, with wage growth only now starting to move, I continue to see Costco extremely well positioned as we move into the seasonally strong shopping season that is the last four months of the year. As the company continues to ride these two thematic tailwinds, I see further upside ahead in the coming months and am boosting our COST price target to $250 from $230. A portion of that increase reflects the move up in EPS expectations over the last 90 days due to the robust same-store sales reports and increases in open warehouse locations, with the balance tied to multiple expansion as Costco continues to shake out Amazon concerns and deliver results that are the envy of the vast majority of brick & mortar retailers. Even as this price target is boosted, we would not chase COST shares at the current share price, but rather sit back and enjoy the ride.

  • We are boosting our price target on Costco Wholesale (COST) shares to $250 from $230.